With the cloud migration, Prometheus has become a foundation for our cloud-native environment. It’s become our flying cockpit when starting our journey in the world of Kubernetes. But there are a few challenges that need considering first to avoid bad experiences in the Kubernetes world. In this blog, I’ll dive into detail about what Prometheus is, how it works, and what challenges you may face when leveraging it in your enterprise environment. Before we go any further, let me tell you what Prometheus is – if you don’t already know.
What is Prometheus?
Prometheus is an open-source monitoring and alerting toolkit that’s been heavily adopted by many companies and organizations, and its popularity has grown due to the large number of Exporters built by the community. The toolkit collects and stores metrics in a time-series database, which in simple terms means metrics information is stored with the timestamp at which it was recorded, alongside optional key-value pairs called labels. Prometheus labels could be compared as Dynatrace metric dimensions.
How Prometheus works
The concept is simple—it’ll collect metrics from each target defined in the configuration file. Targets are external solutions exposing metrics in a Prometheus format, and the targets are called exporters in the Prometheus terminology.
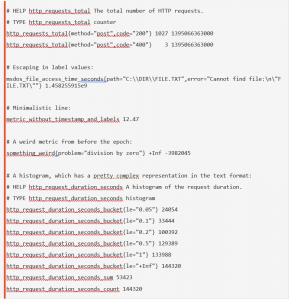
Prometheus has all the expected features to observe any of your cloud-native technology, including:
- Many exporters, built by the community and vendors, allowing us to collect metrics on:
- Hardware (Netgear, Windows, IBM Z, etc.)
- Database (MySQL, CouchDB, Oracle, etc.)
- Messaging (MQ, Kafka, MQTT, etc.)
- Storage (NetApp, Hadoop, Tivoli, etc.)
- Others (Gitlab, Jenkins, etc.)
- An SDK allowing us to expose our custom metrics in a Prometheus format
- Automation. All the configuration of Prometheus and Grafana could be done automatically by:
- Modifying the right configuration files:
- Prometheus.yaml to add new scraping endpoints (exporters)
- Alertmanager.yaml to define new alerts in Prometheus
- Build graphs as code using the JSON format of Grafana.
Now we know the features Prometheus provides to observe your technology, let’s discuss how this works in more detail. It relies on two services:
- The Prometheus server
- This includes:
- A retrieval component in charge of collecting metrics from the various exporters (a solution exposing metrics in a Prometheus format is called an exporter)
- A storage component that will store the metrics collected in a time-series database
- An HTTP server providing a UI to build our PromQL and API that will be used by Grafana to display the metrics in a dashboard.
- This includes:
- The alert manager
- An alert manager is a tool used to raise alerts based on the rules defined in Prometheus.
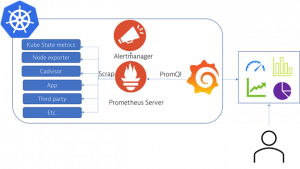
Most users are deploying it with the help of a Helm Chart, which will automatically deploy the following components in your Kubernetes cluster:
- The Prometheus Server (also known as The Prometheus Operator)
- The Alert Manager
- Several exporters:
- Kube State metrics
- Node exporter
- Cadvisor
- Grafana
These standard exporters provide the level of detail required to measure the health of our Kubernetes cluster. Now let’s dive a little deeper into what each exporter does:
- Kube State metrics will report all metrics related to:
- Node status, node capacity (CPU and memory)
- Replica-set compliance (desired/available/unavailable/updated status of replicas per deployment)
- Pod status (waiting, running, ready, etc)
- Resource requests and limits
- Job & Cronjob Status
- Node Exporter will report hardware and OS metrics exposed on each node of our cluster.
- Cadvisor will collect metrics related to the health of your containers.
With each exporter, you can easily include the configuration of your dashboard, alerts, and deployment of your new exporters in your continuous delivery processes.
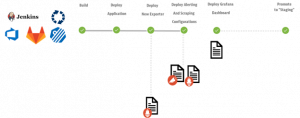
The Prometheus Operator also introduces additional resources in Kubernetes to make your scraping and alerting configuration much easier:
- Kubernetes
- ServiceMonitor
- Alertmanager
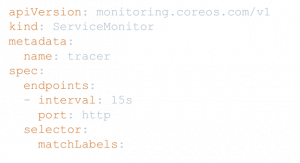
The ServiceMonitor will map all the services that expose Prometheus metrics.
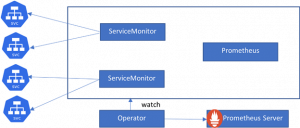
The ServiceMonitor has a label selector to select services and the information required to scrape the metrics from the service:
- Port
- Interval
What are the limitations?
Unfortunately, Prometheus has few limitations relevant for enterprises. This means the owner is responsible for thinking about how to appropriately carry out these actions when introducing it to an organization:
- Security: Not secure by default
- Access control: Everyone can see all data by default
- Scalability: Only vertical, not horizontal scaling
- Global visibility: Requires extra components
Let’s briefly look at these limitations one by one:
Security: Not secure by default
Currently, Prometheus doesn’t have native support for:
- TLS
- Authentication mechanism
In the digital transformation space, we’re all aware that data can be very sensitive. Most organizations have very strict rules when it comes to security. Not having support for these requires setting up the current workaround by delegating the SSL handshake to solutions like Nginx.
Access Control: Everyone can see all data by default
The Prometheus operator will collect metrics from all the exporters that have been deployed and configured within your cluster. This means anyone can see your data from the Prometheus UI. If you want to limit access to certain metrics, you can do so by applying filters in your Grafana dashboards. However, there are no features to handle the access to your metrics based on privileges.
Scalability: Only vertical not horizontal scaling
Prometheus is a great solution, but it hasn’t been designed to scale. The biggest limitation is it’s not designed to scale horizontally, which means you can’t add several Prometheus servers to load balance the workload. Instead, it’s only able to scale vertically, meaning you need to add more resources to have a bigger Prometheus server.
Once deployed there is a big chance that:
- Your organization starts to utilize many exporters to report:
- Health metrics
- The efficiency of your CI/CD process
- Release management data
- Ops metrics to keep track of your operations tasks (I.e., backup)
- Your Developers understand the value of adding custom metrics with business information and technical details on the behavior of their application.
While your organization is finalizing its digital transformation, the number of services in Kubernetes will increase and the metrics collected by Prometheus will rise.
“Diseases” in Prometheus can be detected by observing issues when refreshing your Grafana dashboard. The memory usage of Prometheus is directly related to the number of time-series data stored in the server.
Keep in mind that a million metrics will consume approximately 100 GB of RAM. So, if you don’t pay attention, Prometheus could eat up most of the resources of your Kubernetes cluster.
Global visibility: Requires extra components
To avoid the technical limitations mentioned above, we can use the strategy of having several small Kubernetes clusters rather than a few huge clusters to handle our application workload.
If you’re handling several clusters, this would mean having several Prometheus servers and Grafana to manage. Which begs the question, how can we guarantee our project owners and operators can see the data from various clusters? Well, the short answer is to create one big Grafana server that will be connected to all your Prometheus servers. Whilst this adds extra complexity in the maintenance of our Prometheus architecture, it allows us to provide visibility to our team members. Or you can simply utilize services offered by the cloud provider of the market:
Solutions
So, how can we resolve all these constraints without adding extra tasks on the shoulders of our Kubernetes Operators? There are several solutions that make Prometheus Stronger, like Thanos, that will resolve scalability and security.
But there’s another challenge we all want to resolve when implementing observability in our environments which are attaching our metrics, logs, traces to a context.
The latest version of the Dynatrace k8s operator can ingest Prometheus metrics directly from the exporters, resolving this common challenge.
The Dynatrace Prometheus OpenMetric ingest has several advantages, including:
- Automatically collect metrics exposed by your Prometheus operator
- Reduce the workload on your Prometheus server
- Secure the data collected by Dynatrace
- And it doesn’t change the process of your K8s operator team.
If you want to learn more, watch our performance clinic on K8S monitoring at scale with Prometheus and Dynatrace below:



Looking for answers?
Start a new discussion or ask for help in our Q&A forum.
Go to forum