Synthetic monitors provide a perfect means of continually monitoring the performance baselines of your web applications. However, understanding the performance of different application types requires an emphasis on different performance metrics, that is, key performance metrics.
- For many traditional web applications, User action duration is considered the best metric available for web-performance optimization.
- Single Page Applications (SPAs), on the other hand, require a focus on the actual timings that reflect how quickly an end user can initiate a follow-up action with your application.
- There are other applications where the UI isn’t as important as the speed of interaction with the application. If your end users are experts and often work using short cuts, then the time it takes to interact with the application (i.e., how long it takes the JavaScript to load) is more important than, for example, ensuring that all images are loaded.
Key performance metrics provide tailored insights for each application type
To provide our customers with the flexibility they need, we introduced the concept of key performance metrics in Real User Monitoring last year. Now, we bring the same concept and functionality to synthetic browser and clickpath monitors, along with a new and improved user interface.
With key performance metrics and key user actions, you can now pick the ideal performance metric and expected performance goals that best fit each user action type. Dynatrace key performance metrics enable you to respond to the variable conditions for each application you monitor.
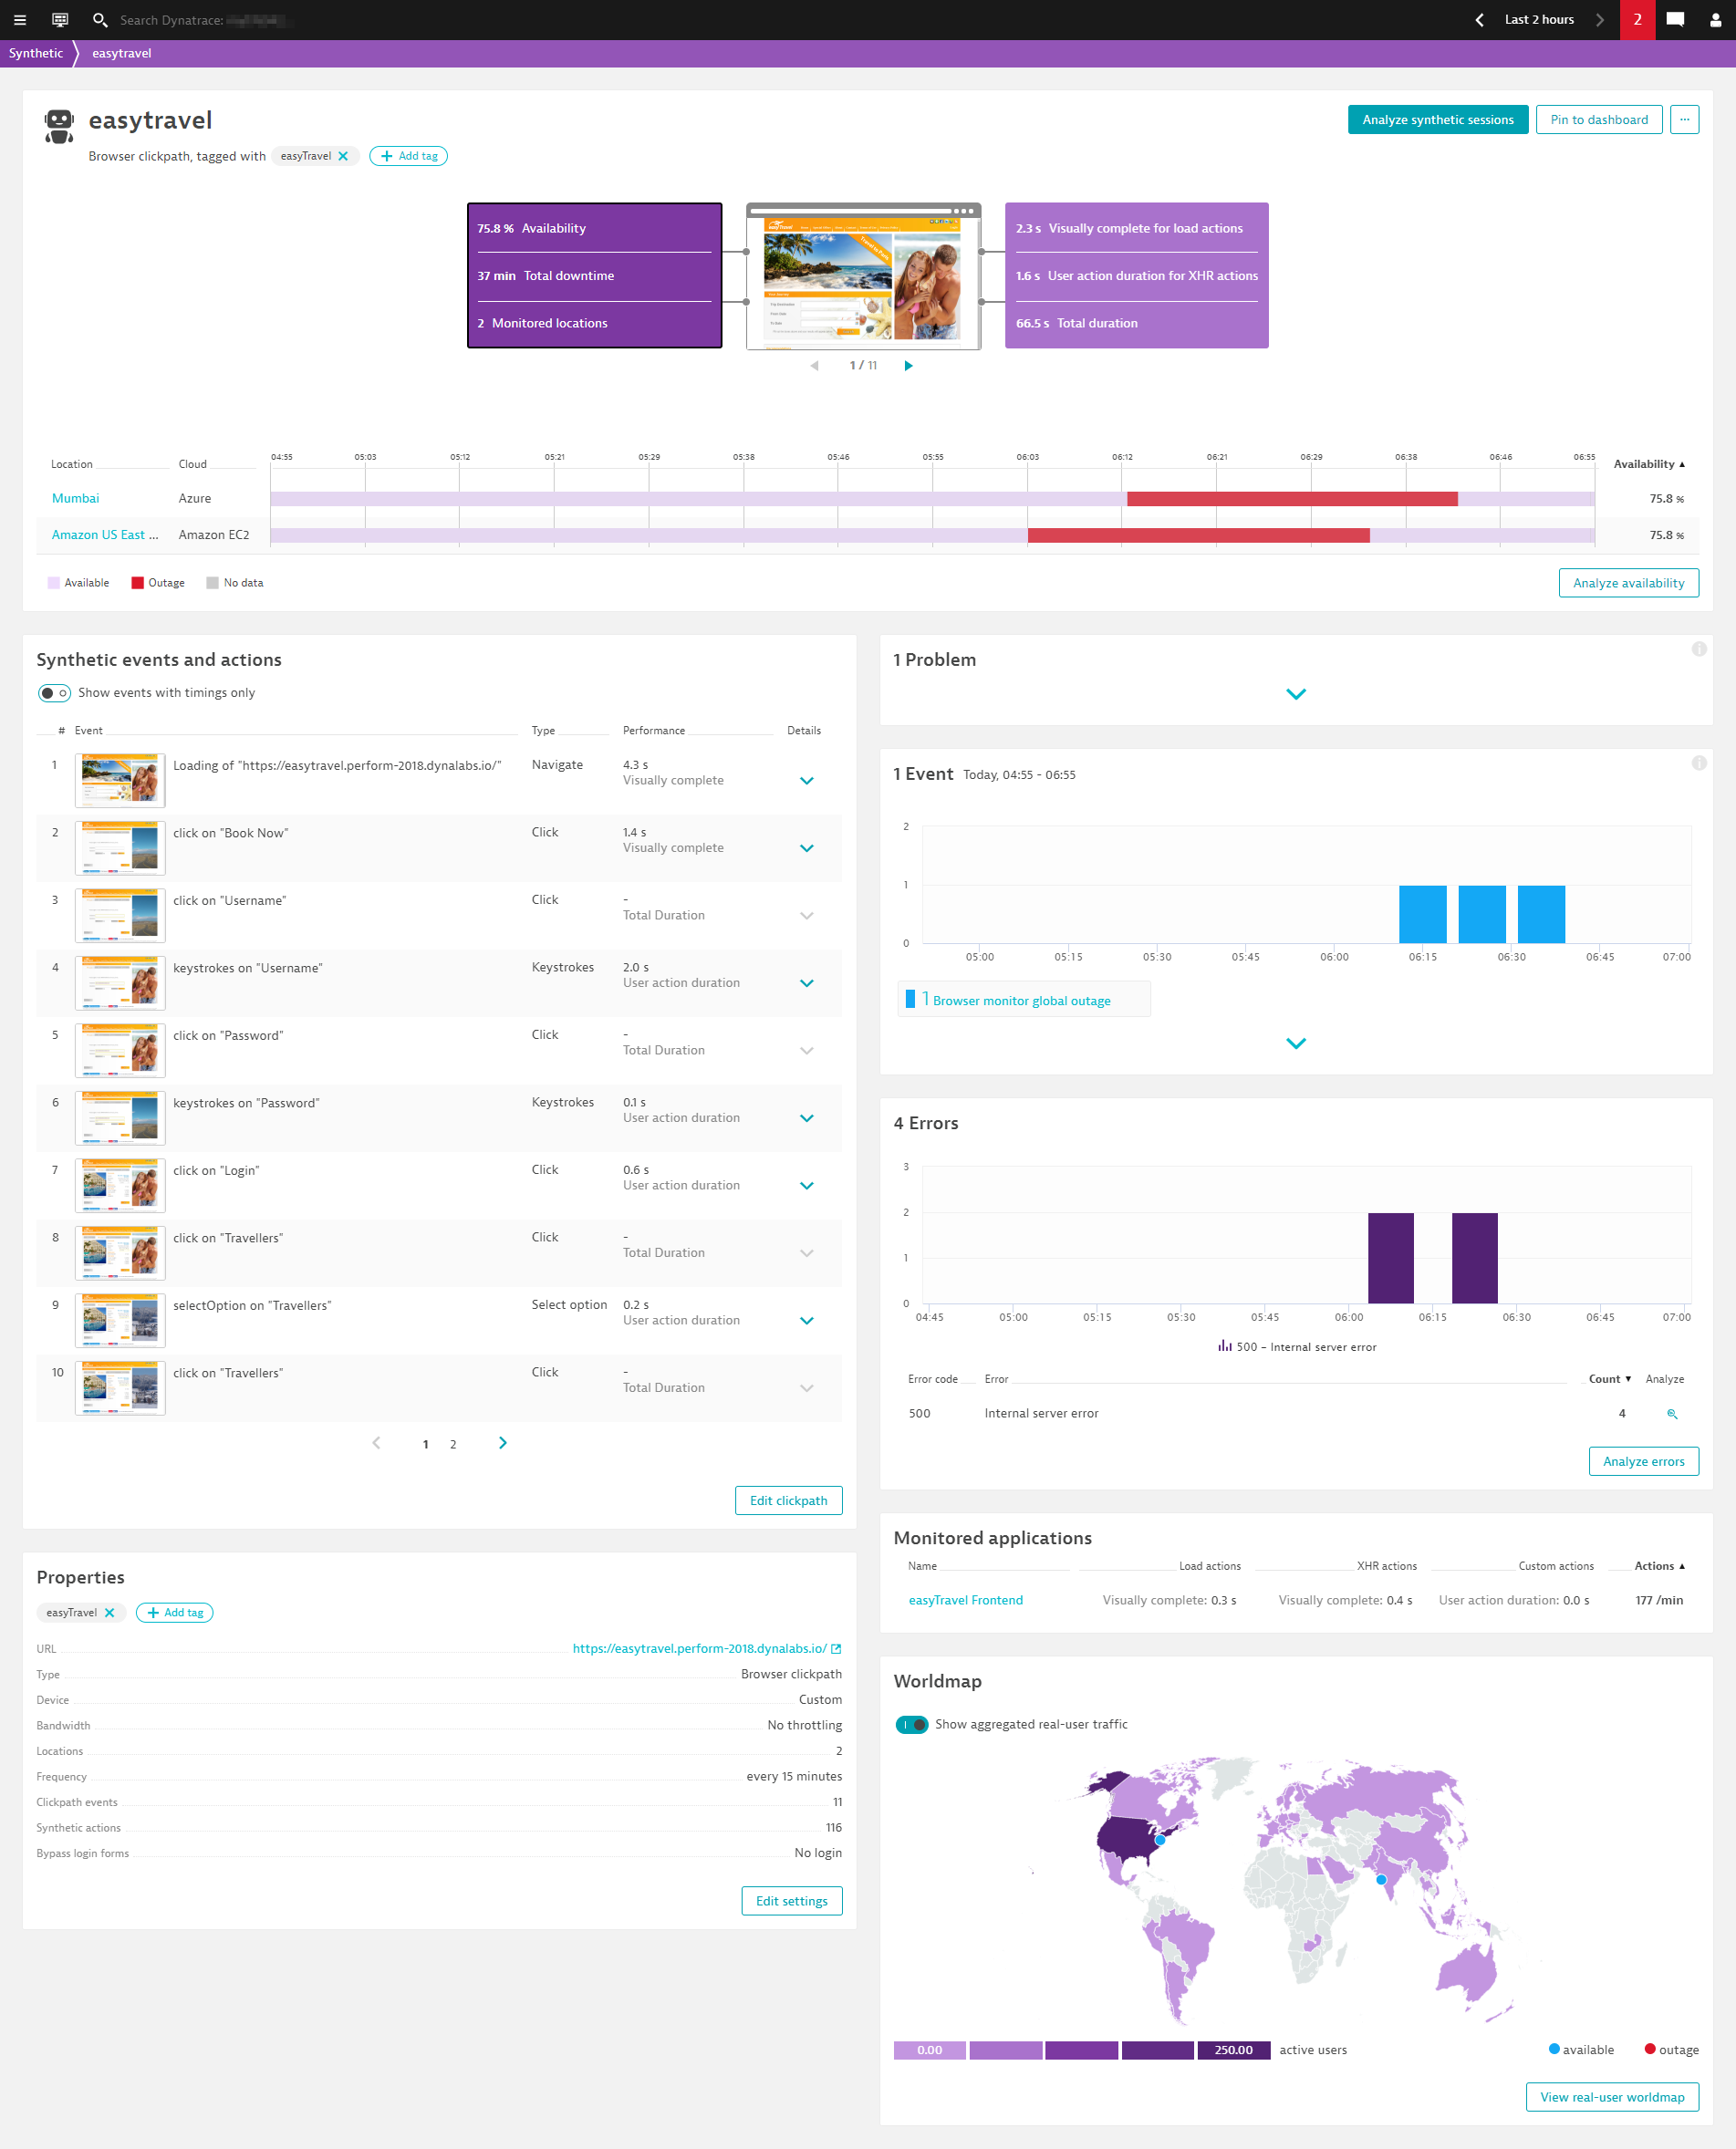
Pick the best metrics for your application
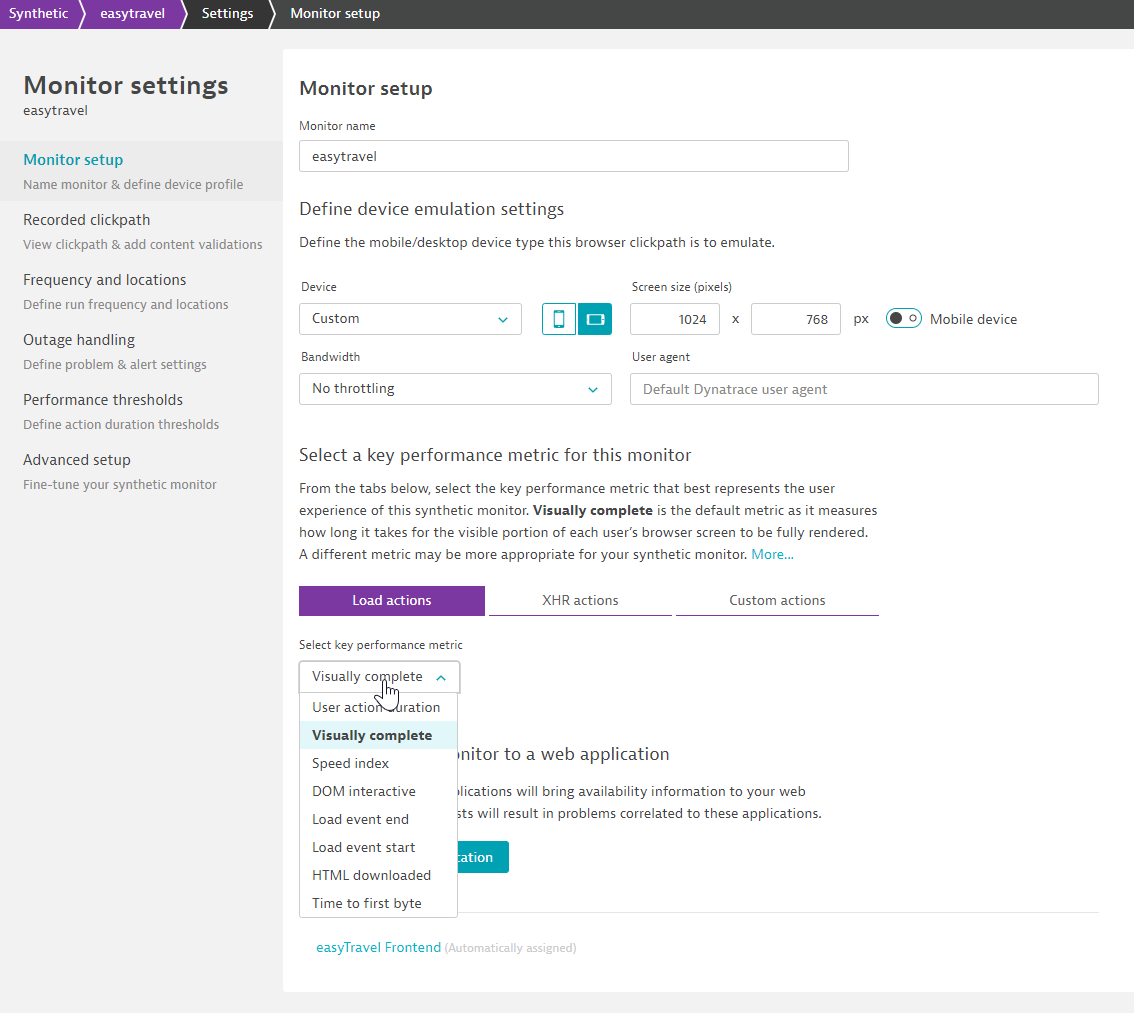
When looking at performance metrics for web applications, picking the best performance metric depends on the type of application monitored. With key performance metrics, you can switch between metrics like Visually complete, Speed index, DOM interactive, User action duration, HTML downloaded, Time to first byte, and more at any time.
Dynatrace captures all these metrics out of the box, so whenever you switch your key metric, you have historical data available. You can choose a different key metric for load and XHR actions. The default for both is Visually complete (as it is in Real User Monitoring). To change the key performance metric, navigate to monitor settings.
Key performance metrics come with a new UI
The first thing you’ll notice when you activate key performance metrics is the new user interface of the Synthetic details page for viewing the results of your browser monitors and clickpaths. You’ll notice from the infographics and charts below that availability and performance data is now displayed in two separate boxes. On the left, you get an overview of availability for the selected time frame—overall availability, total downtime, and the number of monitored locations.

On the right, the performance overview shows an average for the key performance metric of your browser or clickpath monitor, split by load and XHR actions. Additionally, the Total duration (previously called Duration) is displayed. An important difference between Total duration and the key performance metric (e.g., Visually complete) is that the values displayed for load actions and XHR actions are averages across all actions.
For example, think about a login transaction consisting of three steps (events) resulting in one load action each:
- Initial page load (1 sec Visually complete)
- Click on login (5 sec Visually complete)
- Navigate to another page (3 sec Visually complete)
The average Visually complete timing for these load actions is 3 sec while the Total duration could be 9 sec.
We believe, in most cases, that it makes more sense to look at the average KPM values for different action types (load and XHR actions) instead of the sum as the timings of different action types have very different characteristics.
Synthetic events and actions card
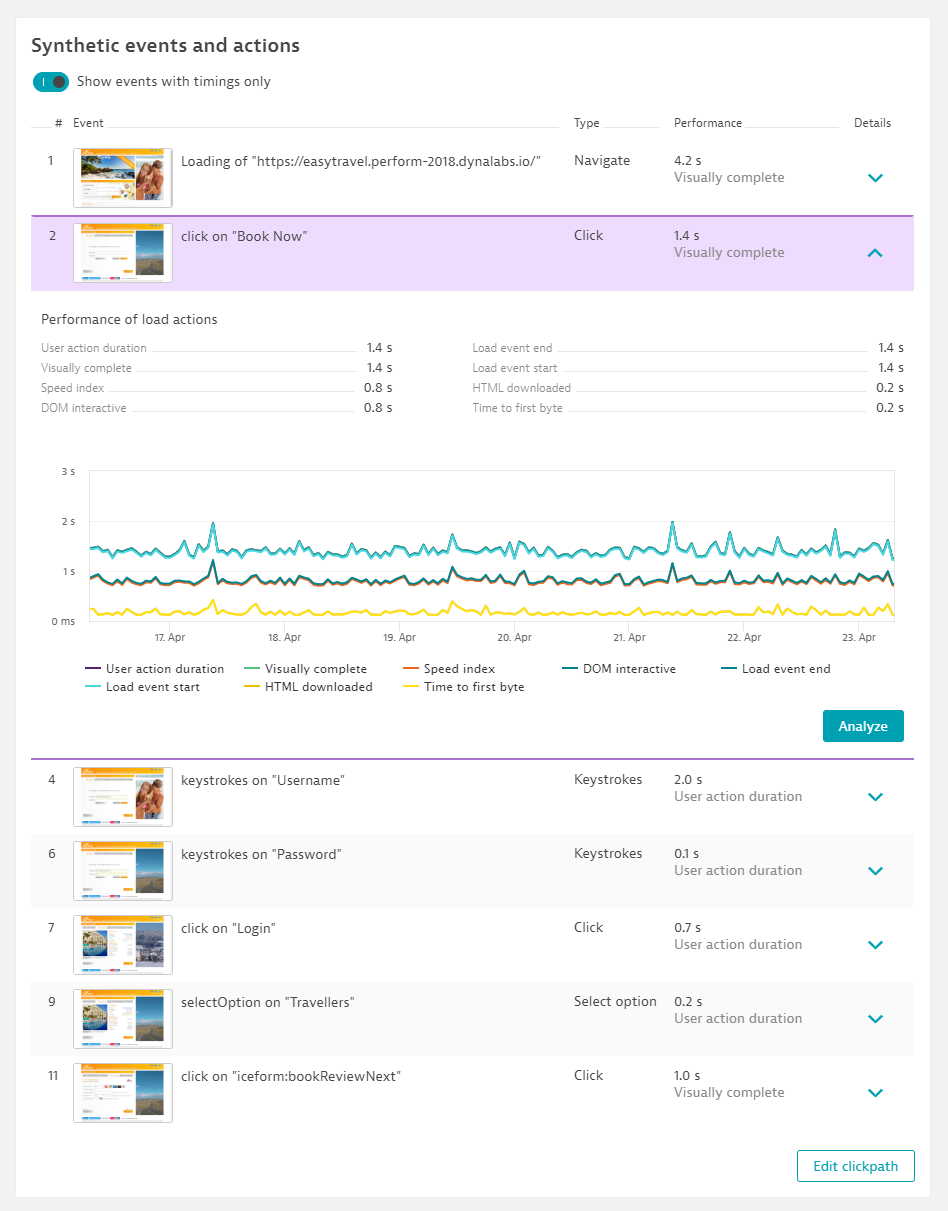
A question that came up quite often in the past was, “I recorded x synthetic events (steps)—why does Dynatrace only show y?” With the new Synthetic events and actions card, we’ve tried to make the distinction between events and actions clearer.
Events (steps) are all interactions you record and are therefore simulated during the playback of a synthetic clickpath. Not all events necessarily trigger network requests, for example, clicking an input field or entering text into a form. These events are important from a functional perspective but don’t generate any performance data. With the new UI, it’s now easy to switch between synthetic events without and with timings (synthetic actions)—just use the toggle at the top of the card.
For each synthetic action, you see the average timing of your selected key performance metric. If you expand an action, you can compare all key performance metrics in one chart.
Problems, events, and errors
The problem card is unchanged—here you see active and past problems involving the synthetic monitor during the selected time frame as well as configured maintenance windows. (For additional information on synthetic alerting see Synthetic alerting overview.)
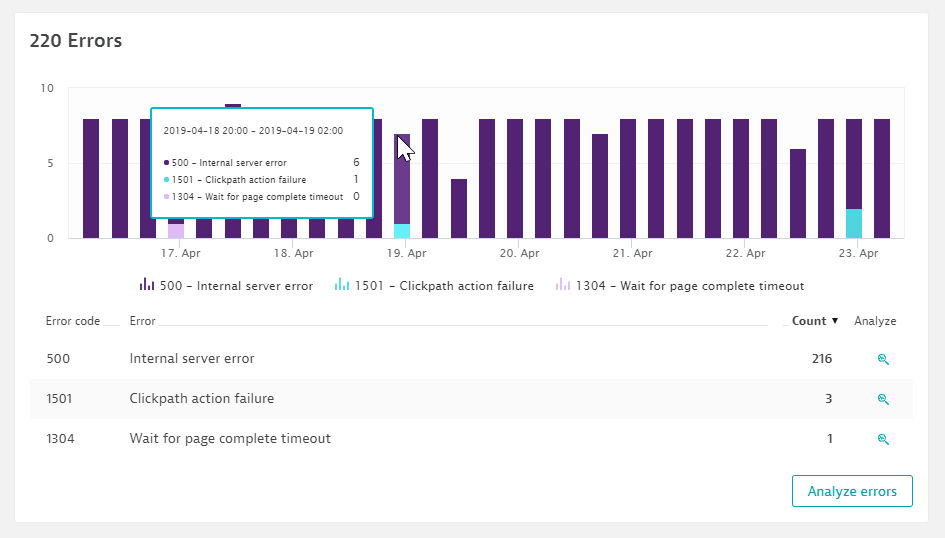
The event card shows all events that can lead to problems. Also, custom events you could ingest into Dynatrace show up in this card. Additionally, the error card displays an overview of all failed executions of the synthetic monitor with the corresponding error code. It’s an easy way to quickly find the main reason for monitor failures.
Real User Monitoring & Synthetic Monitoring—better together
If Real User Monitoring (RUM) is enabled for the web application(s) the synthetic monitor runs against, Dynatrace automatically links the RUM applications to the synthetic monitor, and the Monitored applications card is displayed. You can see the key metrics of the application and can jump directly to RUM data from here.
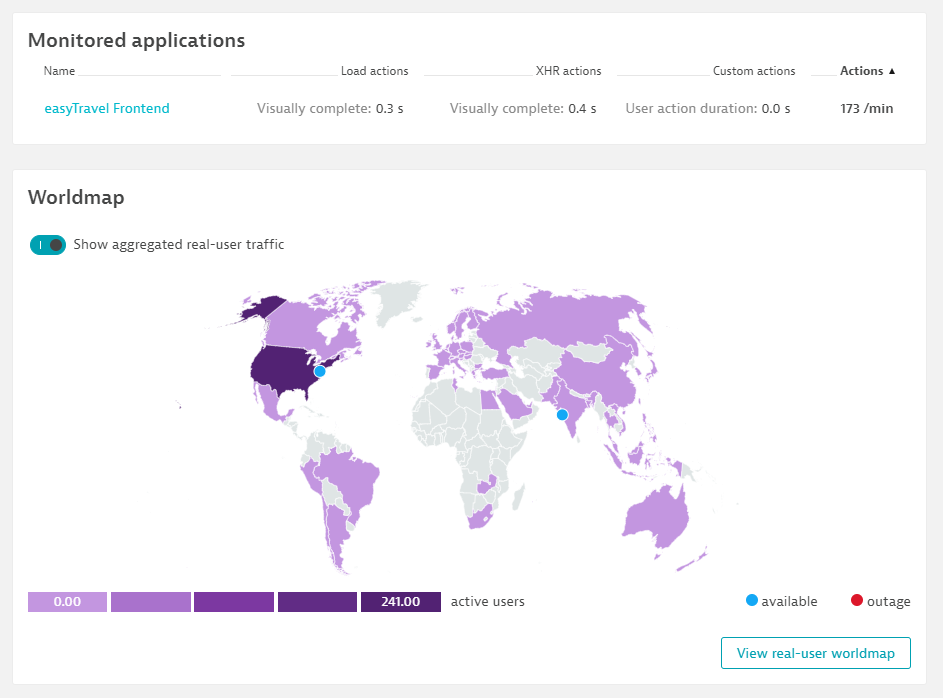
Additionally, we’ve introduced a World map panel where you can distinguish global vs. local outages at a glance. If a RUM application is linked to the monitor, you’ll see a toggle to augment the world map with RUM data. In case of an outage, you can immediately compare the RUM traffic. The RUM data is also a good indicator of which public locations you should run your synthetic monitor from.
Switch now
Starting with Dynatrace version 1.167, you’ll see a call-to-action banner on the Synthetic dashboard list view as well as in Synthetic details to enable key performance metrics. You’ll have at least 30 days of historical performance data available. Disclaimer: Older performance data won’t be accessible anymore as the data format was changed. Availability data is not affected.
What’s next
If you drill down to analyze specific synthetic executions, you’ll notice that we’ve also reworked the Analysis page. You can now analyze your synthetic data across multiple dimensions similar to the multi-dimensional analysis available for RUM data.
I’ll cover these changes in detail in an upcoming blog post, so stay tuned!
If you’re just get started with Dynatrace Synthetic Monitoring, check out this recently recorded performance clinic.
More information on key performance metrics
- Key performance metrics for RUM blog post
- Key performance metrics help page (for RUM as well as Synthetic Monitoring)
- Metrics matter blog post
- User actions help page



Looking for answers?
Start a new discussion or ask for help in our Q&A forum.
Go to forum