
Enterprises invest in cloud platforms like Cloud Foundry to increase agility and accelerate innovation. Cloud Foundry enables organizations to build and run applications at scale. But what should you do when you experience increased response times or failure rates for your Cloud Foundry applications even when the performance of the actual application components seems fine?
Cloud platform health for application health
Sometimes, platform components, such as Diego cells, Gorouters, or Auctioneers, are the culprit of slowdowns and failures of your Cloud Foundry applications. By providing full-stack visibility and AI-powered root cause analytics, Dynatrace can help platform operators ensure the health of their Cloud Foundry foundations, which are a fundamental component of application health. Dynatrace supports the automated deployment of Dynatrace OneAgent onto Cloud Foundry foundations using mature Cloud Foundry-native mechanisms like the OneAgent BOSH add-on (for full-stack monitoring) or Cloud Foundry buildpacks (for application-only monitoring). Also, Dynatrace detects and supports Cloud Foundry platform components like Gorouters, Diego cells, and Auctioneers as first-class citizens.
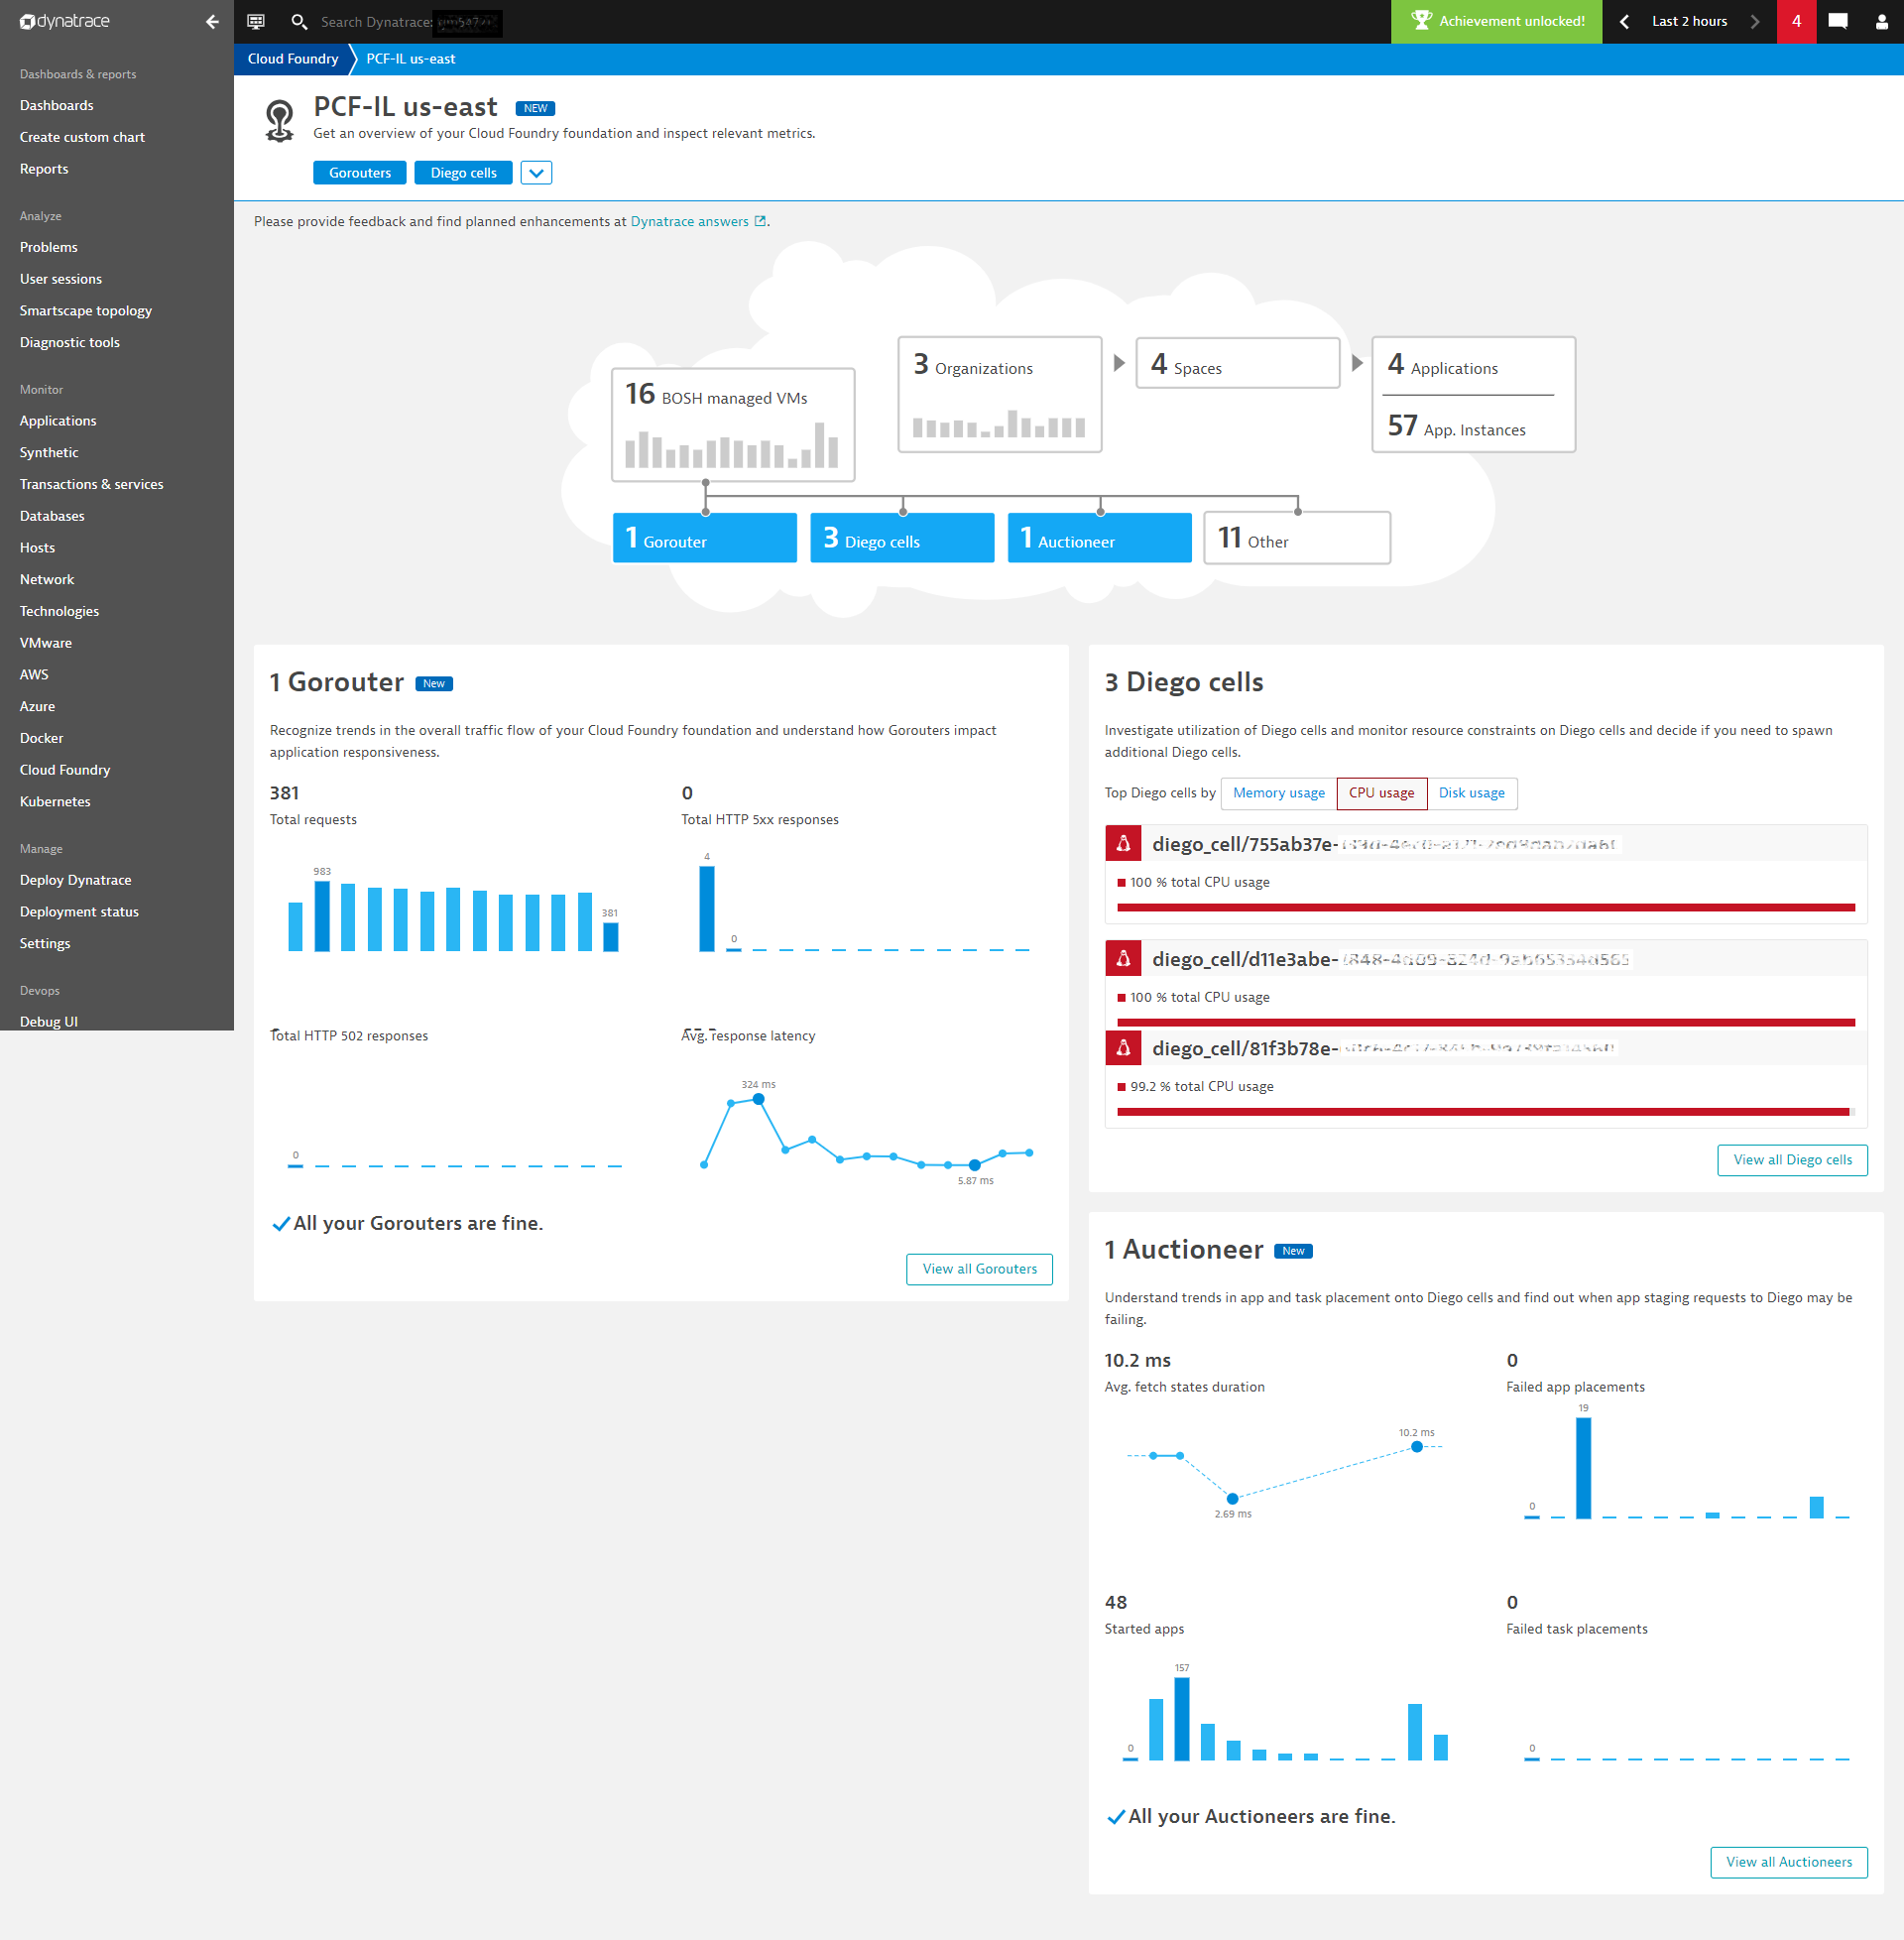
With the release of OneAgent version 1.165 and Dynatrace version 1.166, Dynatrace OneAgent now detects the BOSH stemcell version as well as the Cloud Foundry vendor and the Pivotal Cloud Foundry PAS version. We’ve also enhanced the Cloud Foundry overview page by adding a dedicated Properties tile (see example above) and by improving the infographics at the top of the page to better reflect cloud platform health for application health.
Deeper insights and smarter AI with every product release
We’re committed to improving Dynatrace Cloud Foundry monitoring capabilities with each product release. Read on to learn about recently introduced features that are crucial to Dynatrace full-stack monitoring support for Cloud Foundry.
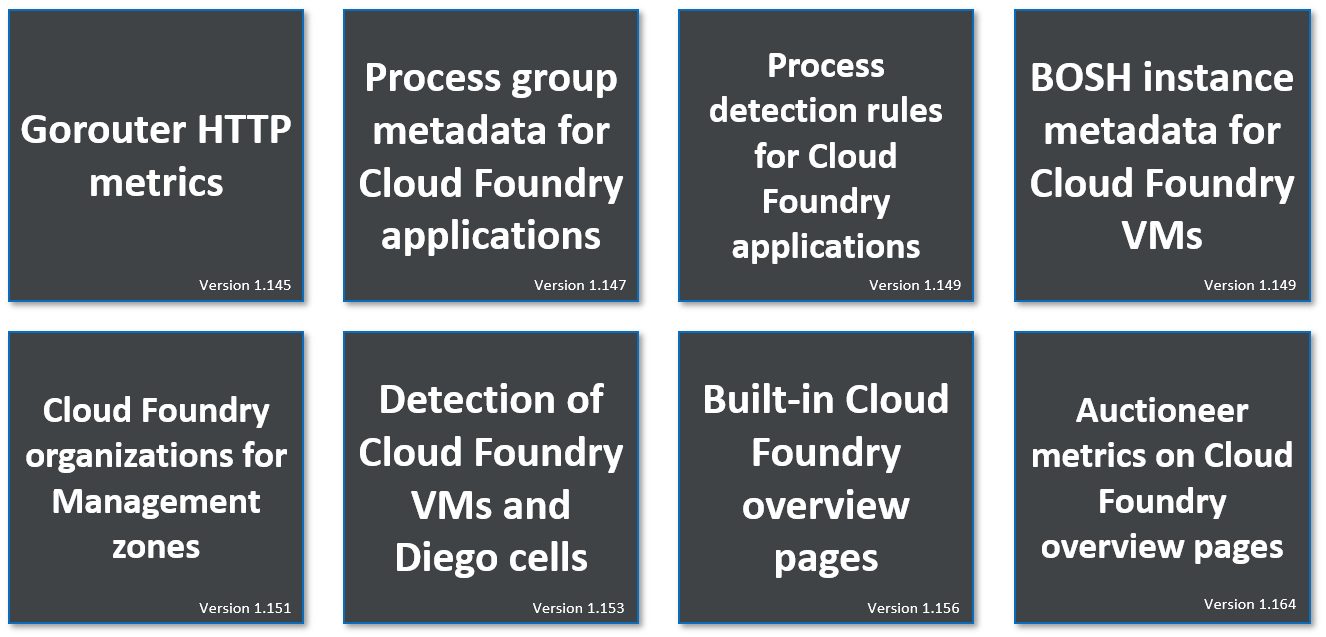
Gorouter HTTP metrics
Identify if Gorouter processes have a negative impact on your overall application responsiveness
With Dynatrace, you get insights into the overall traffic flow of your Cloud Foundry foundation based on the number of total requests aggregated across all Gorouters. Dynatrace even indicates if Gorouter processes have a negative impact on your overall application responsiveness based on response latency. Repeatedly crashing applications or response issues from applications typically result in an increased number of HTTP 5xx or HTTP 502 responses, which Dynatrace OneAgent also detects. You’ll find details about these use cases in our recent Gorouter metrics blog post.
Process group metadata for Cloud Foundry applications
Enrich Cloud Foundry applications with metadata such as application owner or a link to a GitHub repository
Dynatrace supports you in defining your own process group properties via any user-provided Dynatrace Cloud Foundry service that’s bound to your application. This capability allows you to add information about, for example, the owner or GitHub repository of a Cloud Foundry application. You can also add version information related to the application itself or used Cloud Foundry buildpacks. Check out this blog post about process group metadata for Cloud Foundry applications for more details on the supported use cases.
Process detection rules for Cloud Foundry applications
Customize the composition of Cloud Foundry process groups even in application-only mode
We’ve made process group detection rules available for all Cloud Foundry buildpack integrations. This enables you to adapt the composition of Cloud Foundry process groups also in application-only mode. This can be helpful for monitoring blue/green deployment scenarios. Please note that process group detection settings and rules only affect the composition of process groups. If you want to change how a process group is named, you have to use process group naming rules instead.
BOSH instance metadata for Cloud Foundry VMs
Organize large-scale Cloud Foundry environments based on auto-detected BOSH instance metadata
In addition to general-purpose host properties like virtualization and architecture, Dynatrace OneAgent also automatically detects BOSH instance metadata for your Cloud Foundry foundation VMs:
- BOSH Instance ID—Unique identifier of a BOSH-managed VM
- BOSH Instance Name—Name of a BOSH-managed VM
- BOSH Availability Zone—Location information for a BOSH-managed VM
- BOSH Deployment ID—Unique identifier of the deployment that a BOSH-managed VM belongs to
You can use the automatically discovered BOSH instance metadata to manage large Cloud Foundry environments in several ways, for example, for auto-tagging rules based on BOSH instance metadata to group all entities that belong to the same BOSH deployment. To learn more, check out our blog post about leveraging BOSH instance metadata.
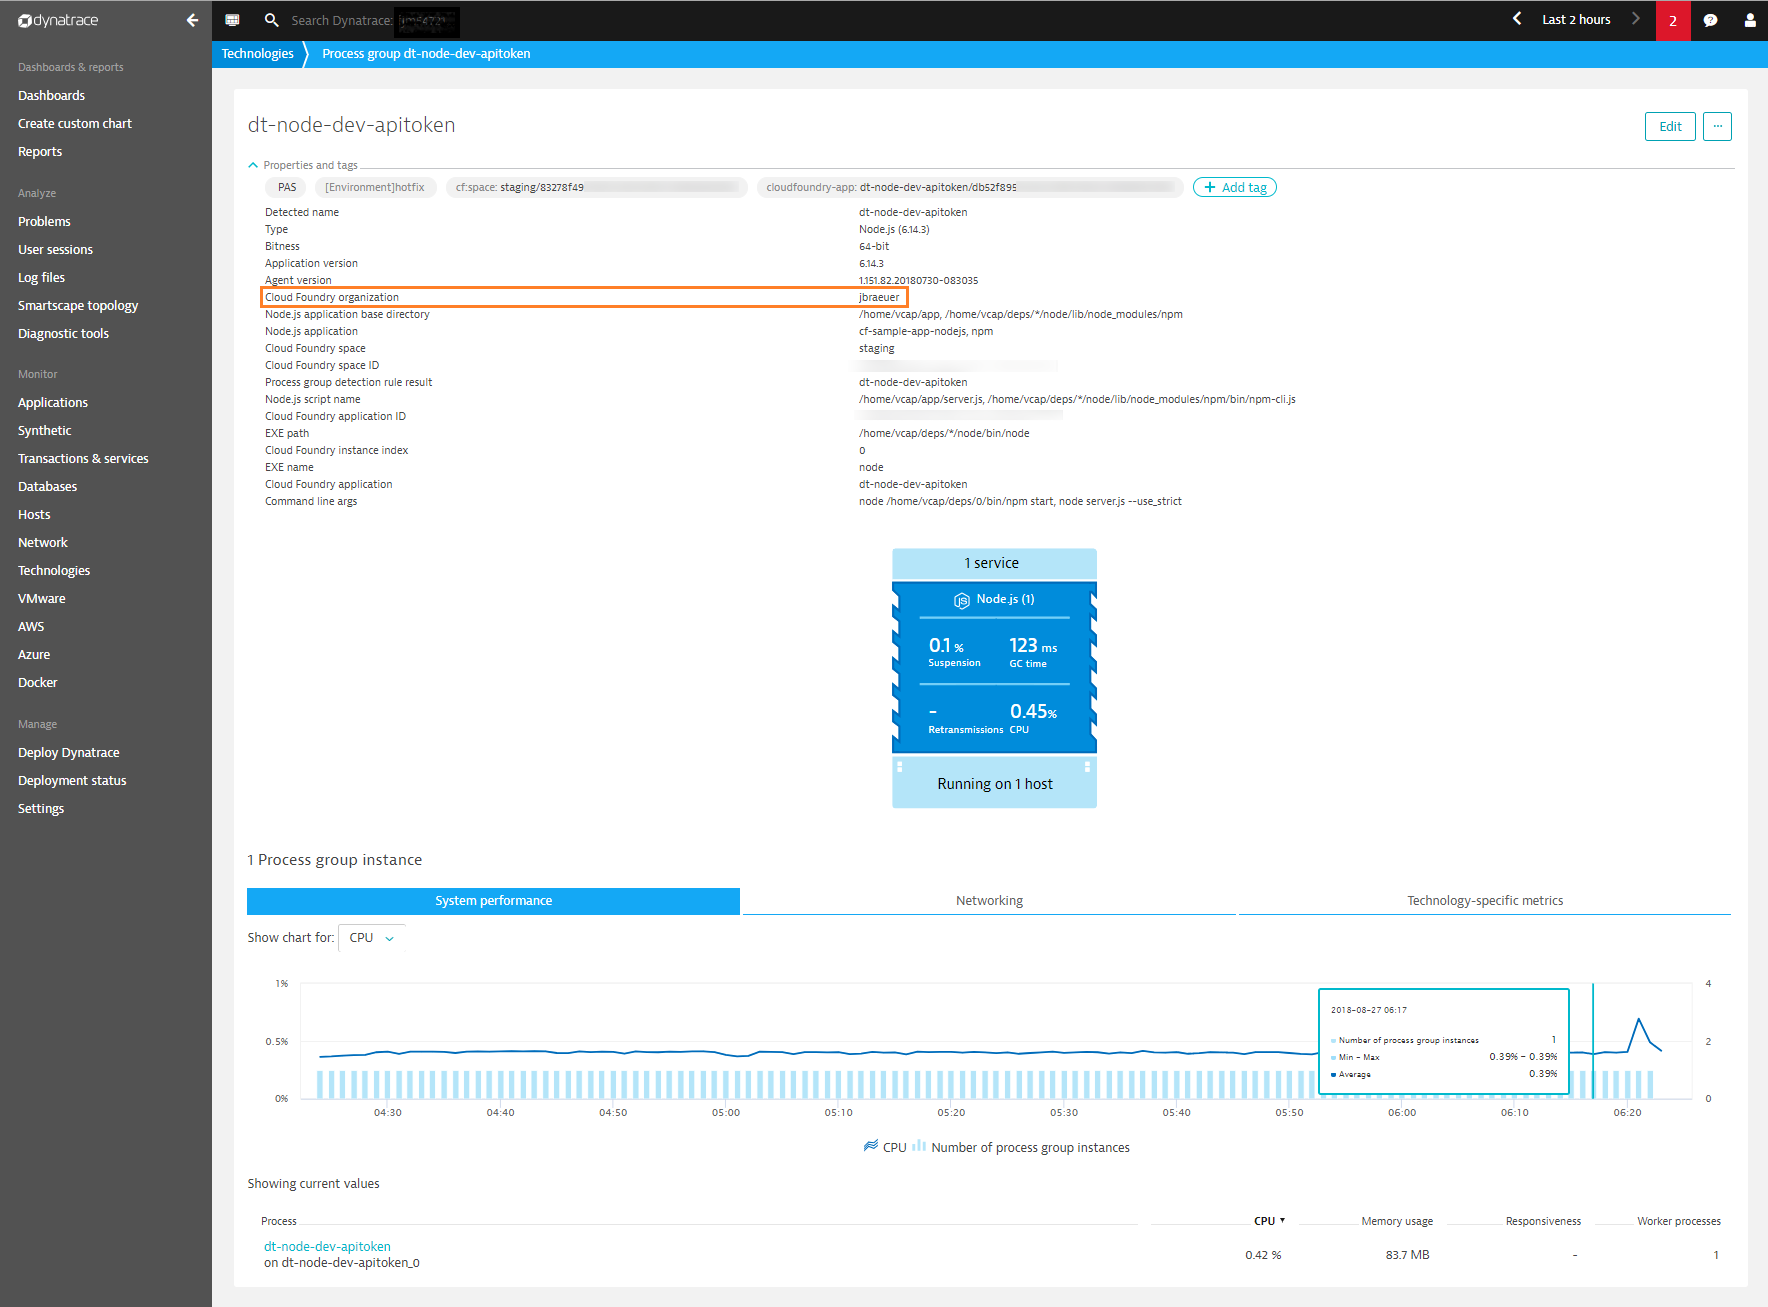
Cloud Foundry organizations for management zones
Slice and dice your Dynatrace environment with management zones that reflect Cloud Foundry organizations
Dynatrace automatically detects the organizations that are related to your Cloud Foundry foundations. The Cloud Foundry organization property exists at the process level with the other Cloud Foundry properties that Dynatrace detects automatically: space, space ID, application, application ID, and instance index (see example below). You can leverage the Cloud Foundry organization property to create management zones that represent your Cloud Foundry organizations, including any associated applications that are hosted by these organizations. You can learn more from our blog post about using Cloud Foundry organizations within Dynatrace and help guidelines on how to connect your Cloud Foundry foundation.
Detection of Cloud Foundry VMs and Diego cells
Benefit of automatically detected technology types like Diego cells or BOSH
Dynatrace OneAgent automatically detects Cloud Foundry hosts of the technology type Diego cell. You’ll find this information as part of the Technologies property at the host level. The technology type Diego cell is available for auto-tagging, host and process group naming rules, and management zones. In the meantime, we’ve extended detection support to also cover BOSH and the BOSH stemcell version, the Cloud platform type as well as the Cloud Foundry vendor and the Pivotal Cloud Foundry PAS version, and the Cloud Foundry foundation a host belongs to.
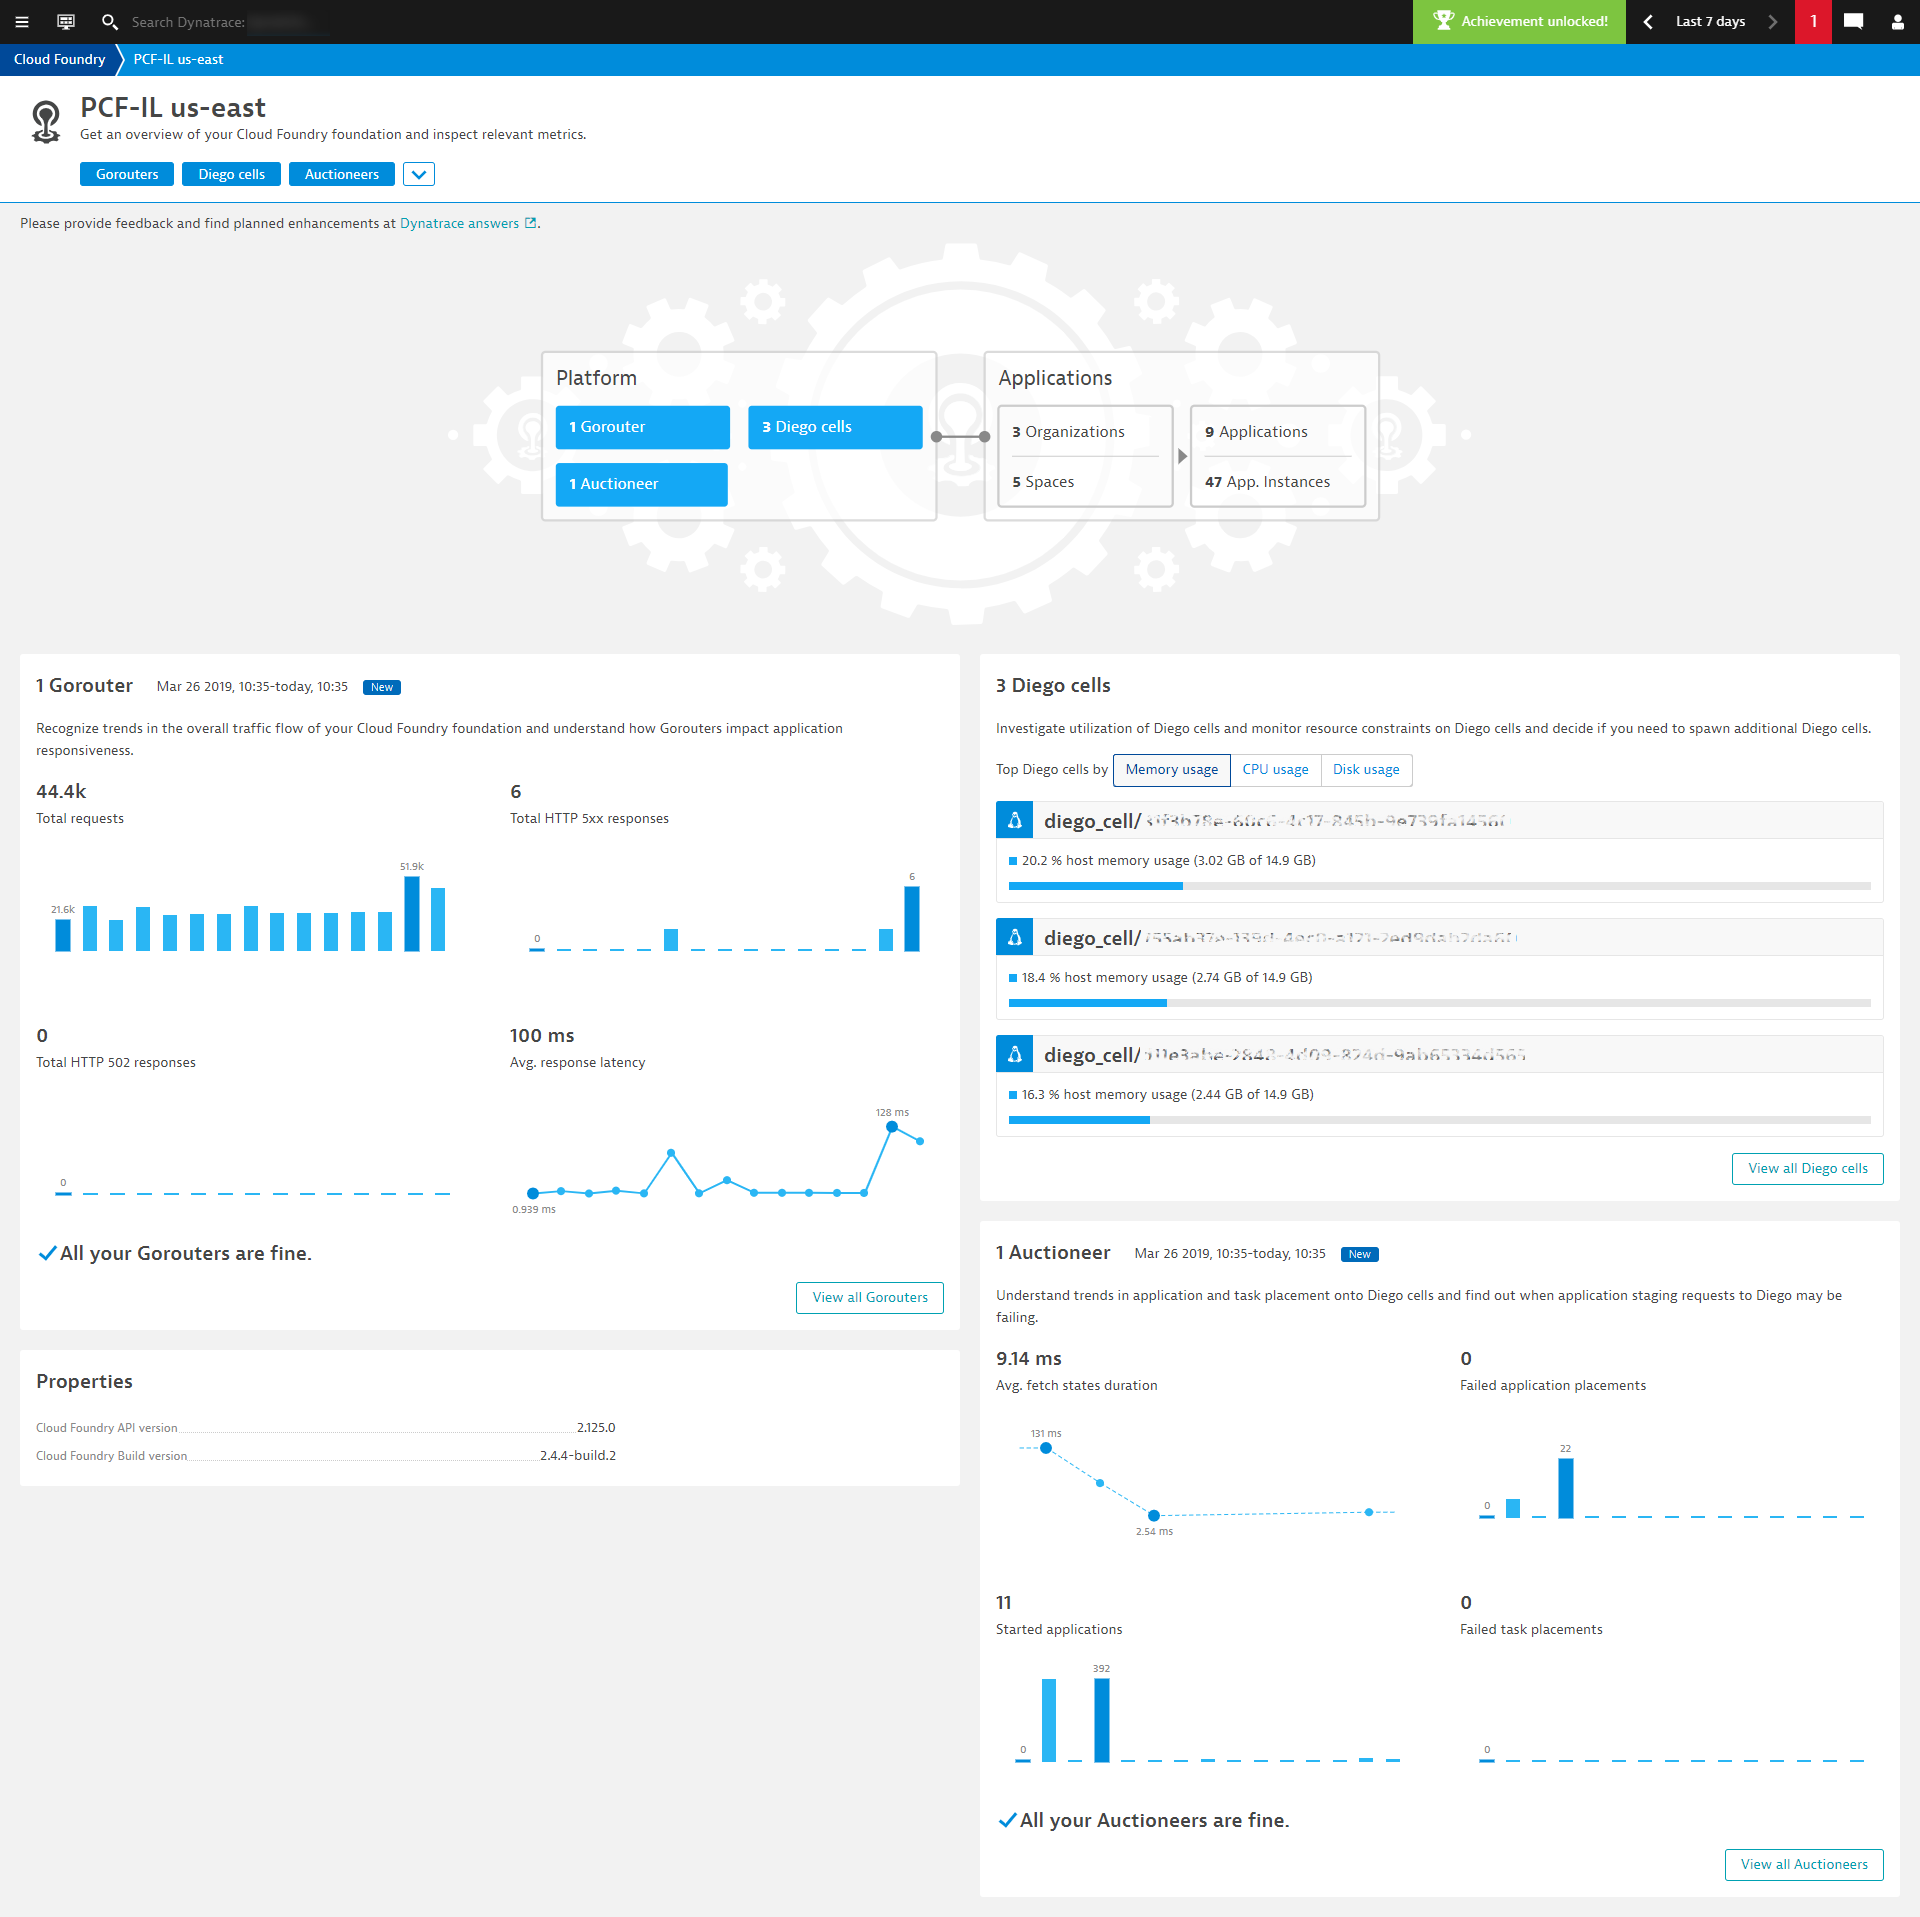
Built-in Cloud Foundry overview pages
Spawn additional Diego cells based on memory, CPU, and disk usage
The Cloud Foundry overview pages complement Cloud Foundry process- and host-level metrics collected by Dynatrace OneAgent with additional metadata and metrics pulled from the Cloud Foundry API—there’s no need to intercept the Firehose stream by deploying a nozzle. You’ll find all the details on how to start monitoring your Cloud Foundry foundation in this blog post and in Dynatrace Help.
Auctioneer metrics on Cloud Foundry overview pages
Understand how well Auctioneers are handling application and task placement on Diego cells
Cloud Foundry Auctioneers are crucial to achieving successful application and task placement onto Diego cells. Their overall health is crucial not only to platform operators but also to application owners—unhealthy Cloud Foundry components can have a negative impact on your applications (see example below). For details, read our blog post about why you should start monitoring your Cloud Foundry Auctioneers today.
What’s next
We always like to include you in the process of prioritizing upcoming features. We’ve listed all planned enhancements in a Dynatrace Community post; please share your feedback and ideas in the form of comments.
Save the date
We’ll be presenting at the Cloud Foundry 2019 summit in Philadelphia from April 2–4. Be sure to add Dynatrace’s Mike Villiger’s talks to your schedule, check out the hands-on lab by Dynatrace’s Johannes Bräuer and stop by the Dynatrace booth for a product demo.
Also, we presented the latest Dynatrace product enhancements focusing on the built-in Cloud Foundry overview pages as well as Gorouter and Auctioneer platform component metrics in the Dynatrace Performance Clinic series—check out the recordings Mastering Cloud Foundry with Dynatrace – Episode 1 and Mastering Cloud Foundry with Dynatrace – Episode 2.


Looking for answers?
Start a new discussion or ask for help in our Q&A forum.
Go to forum