
We’re proud to announce that Dynatrace has once again extended its support for Cloud Foundry monitoring. Dynatrace now detects Cloud Foundry Gorouter processes and provides Gorouter HTTP metrics. Gorouter HTTP metrics are relevant to both operators who manage Cloud Foundry environments and application owners who run applications on Cloud Foundry.
In response to recommendations provided by Pivotal, Dynatrace OneAgent now reports the following key performance indicators related to Gorouter processes:
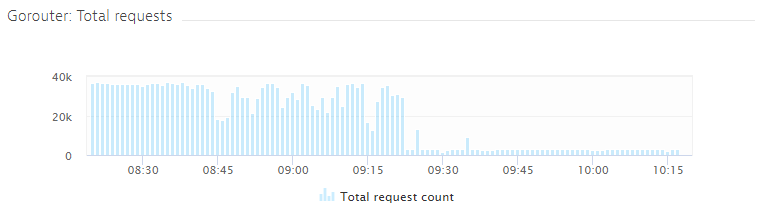
- Total requests
- Number of HTTP 5xx responses
- Number of HTTP 502 responses
- Response latency
With Dynatrace, there’s no need to intercept the Firehose stream that contains application logs and Cloud Foundry component metrics. You’re also not required to deploy an additional nozzle—all you need is a single OneAgent to collect all Gorouter metrics at the process level.
Use cases for DevOps staff
Understand overall traffic flows
The number of Total requests aggregated across all Gorouters provides insights into the overall traffic flow of a Cloud Foundry foundation. Operators can use this metric to better understand Gorouter throughput rates and decide when to scale Gorouter instances.
Understand how Gorouters impact application responsiveness
Gorouter Response latency represents the average round-trip response time to a Cloud Foundry application (including router handling). The Response latency metric indicates how Gorouter processes impact your overall application responsiveness.
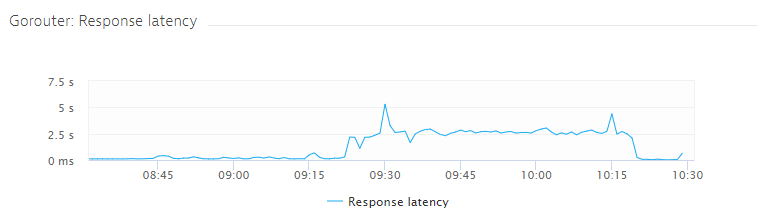
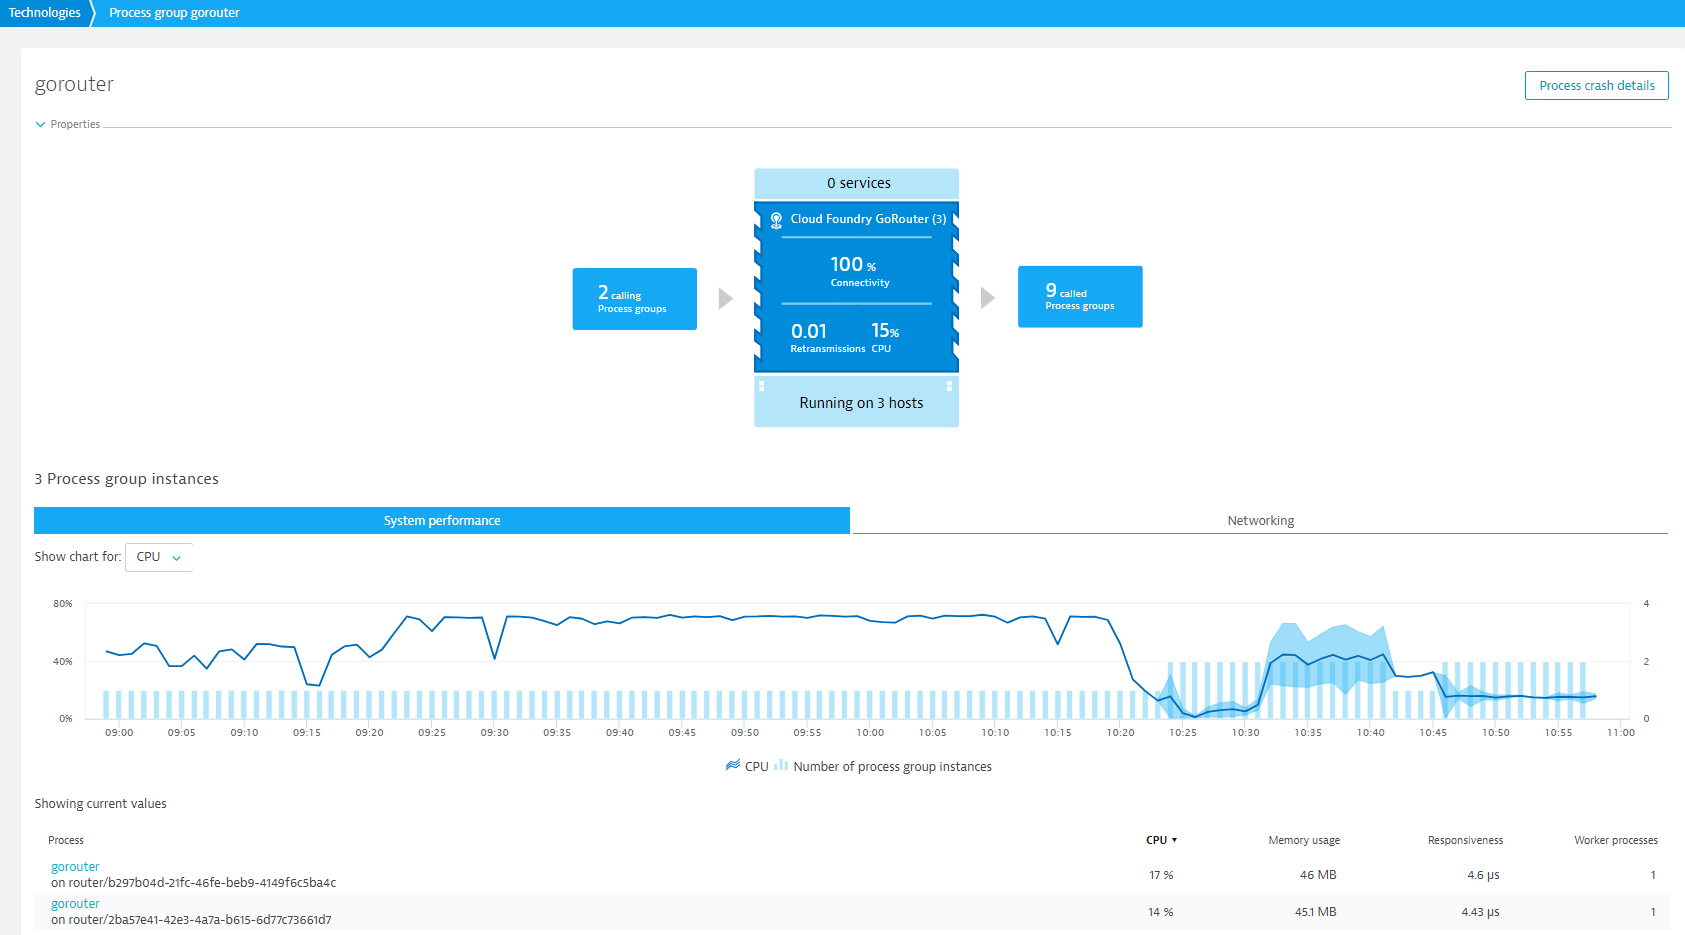
As you can see in the examples above, this Gorouter experienced high load (nearly 40k total requests and response rates around 5 sec). You can see this high load on the Gorouter VM level as well in the example below. Dynatrace has detected a CPU saturation problem.
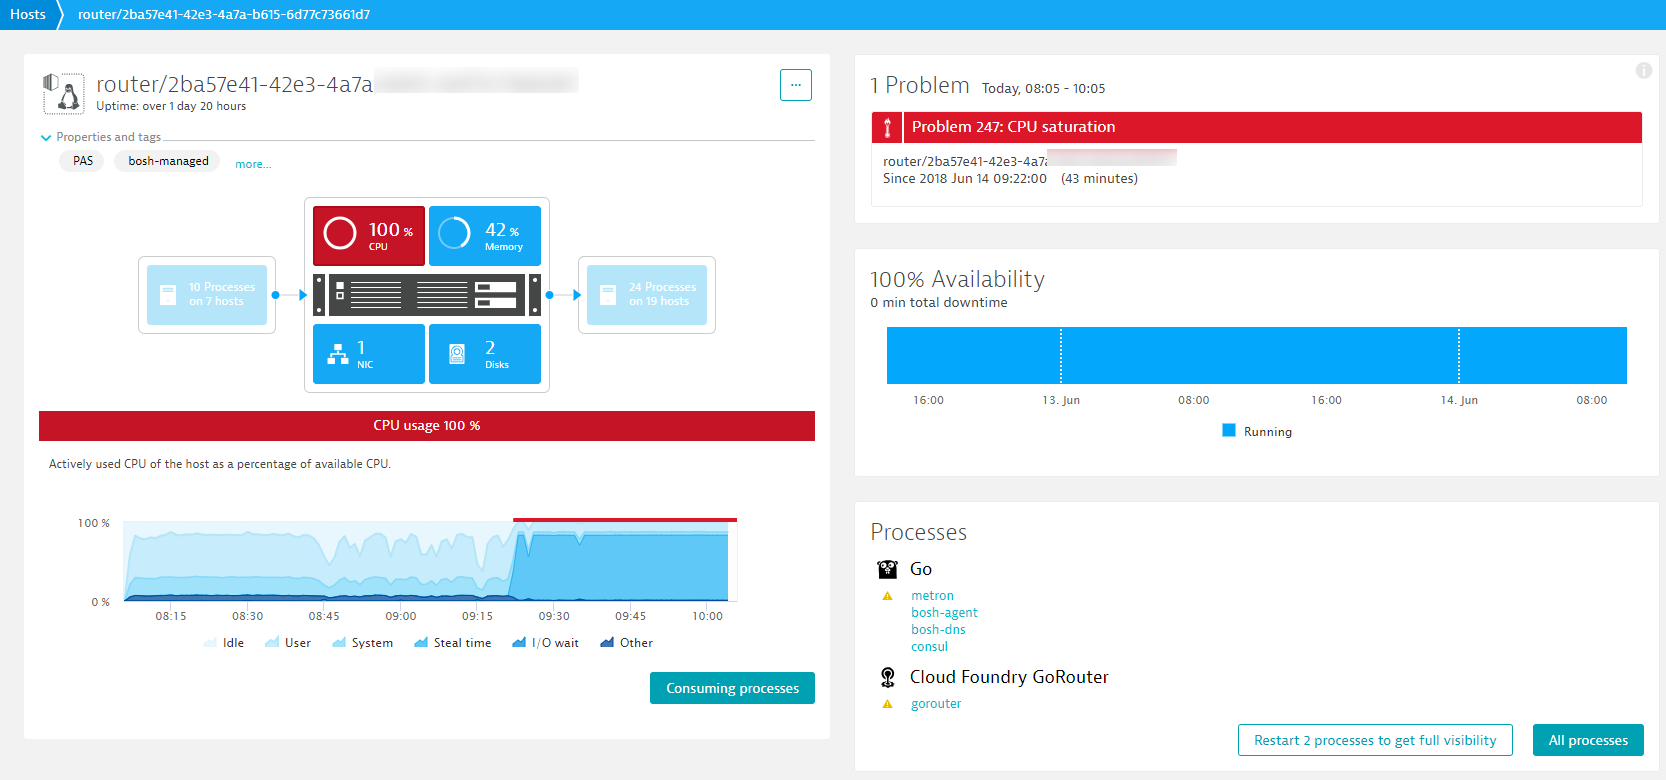
To solve these performance issues, we scaled the Gorouter and added a second Gorouter instance to the Cloud Foundry environment. Following these changes, CPU usage has returned to an acceptable level.
Use cases for application developers
Before diving into the newly available Gorouter use cases that are relevant to application developers, let’s take a look at our example application. We’ve used TicketMonster from developers.redhat.com for our purposes here.
Note: This monolithic application has been broken up into microservices by my Dynatrace colleagues Johannes Bräuer and Jürgen Etzlstorfer. If you’re interested in learning about their discoveries during this work, be sure to check out their blog series, Fearless Monolith to Microservices Migration.
Identify invalid service responses
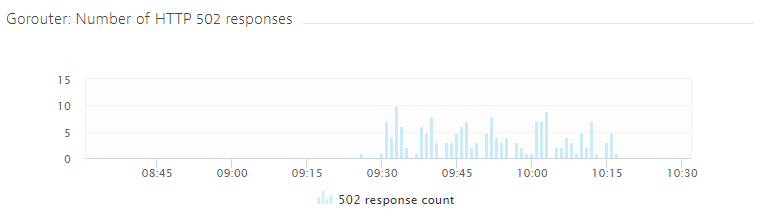
An increased number of HTTP 502 responses is an indicator of invalid service responses produced by an application.
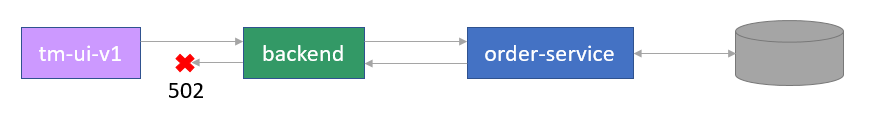
To generate 502 responses in our example application, we manipulated the response to the request on /rest/bookings (provided by the order-service). The target of the response of the backend service was intentionally set incorrectly so as to produce 502 bad gateway errors.
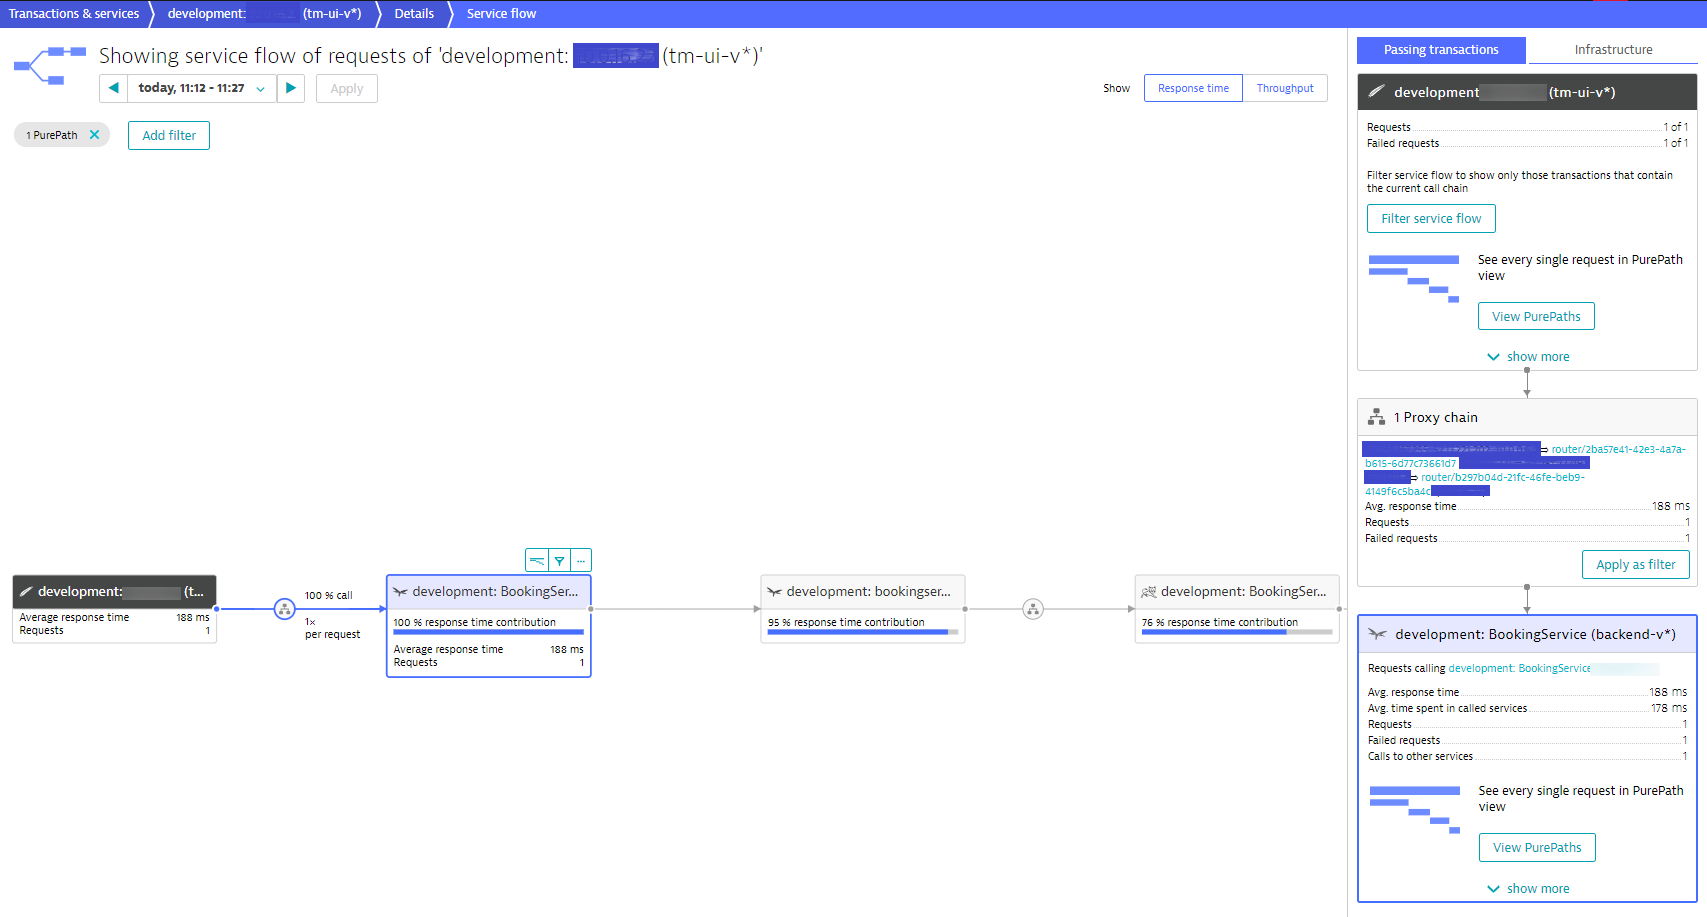
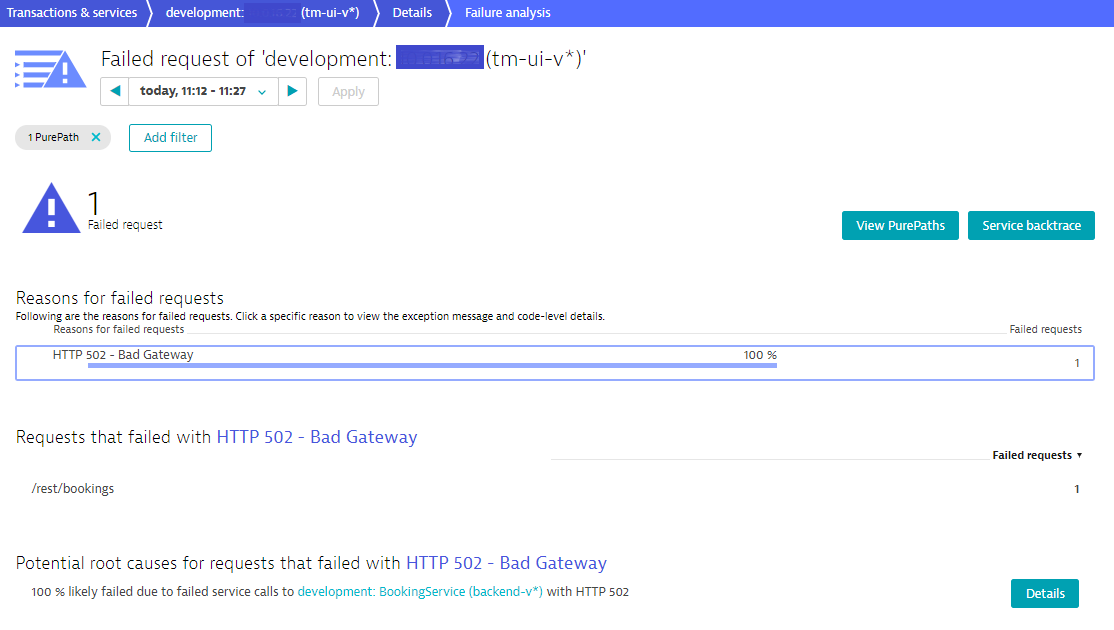
In addition to these 502 responses being reflected in Gorouter metrics, they are also reflected in Dynatrace Service flow (see below).
Detect repeatedly crashing apps (before your customers do)
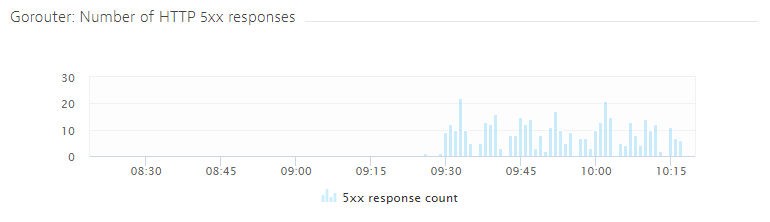
An increasing number of 5xx responses is often the result of repeatedly crashing apps or response issues from applications. Such router errors often originate from out-of-memory errors and other application-level problems.
To produce 5xx responses in our example application, we reduced the memory allocated to the TicketMonster application to 512 MB. Then several requests were made, which resulted in an out-of-memory application crash. Although Cloud Foundry addressed this issue by immediately restarting the application, you can still see in the chart below that the app crash increased the number of 5xx responses on the Gorouter.
Get started
To benefit from the new HTTP metrics for Gorouters, all you have to do is enable Cloud Foundry full-stack monitoring for your Cloud Foundry environment and thereby deploy Dynatrace OneAgent to your Cloud Foundry VMs. For complete installation details, see Dynatrace Cloud Foundry full-stack monitoring guidelines.
Please note: You must enable Go monitoring to benefit from Gorouter HTTP metrics. To do this, go to Settings > Monitoring > Monitored Technologies and set the Go switch to the On position. With Go monitoring support activated you will also notice that HTTP metrics (total requests, number of HTTP 5xx responses, number of HTTP 502 responses, and response latency) are available for Go processes in general.
Credits
I’d like to thank our stellar Dynatrace Go team for extending technology support towards Cloud Foundry platform metrics. Especially, I’d like to acknowledge the work done by Peter Feichtinger and Michael Obermueller in enabling OneAgent to collect Cloud Foundry metrics at the agent level. Kudos!
What’s next?
There are many great new capabilities ahead for Cloud Foundry full-stack monitoring with Dynatrace. Dynatrace will soon detect additional BOSH instance metadata (for example, availability zone and the deployment name of your Cloud Foundry foundation). So stay tuned!
In the meantime, let us know what you think about HTTP metrics for your Cloud Foundry Gorouter processes. Please share your feedback with us at Dynatrace Community.


Looking for answers?
Start a new discussion or ask for help in our Q&A forum.
Go to forum