Most monitoring solutions rely on thresholds or baselines to identify the root cause of detected issues.
Within highly dynamic software service architectures, such as microservices and serverless functions, it’s impossible to use any manual approach. Yet, even modern strategies for monitoring such environments (for example, auto-baselining) still require unnecessary manual configuration.
Even the best baseline approach comes with a tiny percentage of false positive alerts—the number of false positive alerts is directly proportional to the number of components you’re monitoring.
Let’s assume that a OneAgent running on a single host collects about 500 different metrics on average (such as CPU, memory, network, process, and service metrics) depending on the underlying technologies. If a baseline results in only 0.1% false positive alerts per metric per year, the host will trigger 50 false positive alerts every year. If you multiply this by 10,000 hosts, you end up with 500,000 false positive alerts per year!
This clearly shows that baselines and thresholds aren’t the best solutions for identifying root causes within web-scale clouds.
Automated root-cause analysis without thresholds or baselines
Dynatrace is the first software intelligence platform to introduce an AI causation engine that fully automates the detection of anomalies—and, more importantly, the identification of root causes.
During the past four years, the Dynatrace AI has proven that a fully automated analysis of problems is the only valid approach, especially in highly dynamic microservices environments where manual root-cause analysis can be nearly impossible.
With the current release of Dynatrace, you can opt into our all-new and improved next-generation AI root-cause analysis.
Instead of relying on events and thresholds, suspicious metric behavior is detected by analyzing the value distribution of metrics. If the current metric measurement distribution deviates significantly from the observed historic metric behavior, the respective component is marked as unhealthy, even if no threshold has been reached.
The automatic root-cause analysis has proven to be superior to any form of manual analysis of huge dynamic service landscapes.
Smarter, more precise root-cause findings
Dynatrace next-generation root-cause analysis further improves the visualization of individual findings, such as changes within the availability of underlying infrastructure.
- The new root-cause analysis reaches a new level of precision and provides the ability to ingest customer-defined metrics and events, or metrics from third-party integrations, allowing you to further automate your IT management.
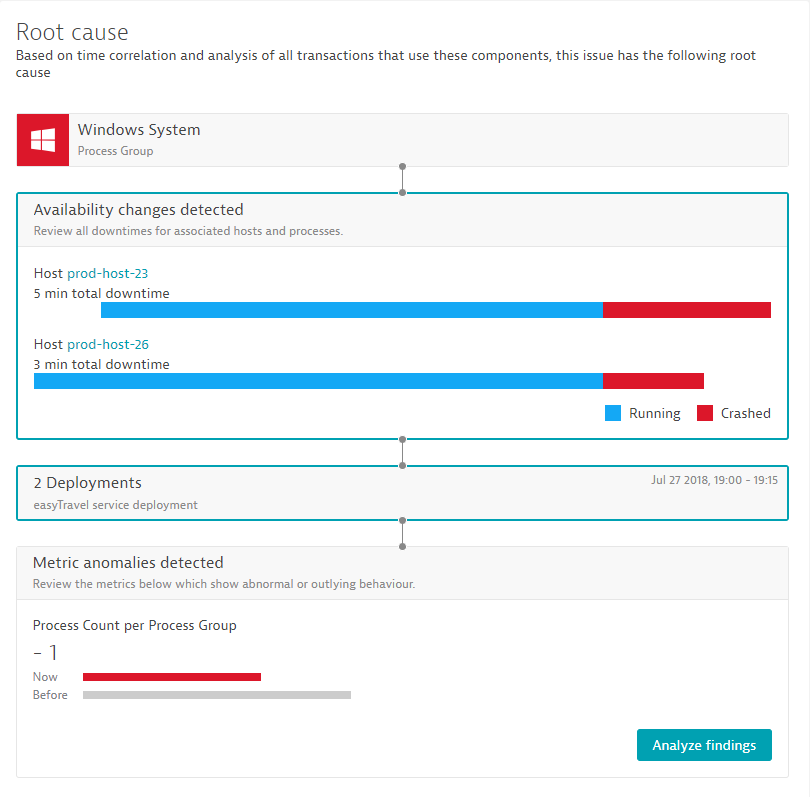
- It enables you to quickly check the availability state of all the relevant components of a service in the context of problems. Within the problem root-cause section, you get all relevant downtimes of the relevant infrastructure components, out of the box.
- The new AI also detects root causes without triggering false-positive alerts.
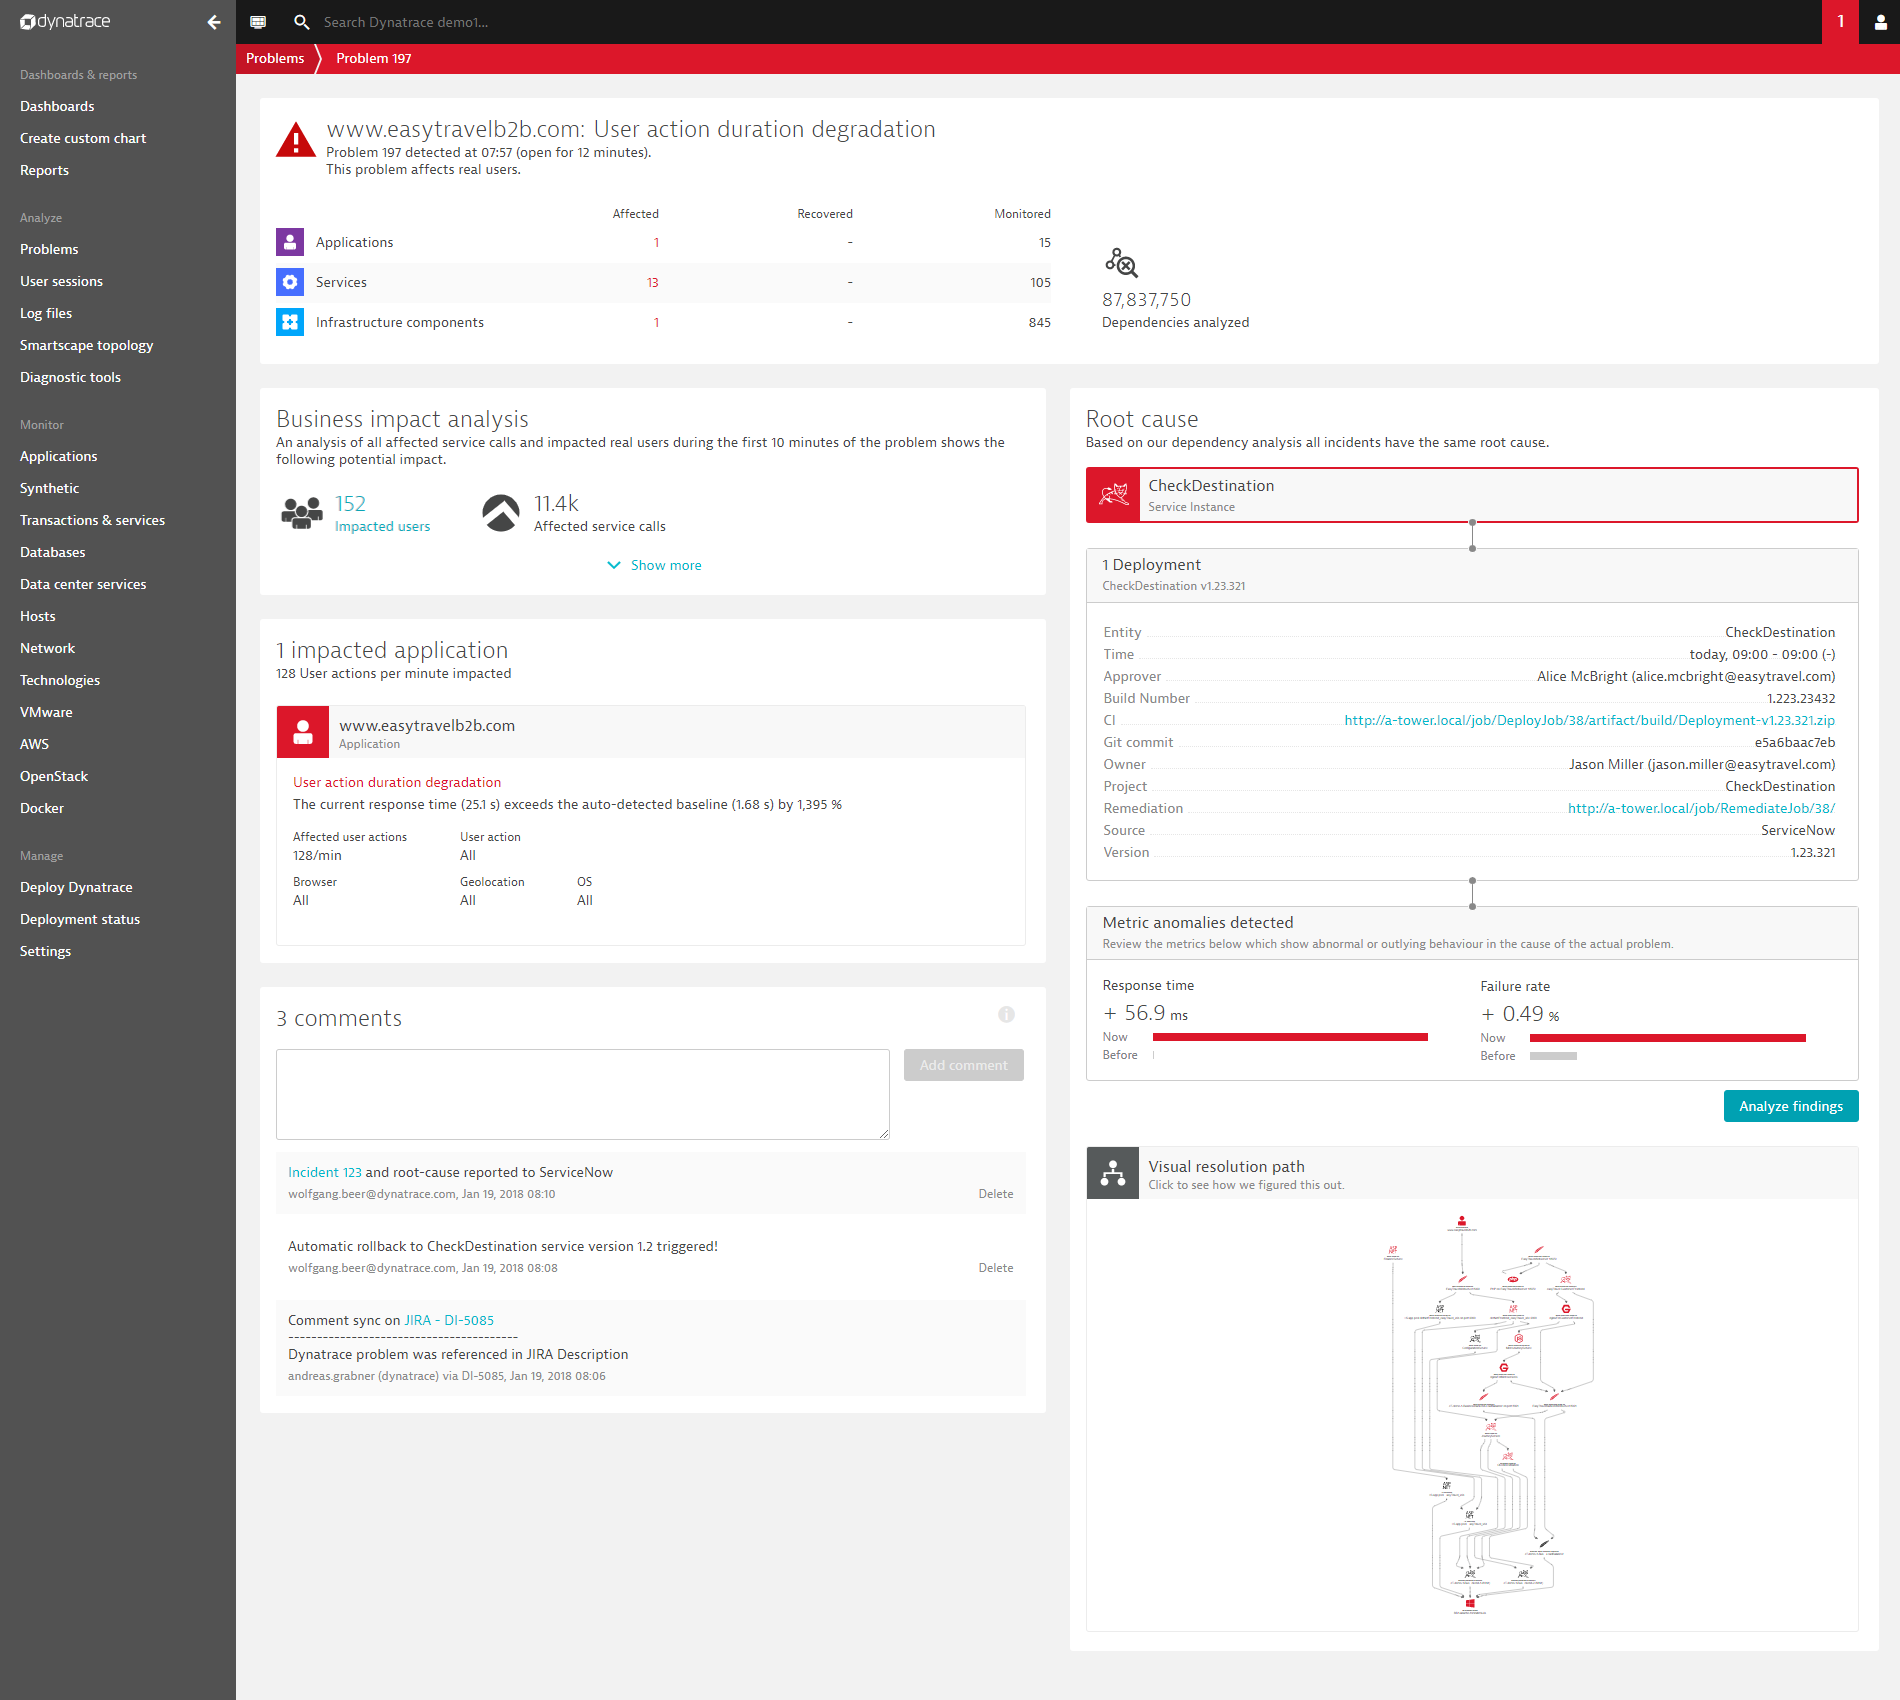
See the following example of fully automated AI-powered root-cause analysis. This example precisely pinpoints a third-party deployment event that was sent through the REST event API.
Here is an example of the newly introduced availability root-cause section:
To enable the next generation AI engine on a per-environment basis:
- Click Problems in the navigation menu.
- Within the banner at the top of the page, click the Switch to next generation AI engine button.

How next-generation root-cause analysis works
As of today, Dynatrace OneAgent collects more than 1,000 different types of metrics for each monitored component, in addition to many metrics from cloud integrations. The health state of each monitored component is derived from these metrics by either comparing the baseline to the current value or by verifying against a defined threshold.
The next-generation root-cause engine introduces a completely different approach that is no longer dependent on a baseline or a threshold to detect root causes in complex situations.
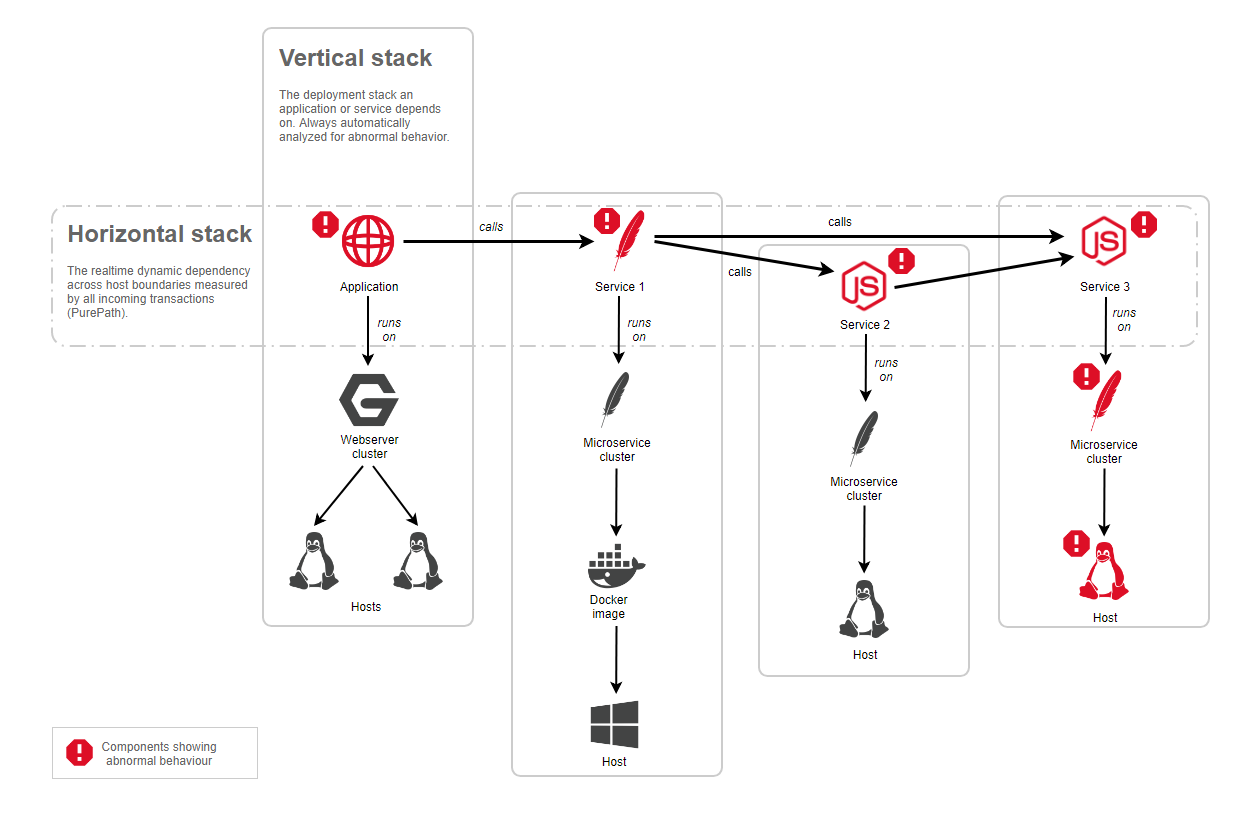
Whenever an event is triggered on a component, the AI root-cause analysis automatically collects all the live transactions (PurePaths) along the horizontal stack. The analysis automatically proceeds with the analysis if the horizontal stack shows that a called service is also marked as unhealthy, as shown in the diagram below. With each hop along the horizontal stack, the vertical technology stack is also analyzed for unhealthy states.
To tackle the challenge of the exploding number of metrics, the next-generation root-cause analysis automatically checks all the available metrics on all the affected components. Suspicious metric behavior is detected by analyzing the metric value distribution from the past and comparing it with the actual metric values. Therefore, the new analysis no longer depends on events and thresholds. Though, if an event or user-defined custom threshold is present, it’s included in the root-cause analysis process.
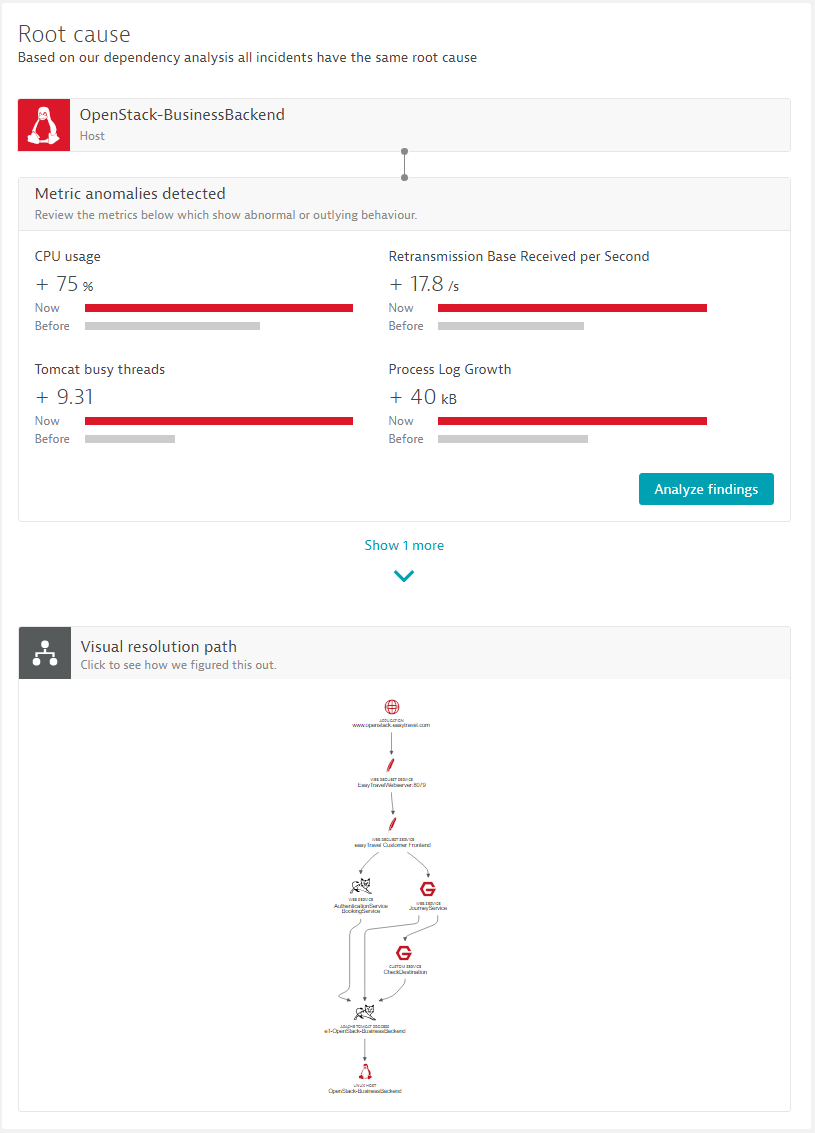
The example below shows how the new AI detects root causes without triggering false-positive alerts. The root-cause analysis states that the unhealthy host shows a 75% CPU usage increase as well as an increased number of Tomcat busy threads.
Summary
With Dynatrace next-generation root-cause analysis, we’ve further improved the strengths of our unique, fully automatic root-cause detection.
Business impact analysis and PurePath-based analysis of abnormal situations remain unchanged, while improvements such as metric anomaly detection, custom events, and custom metrics have been seamlessly integrated.
These improvements have once again pushed the boundaries of automatic, AI-based root-cause analysis, which you can leverage right now.
For more detail on these new capabilities, see Dynatrace Help.





Looking for answers?
Start a new discussion or ask for help in our Q&A forum.
Go to forum