
When Dynatrace started reinventing cloud-native service tracing and observability ten years ago, it was already clear that human operators were overwhelmed with traditional monitoring systems' massive raw data inflow. Besides being unable to watch that amount of telemetry data on dashboards, classic operations teams were also blown away by the sheer number of alerts they received 24/7 from hundreds of different monitoring tools.
Dynatrace Intelligence is the evolution of Davis AI®, improving how users interact with and understand observability data.
With the introduction of Davis® root-cause detection, Dynatrace reduced the amount of single-alert spam that arises when large-scale incidences occur. Instead of immediately firing off an alert for all raw events, the Davis root-cause engine follows each violating service’s causal relationships. By automatically following the causal direction of the topology between services and their underlying infrastructure, Davis collects all raw events that belong to the same root cause and then notifies you by raising a problem.
With interactive problem mode, Dynatrace introduces a new, powerful troubleshooting assistant. This blog post explains how Davis can help reduce your MTTR (mean time to resolve) using interactive user guidance that retains context when drilling deeper into problem analysis.
Faster remediation through precise root cause analysis
Once Davis identifies a problem, a Problem overview page is created, which shows a comprehensive management summary of what happened (impact) and the root cause of the problem. DevOps teams use this page to quickly identify and remediate unexpected incidences.
Usually, the journey doesn’t stop here. When the DevOps team has finished their work, software experts must investigate the underlying software stack. They need to analyze all relevant information that Davis found along the deployment stack to avoid such problems in the future. When navigating to the underlying service—identified as the root cause—the problem detail page opens with retained problem context, which includes:
- Date and time of the current problem, so you don’t need to manually adapt the date and time on each page in the analysis journey.
- A side panel that interactively informs you about all problem-related information for the relevant service.
- Davis highlights all relevant problem information on each page you navigate to.
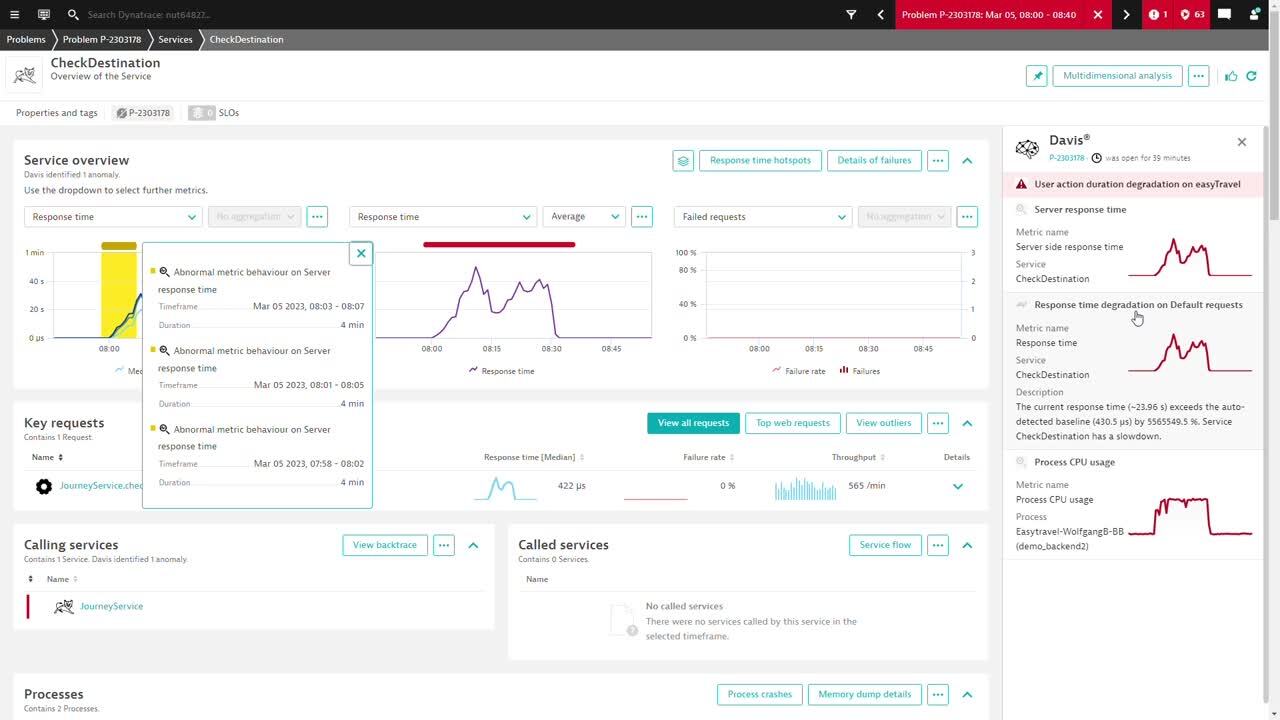
The screenshot below shows how Davis interactively guides you by highlighting all the relevant information with red and yellow markers (on the left side) while showing a list of AI root-cause findings in the side panel on the right (if the Davis side panel is closed, an icon is displayed on the right-hand panel so you can re-open it).
Davis highlighting detected problems in side panel
Optimize your software stack using Davis interactive problem mode
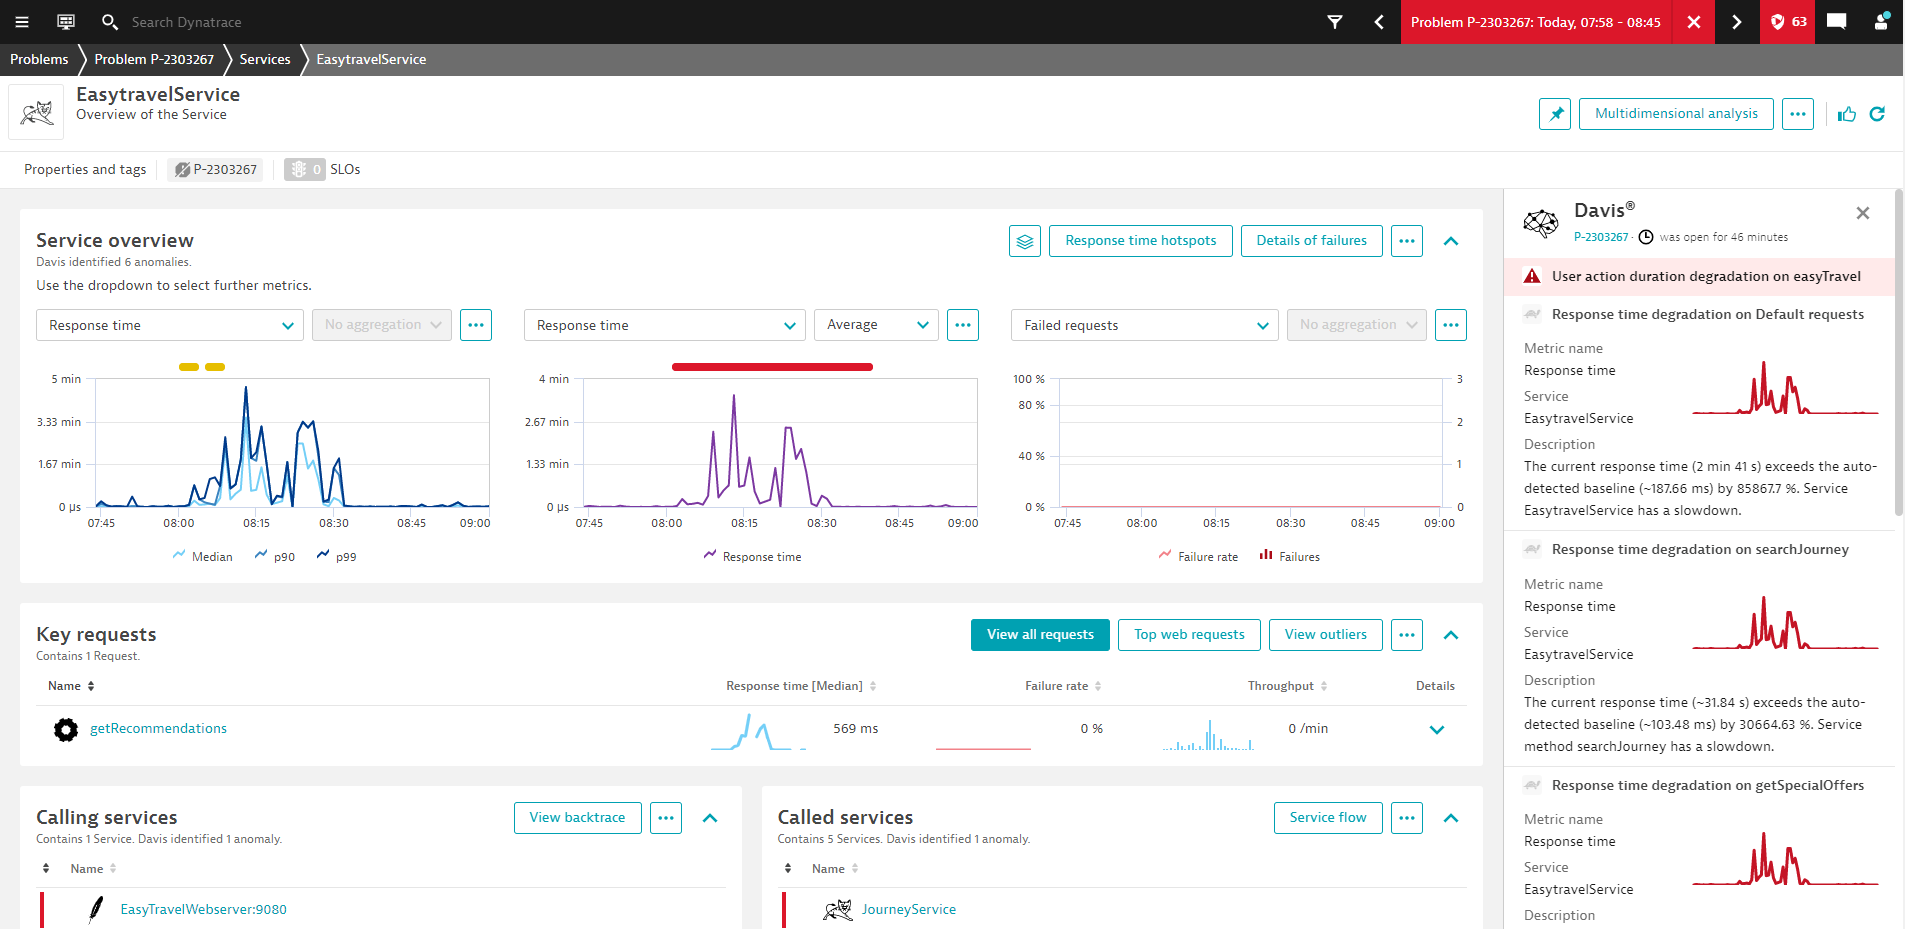
Watch out for red and yellow markers in the navigation section headers—these indicate that Davis has found information related to the problem.
The red marker highlights events and their duration, whereas the yellow marker indicates metric anomalies where suspicious metric change points were found during the problem analysis. The yellow metric change points highlight a point in time, while the red markers represent event durations.
If you select one of the markers (either directly or via the side panel), you can view additional information, such as the timeframe and duration.
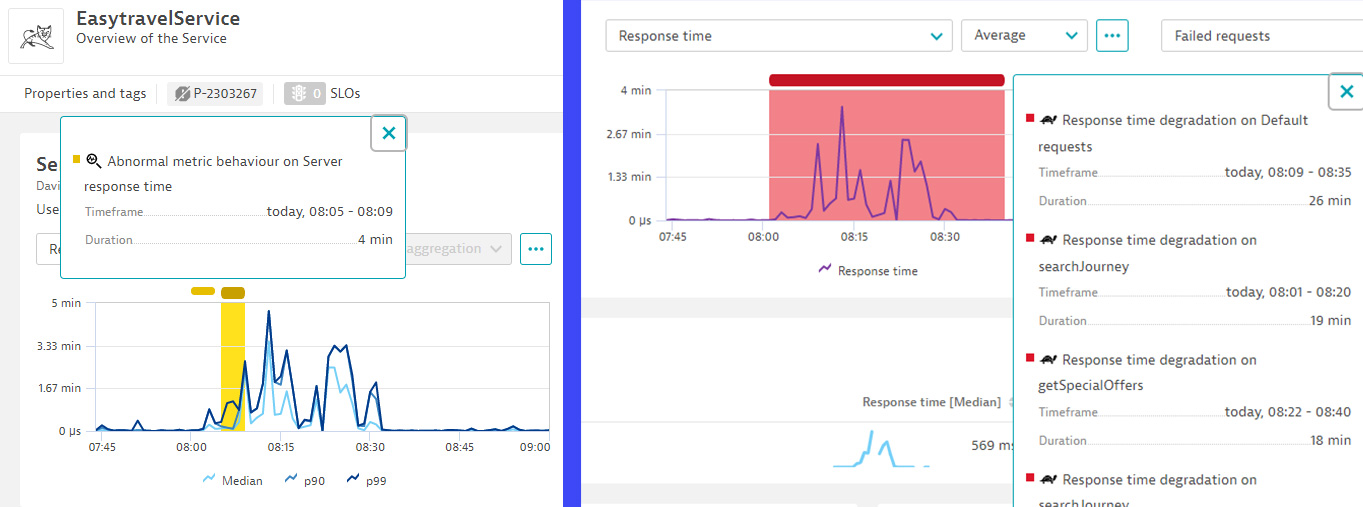
Davis AI change point (in yellow on the left) and event duration (in red on the right) markers
Meeting SLO requirements
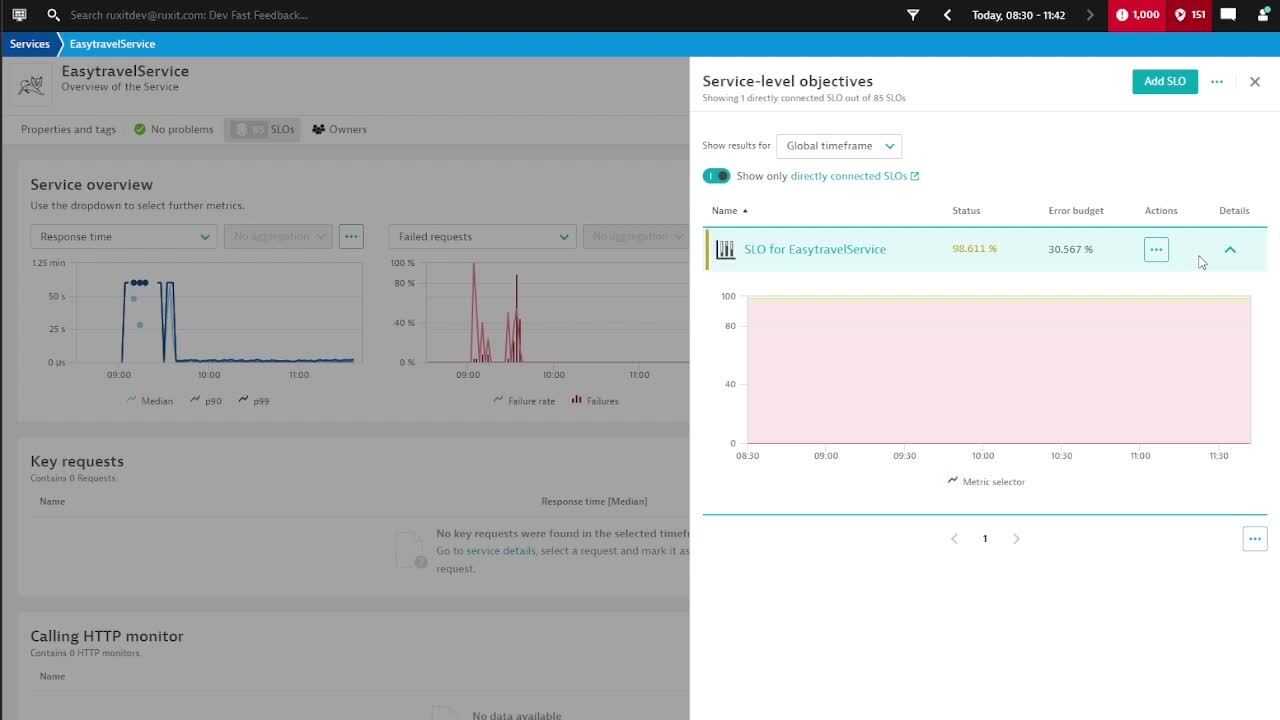
In addition to providing context to detected problems, Davis also supports you when spikes are detected in connected SLOs (Service Level Objectives). Via the dedicated SLO button in the top bar, service-level objectives relating to the selected service can be reviewed immediately without losing context.
Spikes can easily be investigated by selecting a timeframe and clicking Analyze. Davis instantly collects all connected signals and provides relevant, contextual information. Watch the following video for examples of how the interactive problem mode helps identify SLO-relevant issues.
Summary
Davis problem detection and root cause analysis is essential for modern AIOps (Artificial Intelligence for IT Operations) and DevOps to minimize the MTTR. Real-time insights are crucial for quickly triaging unexpected incidents and remediating them in a timely manner.
Davis interactive problem mode guides you through all the detailed problem-related information and marks problems visually to make them easier to understand. It also seamlessly integrates user-defined SLOs, including leveraging Davis AI for analyzing SLO degradations, which saves precious time during critical incidents. You no longer need to leave the context of your page when using the side panel for navigational help to dig through all relevant findings and SLOs discovered during root cause analysis.
We’re, of course, highly interested in your feedback! We encourage you to try the interactive problem mode and share your feedback and product ideas via the Dynatrace Community. Every message we receive helps us to continuously improve the Dynatrace platform.


Looking for answers?
Start a new discussion or ask for help in our Q&A forum.
Go to forum