
Building upon our recent work in exposing mobile and custom application metrics via the Dynatrace REST API, you can now include these same metrics in your custom charts and pin them to your dashboards.
To try out the new metrics, click Create custom chart in the Dynatrace navigation menu and select one of the new timeseries from the Add metric drop list (see the example below). Metrics for custom applications begin with the string Custom application while mobile app metrics begin with the string Mobile app.
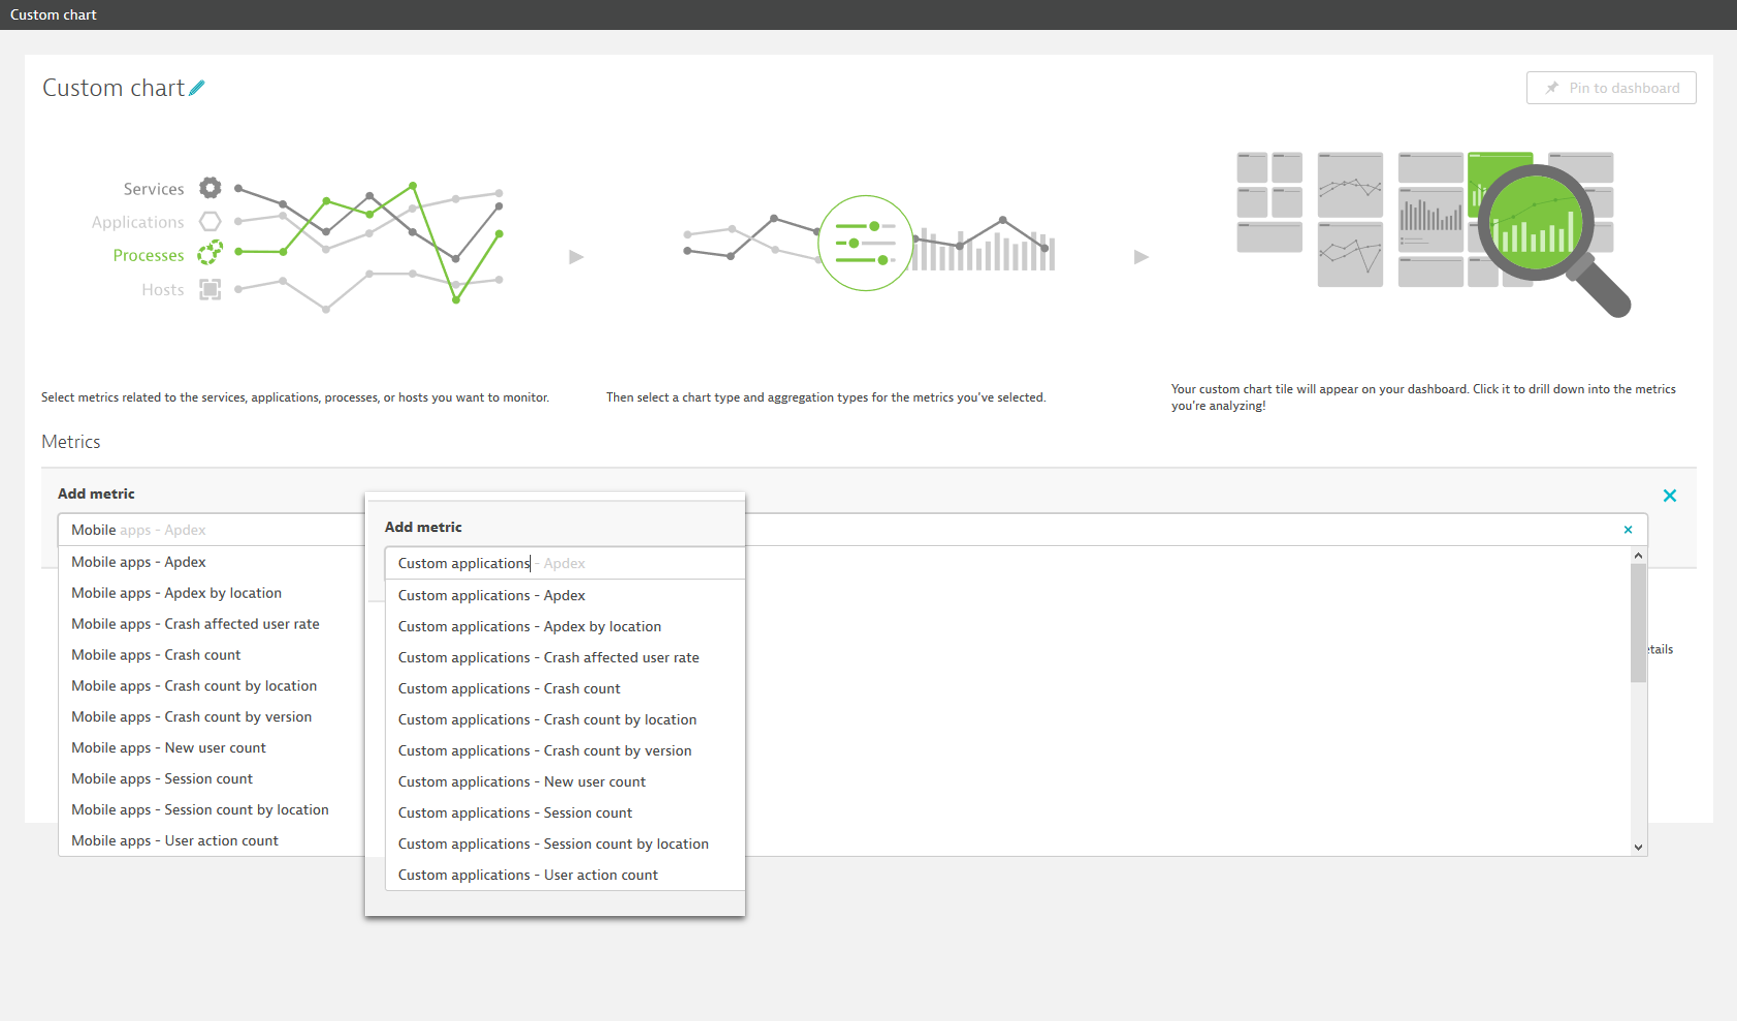
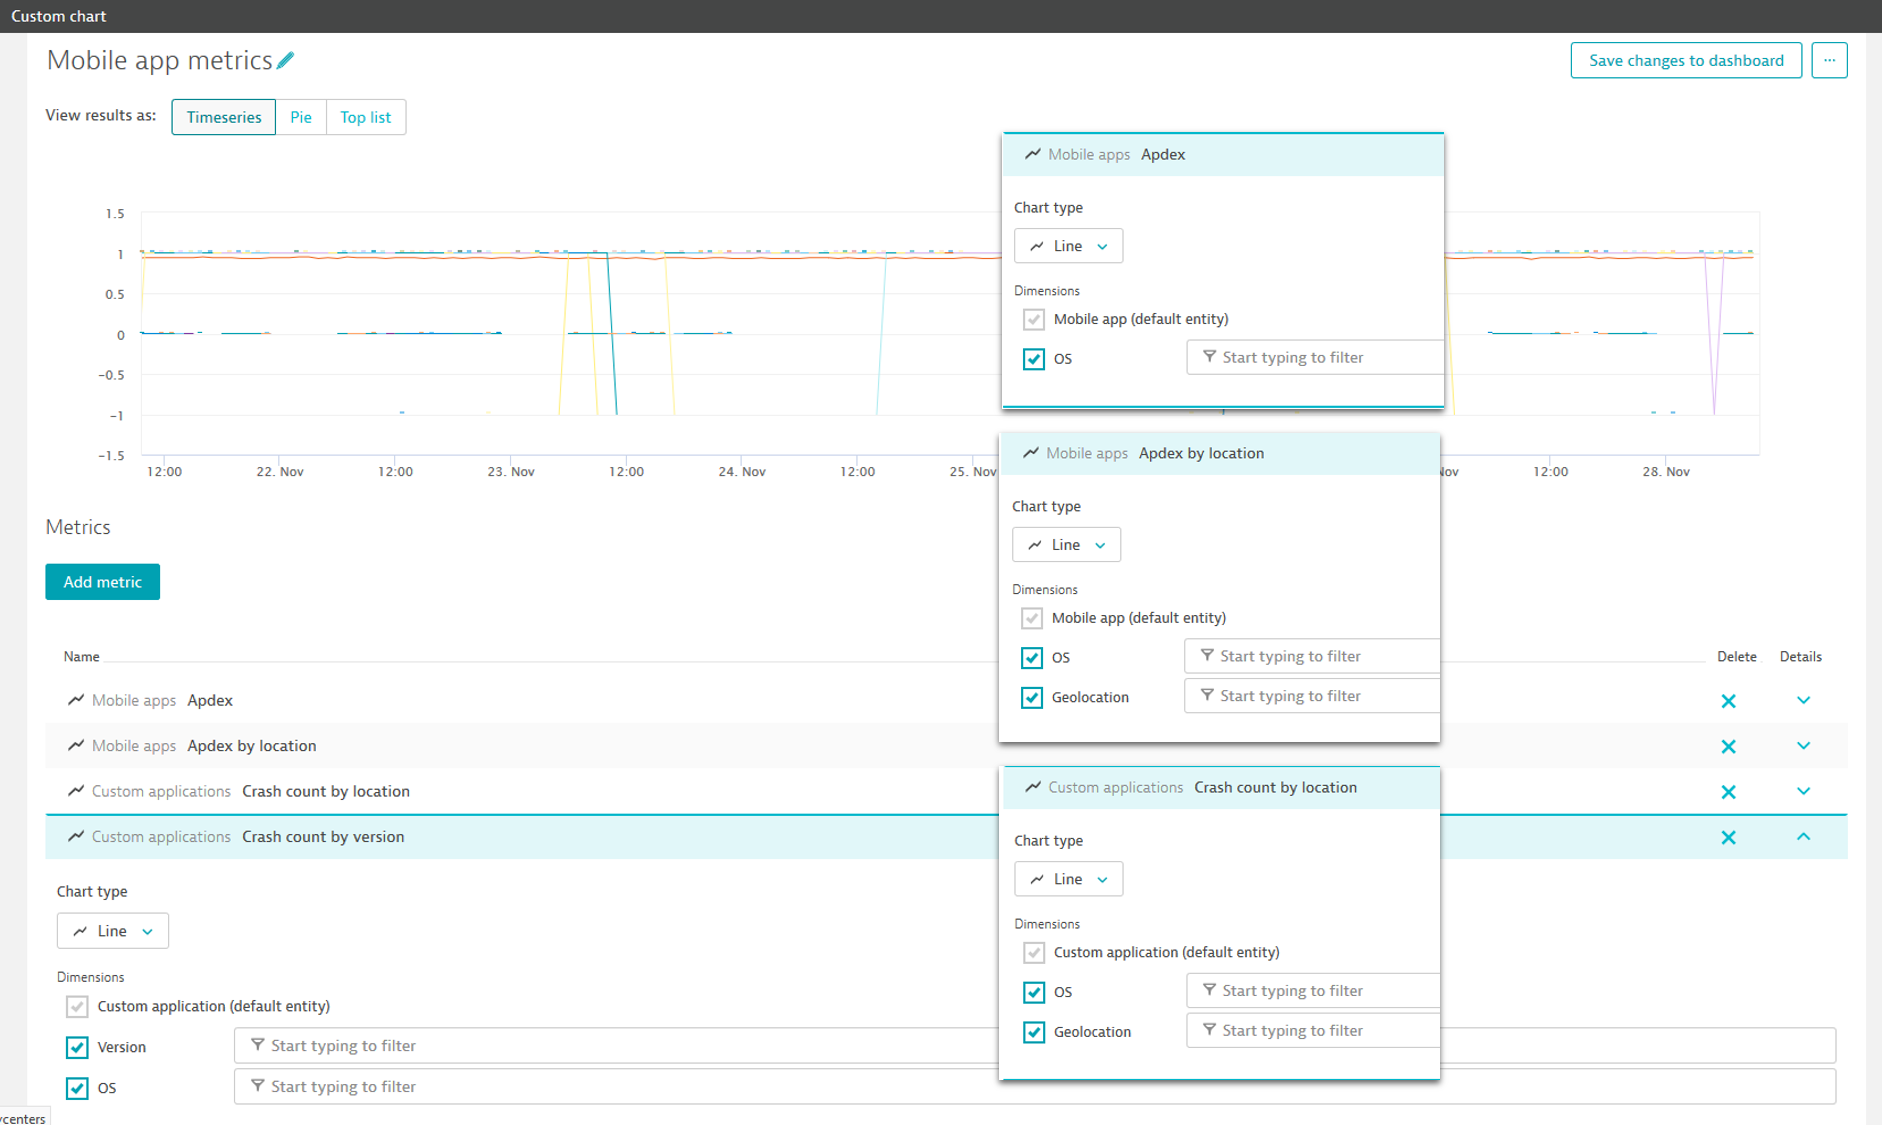
All metrics can be filtered based on operating system (OS). Some metrics offer additional dimensions for filtering like app version and geolocation. This enables you to build exactly the dashboards you need to support your daily work. See the example metrics below and how they look when used in custom dashboard charts (see the second image below).


Looking for answers?
Start a new discussion or ask for help in our Q&A forum.
Go to forum