You can now fetch timeseries metric data for your mobile apps and custom applications with the Dynatrace Timeseries REST API. The easiest way to try out this new feature is with our recently introduced API Explorer.
Setup for timeseries fetch
To authorize API access using the Dynatrace API Explorer:
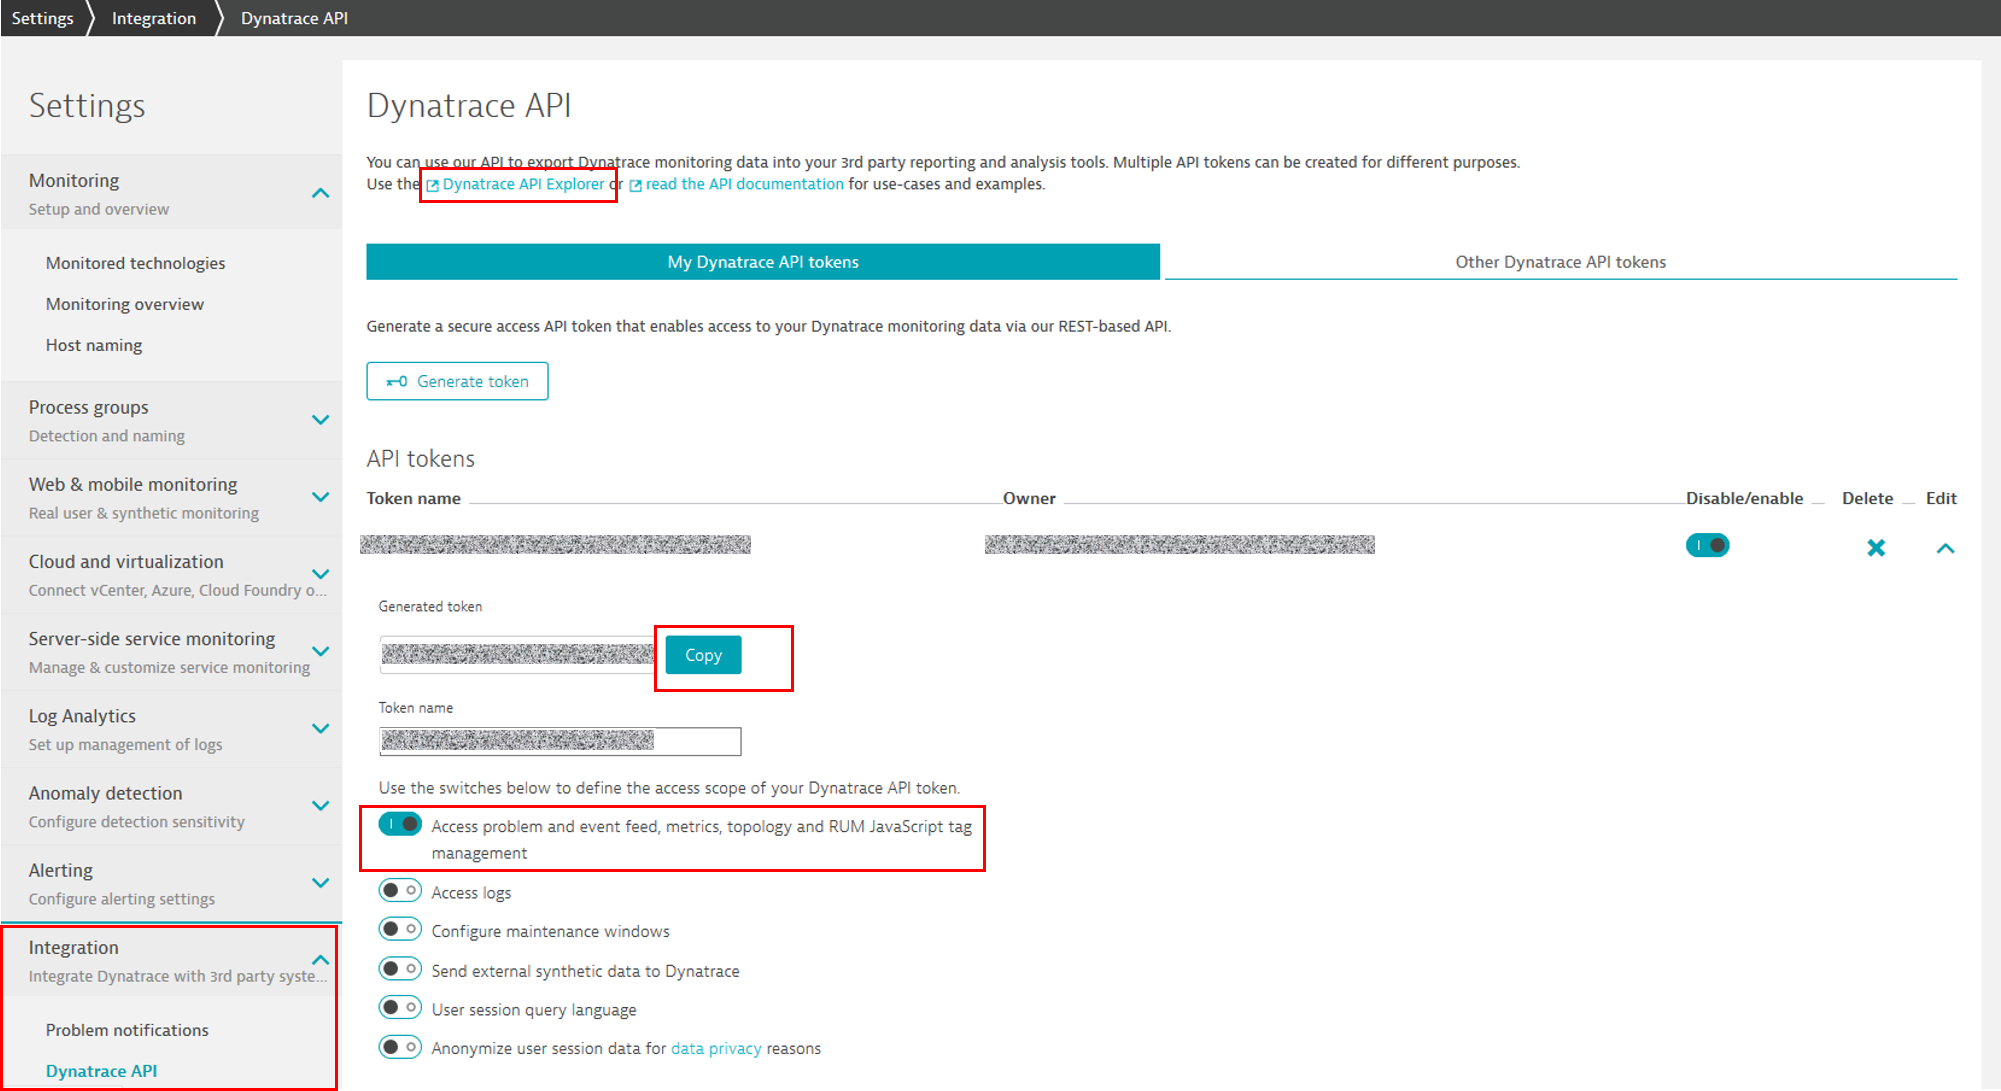
Generate an API token for authentication. From the navigation menu, go to Settings > Integration > Dynatrace API. You’ll see a list of existing API tokens here.
Click Copy or generate a new token that has the permission for accessing metric data.
Click the Dynatrace API Explorer link in the description at the top of the page to open the API Explorer in a new browser window.
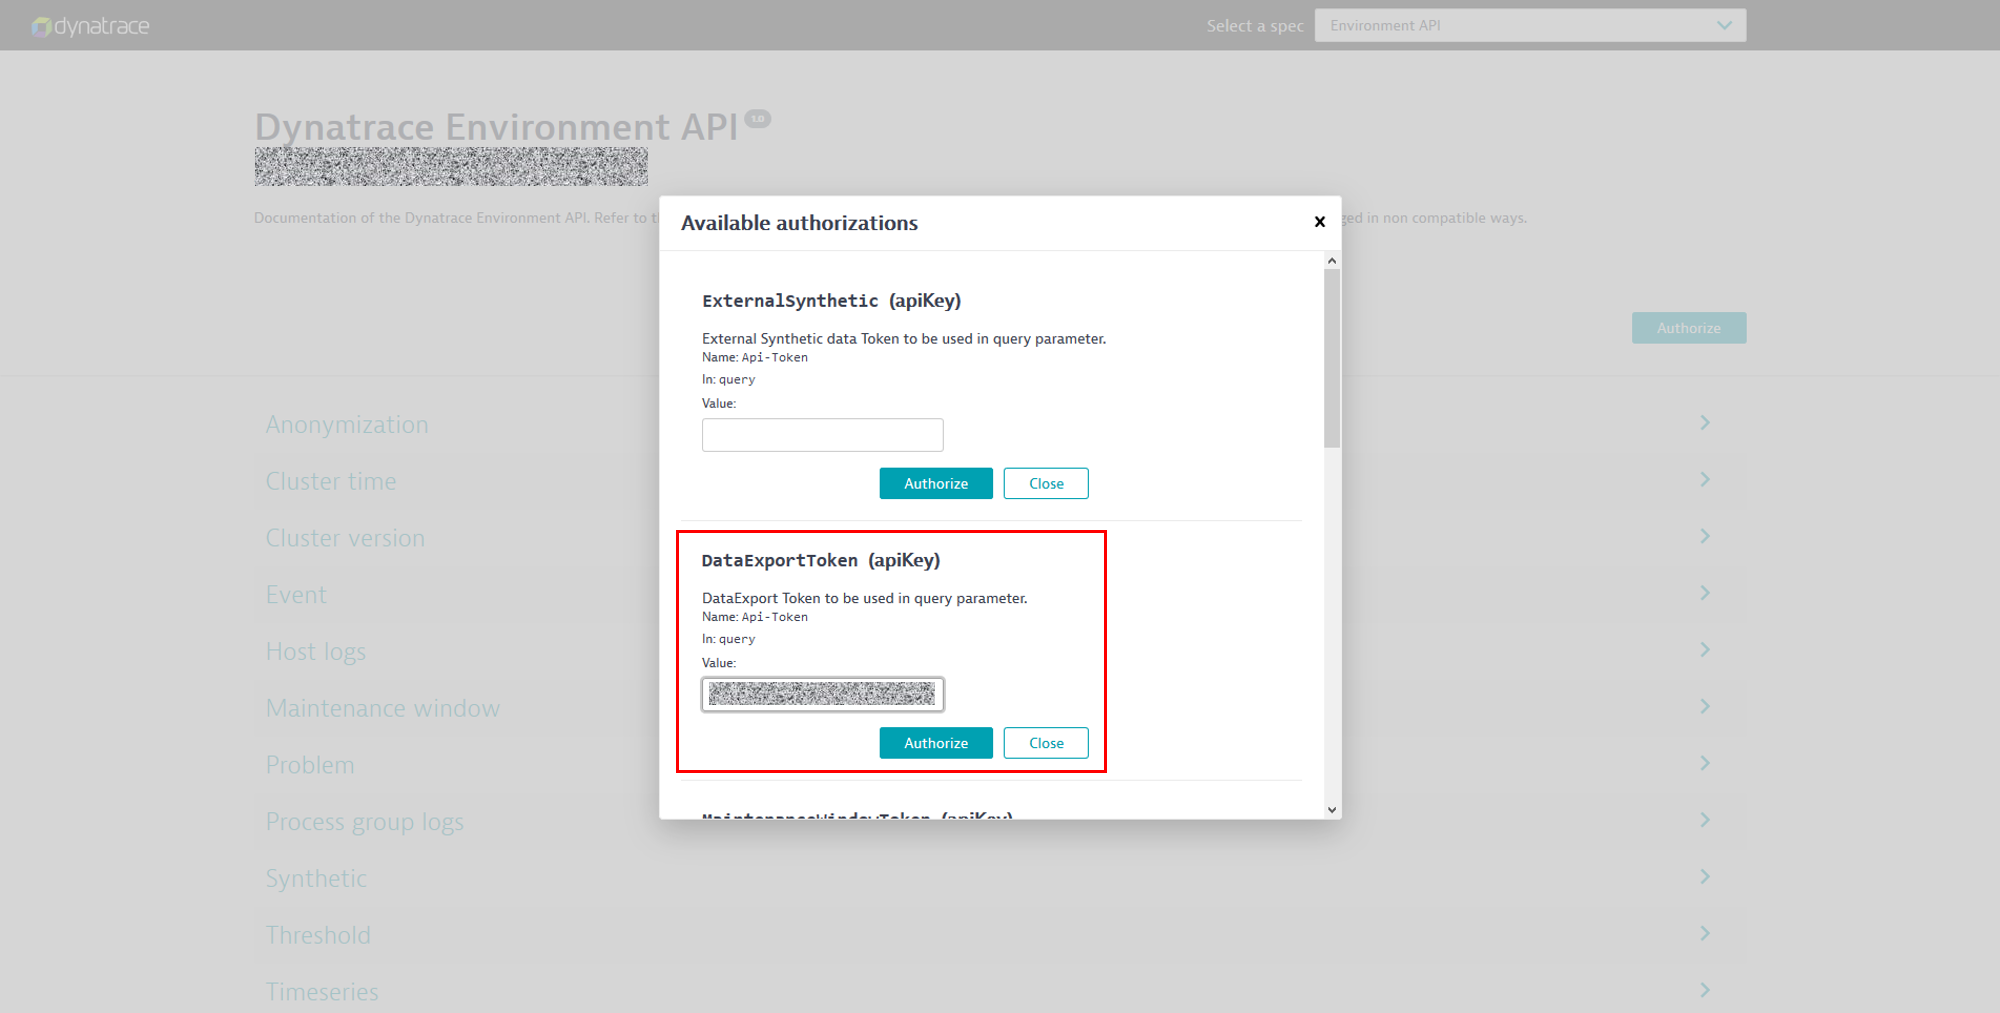
Within the API Explorer, click the Authorize button in the upper-right corner.
In the dialog that appears, paste the DataExportToken (API key) you copied to your clipboard.
Click Authorize and then Close the dialog.
You’re now ready to try out timeseries data fetch using the Timeseries API.
Fetch timeseries metric data
To fetch timeseries data:
In the API Explorer, go to the Timeseries API section and select the GET/timeseries request at the bottom. The response lists all available timeseries.
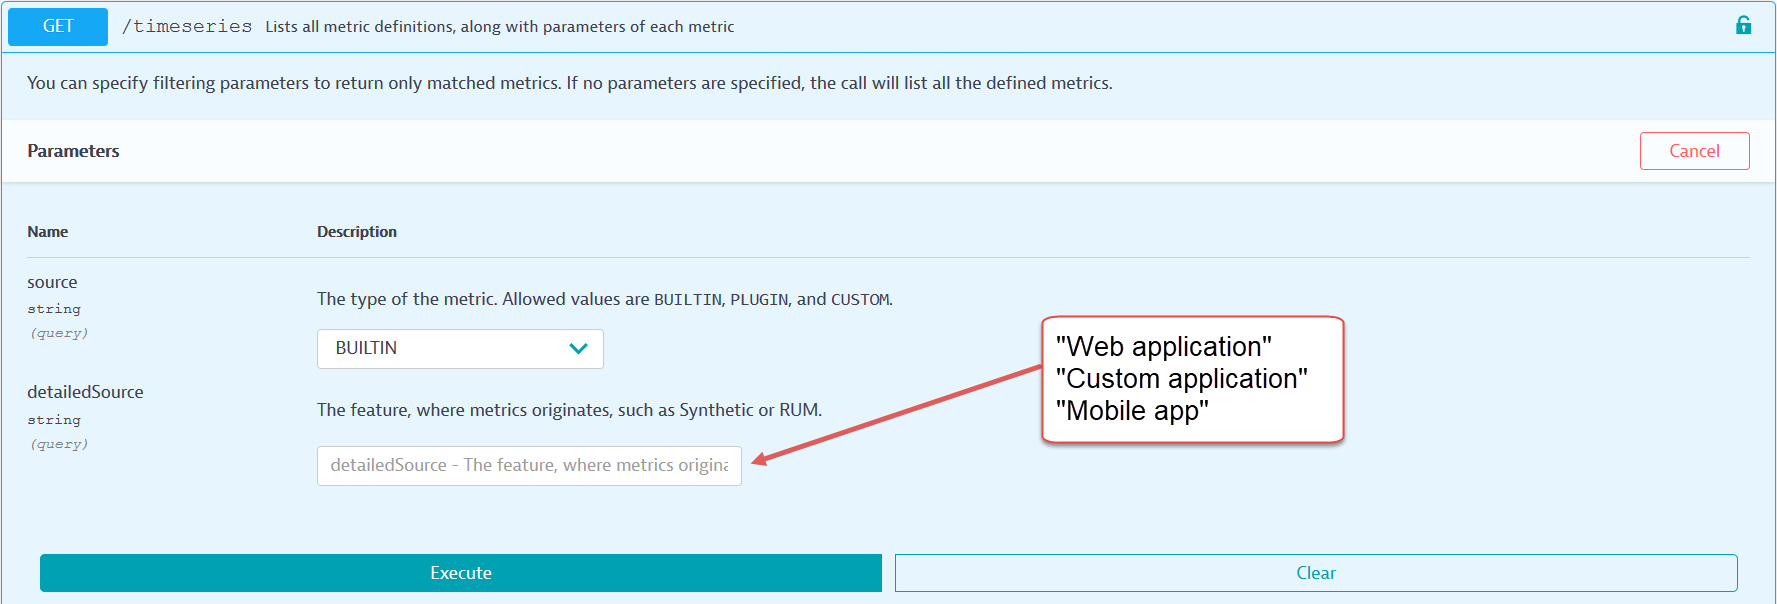
Mobile and custom application timeseries are built in, so select BUILTIN as the source.
As Dynatrace offers numerous built-in timeseries, you can specify detailed source information in the detailedSource field to narrow down the list of returned responses. To see only the new timeseries names, type either Mobile app or Custom application. Note: In the course of implementing the new mobile and custom timeseries, we have renamed the detailed source type for existing web-application timeseries from Real User Monitoring to Web application.
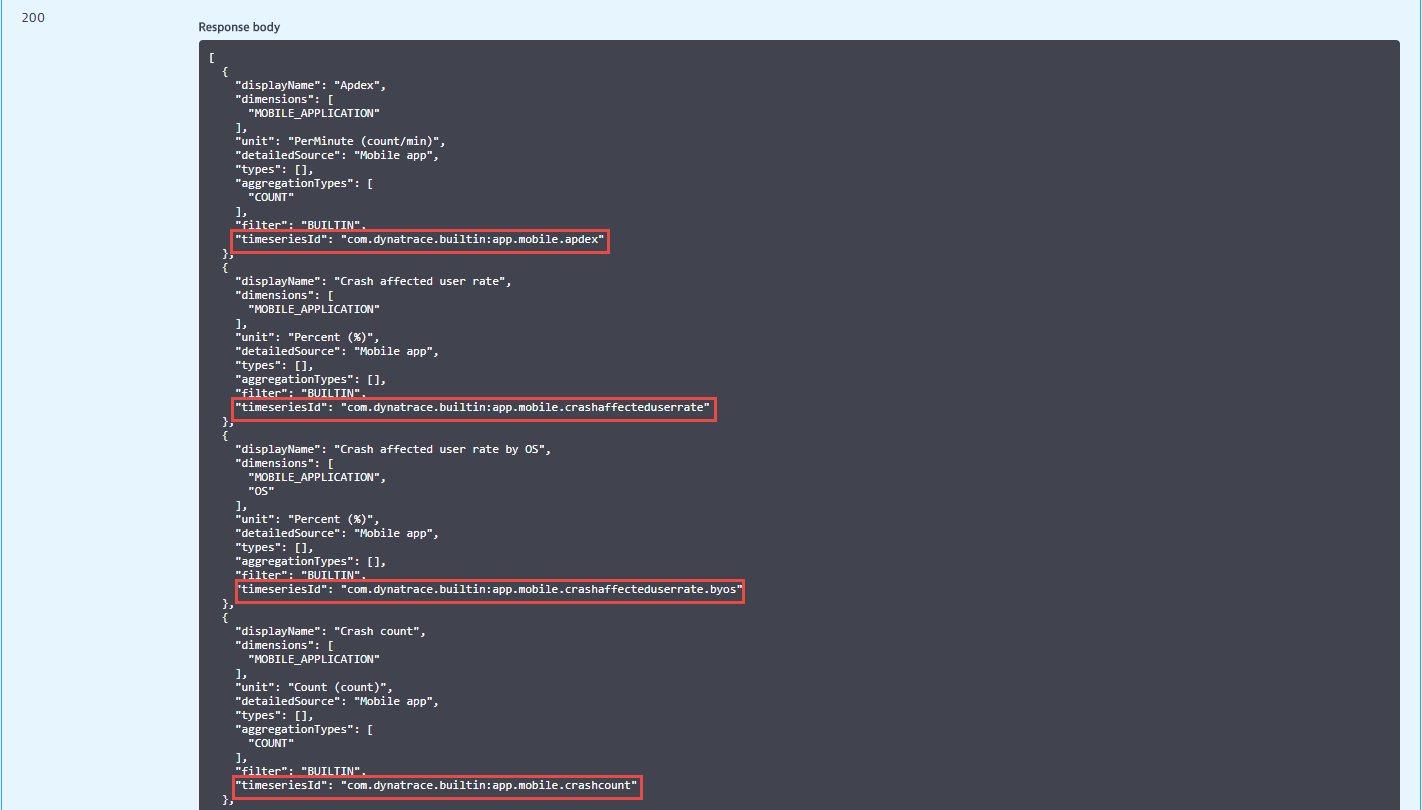
Click Execute to get the list of available timeseries for mobile monitoring.
The response shows each available timeseries with display name and the timeseries ID, which you use in the next step.
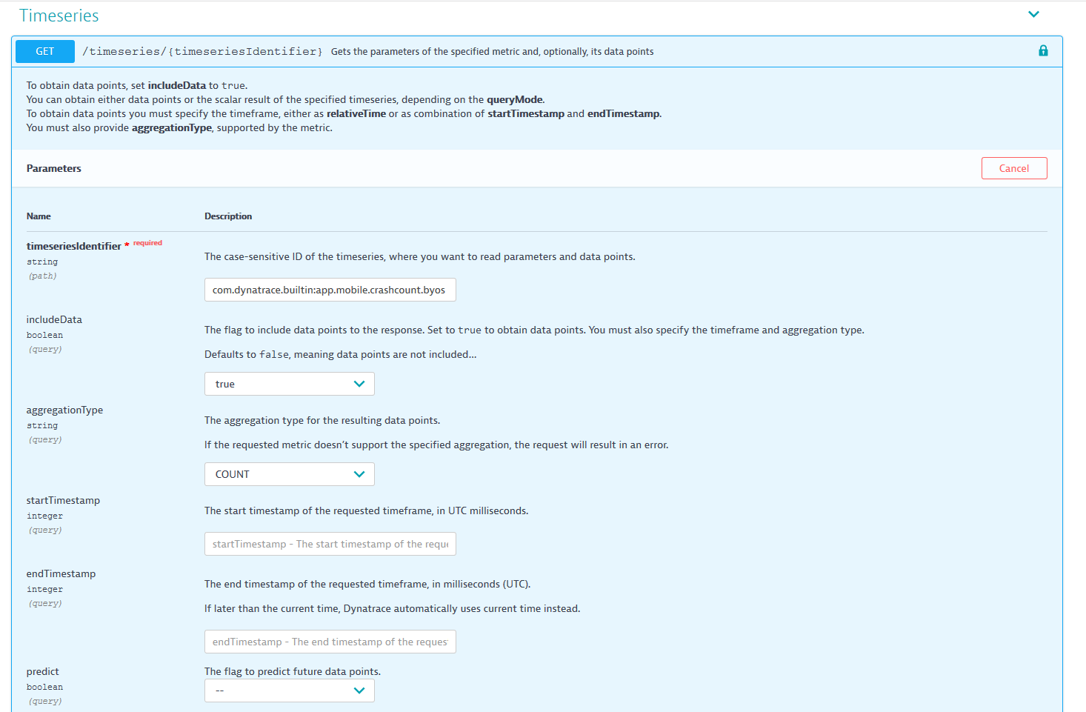
Pick one of the timeseries and query the data points with the GET/timeseries/{timeseriesIdentifier} request.
Insert the timeseriesidentifiercom.dynatrace.builtin:app.mobile.crashcount.byos. This returns fatal mobile app crashes per minute by OS.
Set includeData to true.
Set the aggregationType to COUNT.
Set a valid timeframe. It’s easy to use the relativeTime option to do this or you can use startTimestamp and endTimestamp.
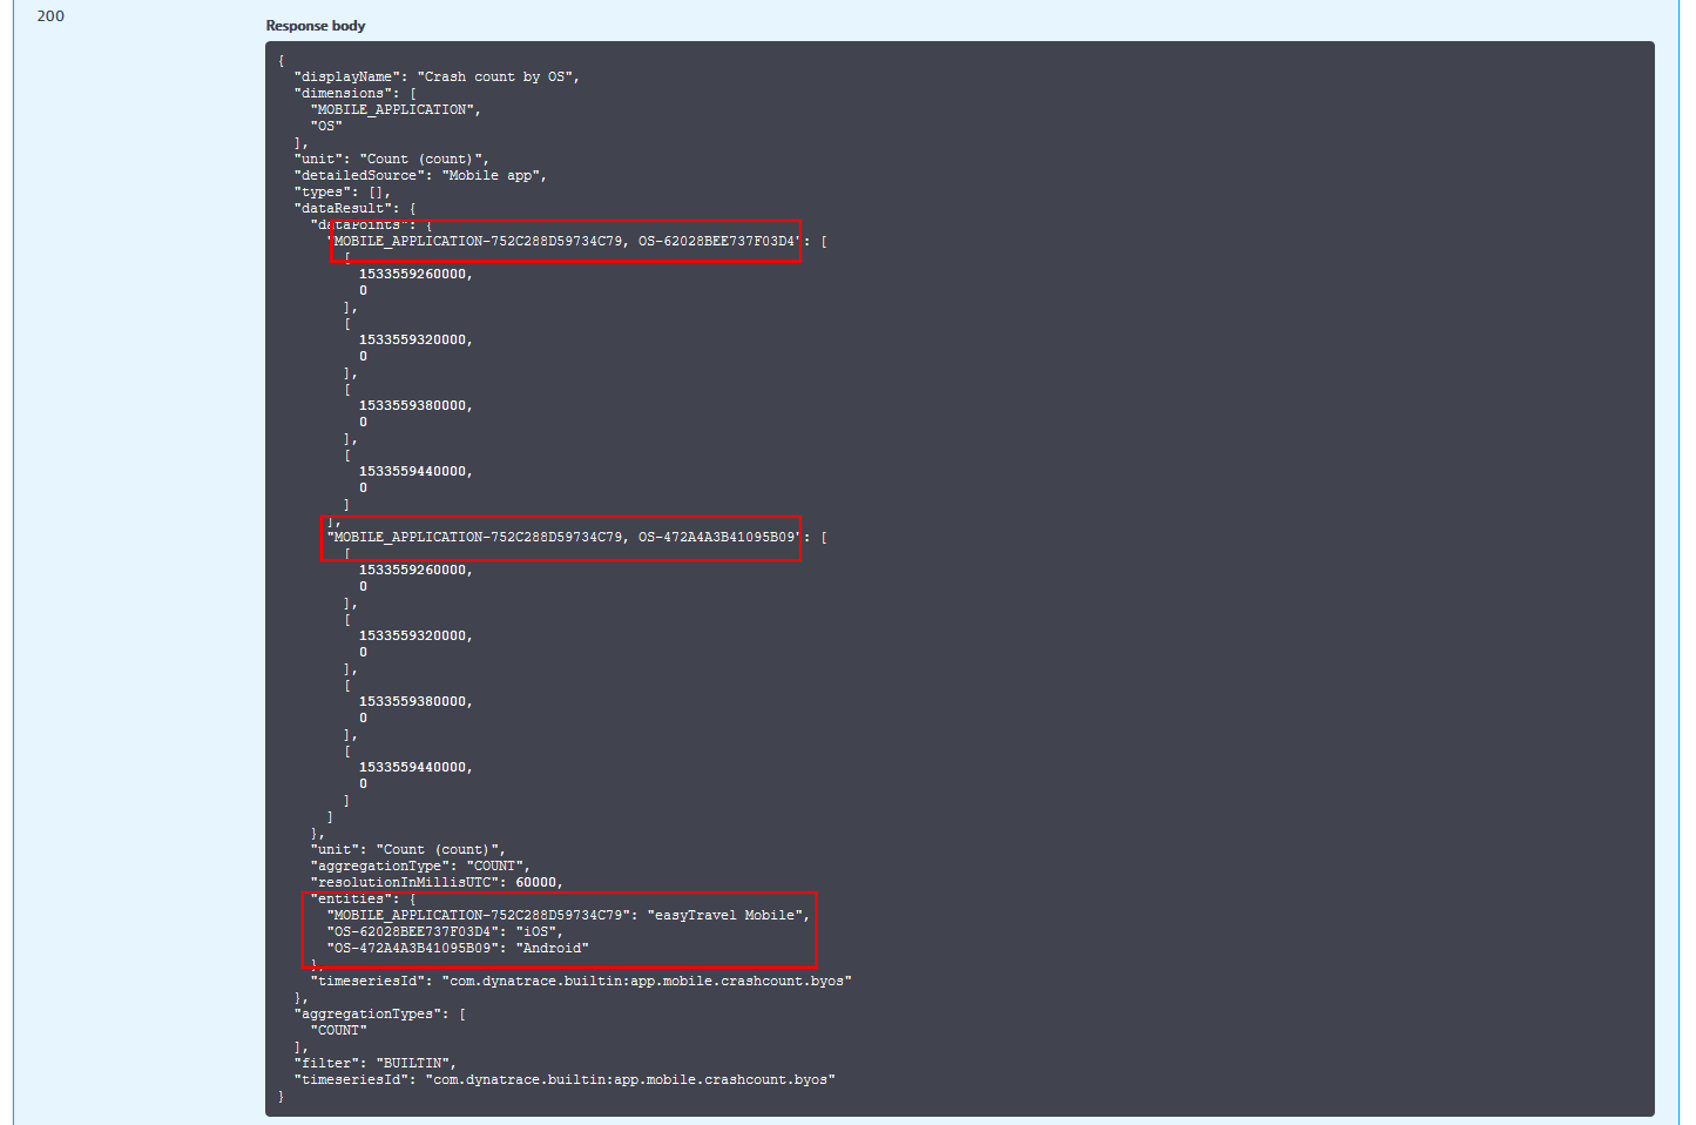
Execute the query. You will see the response data split by entity IDs like application and operating system.
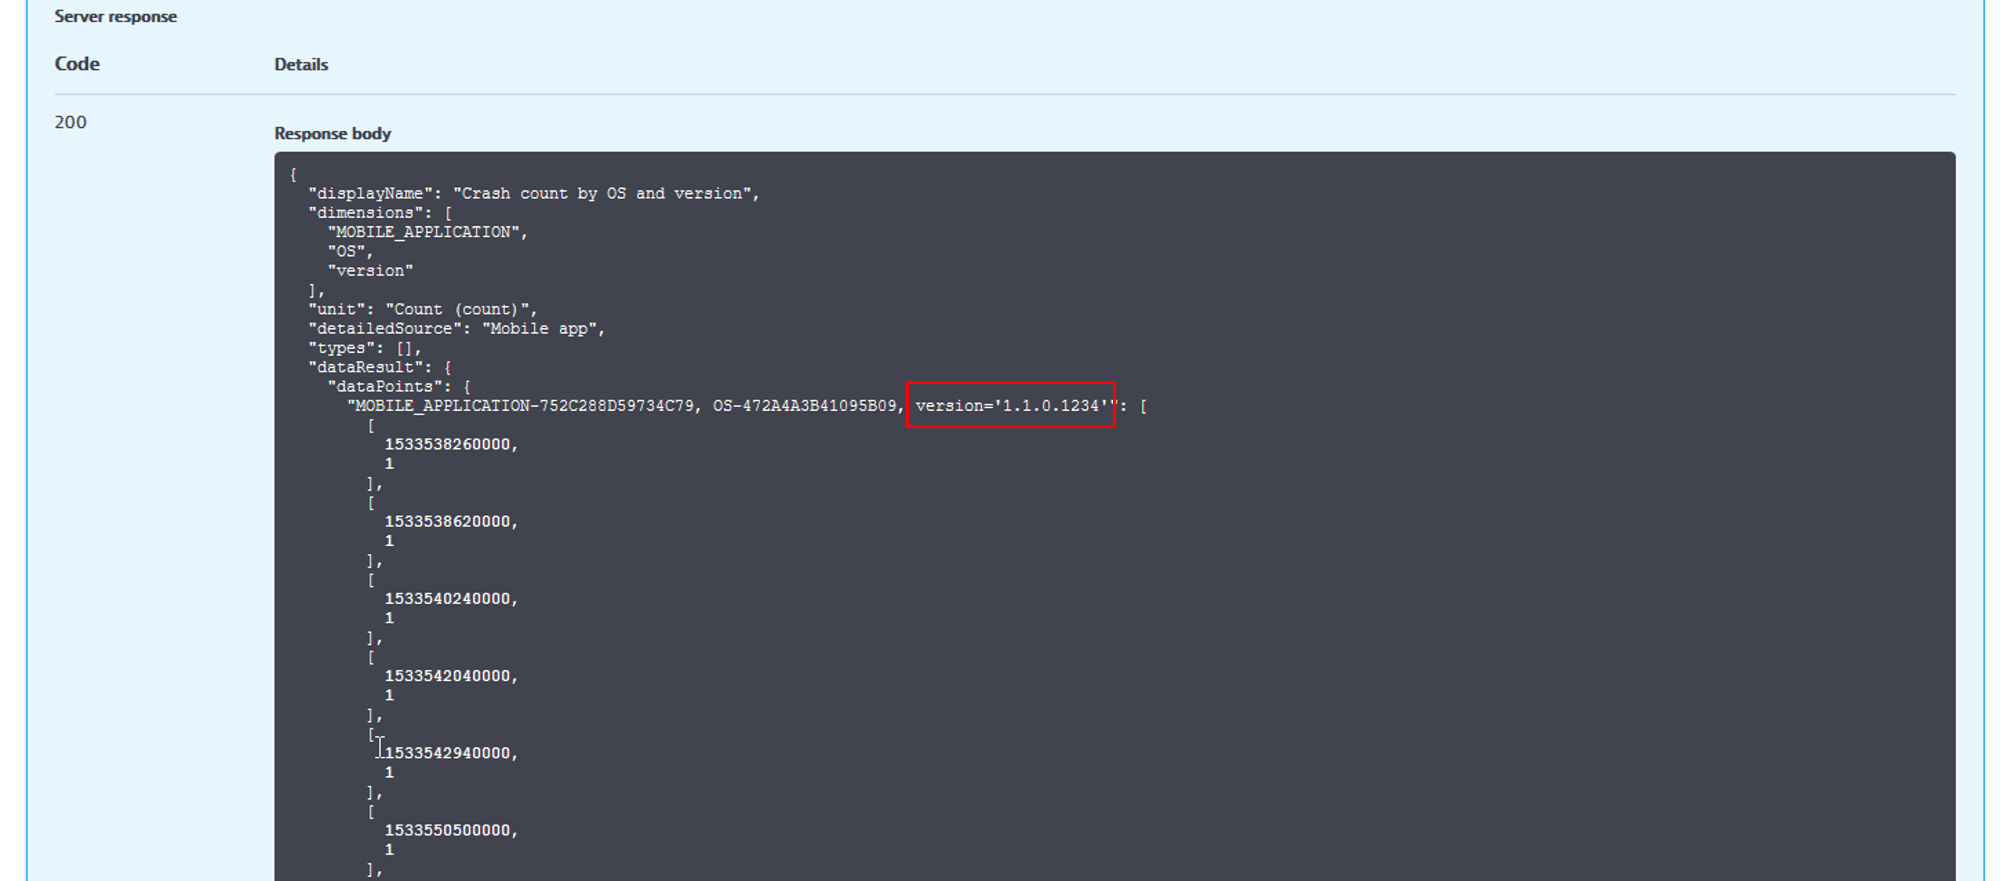
The first highlighted section shows data points for Dynatrace entity with the …D4 OS type (iOS). The second highlighted section shows data points for the …B09 OS type (Android). Each data point shows the timestamp and number of crashes in that minute. The resolution of the time slot (1, 5, 15 minutes or 1 hour) is shown in the meta information section of the response. Here you can also see that the mobile app entity is the EasyTravel Mobile app. Some relevant dimensions don’t have entity IDs (for example, the application version), though it is interesting to see crashes split out by application version. In the timeseries com.dynatrace.builtin:app.mobile.crashcount.byosandversion below, results are sorted by application version, although there is no entity ID for it.
As you can see, the API Explorer is a handy tool for exploring the timeseries metric data that Dynatrace provides for mobile apps and custom applications. For an overview of all timeseries available, take a look at Dynatrace Help.


Looking for answers?
Start a new discussion or ask for help in our Q&A forum.
Go to forum