

PurePath®
Capture and analyze timing and code-level context for all distributed traces, end-to-end, across the full stack.


The automation and AI from Dynatrace set it apart from the competition, it gives us more information around how our entire software stack is performing.
What is PurePath Technology®?
PurePath® is Dynatrace’s patented distributed tracing and code-level analysis technology. It automatically integrates high-fidelity distributed tracing with user experience data, data from open-source technologies, and code-level, including OpenTelemetry, and code-level analytics.
A winning combination: End-to-end tracing and code-level insights
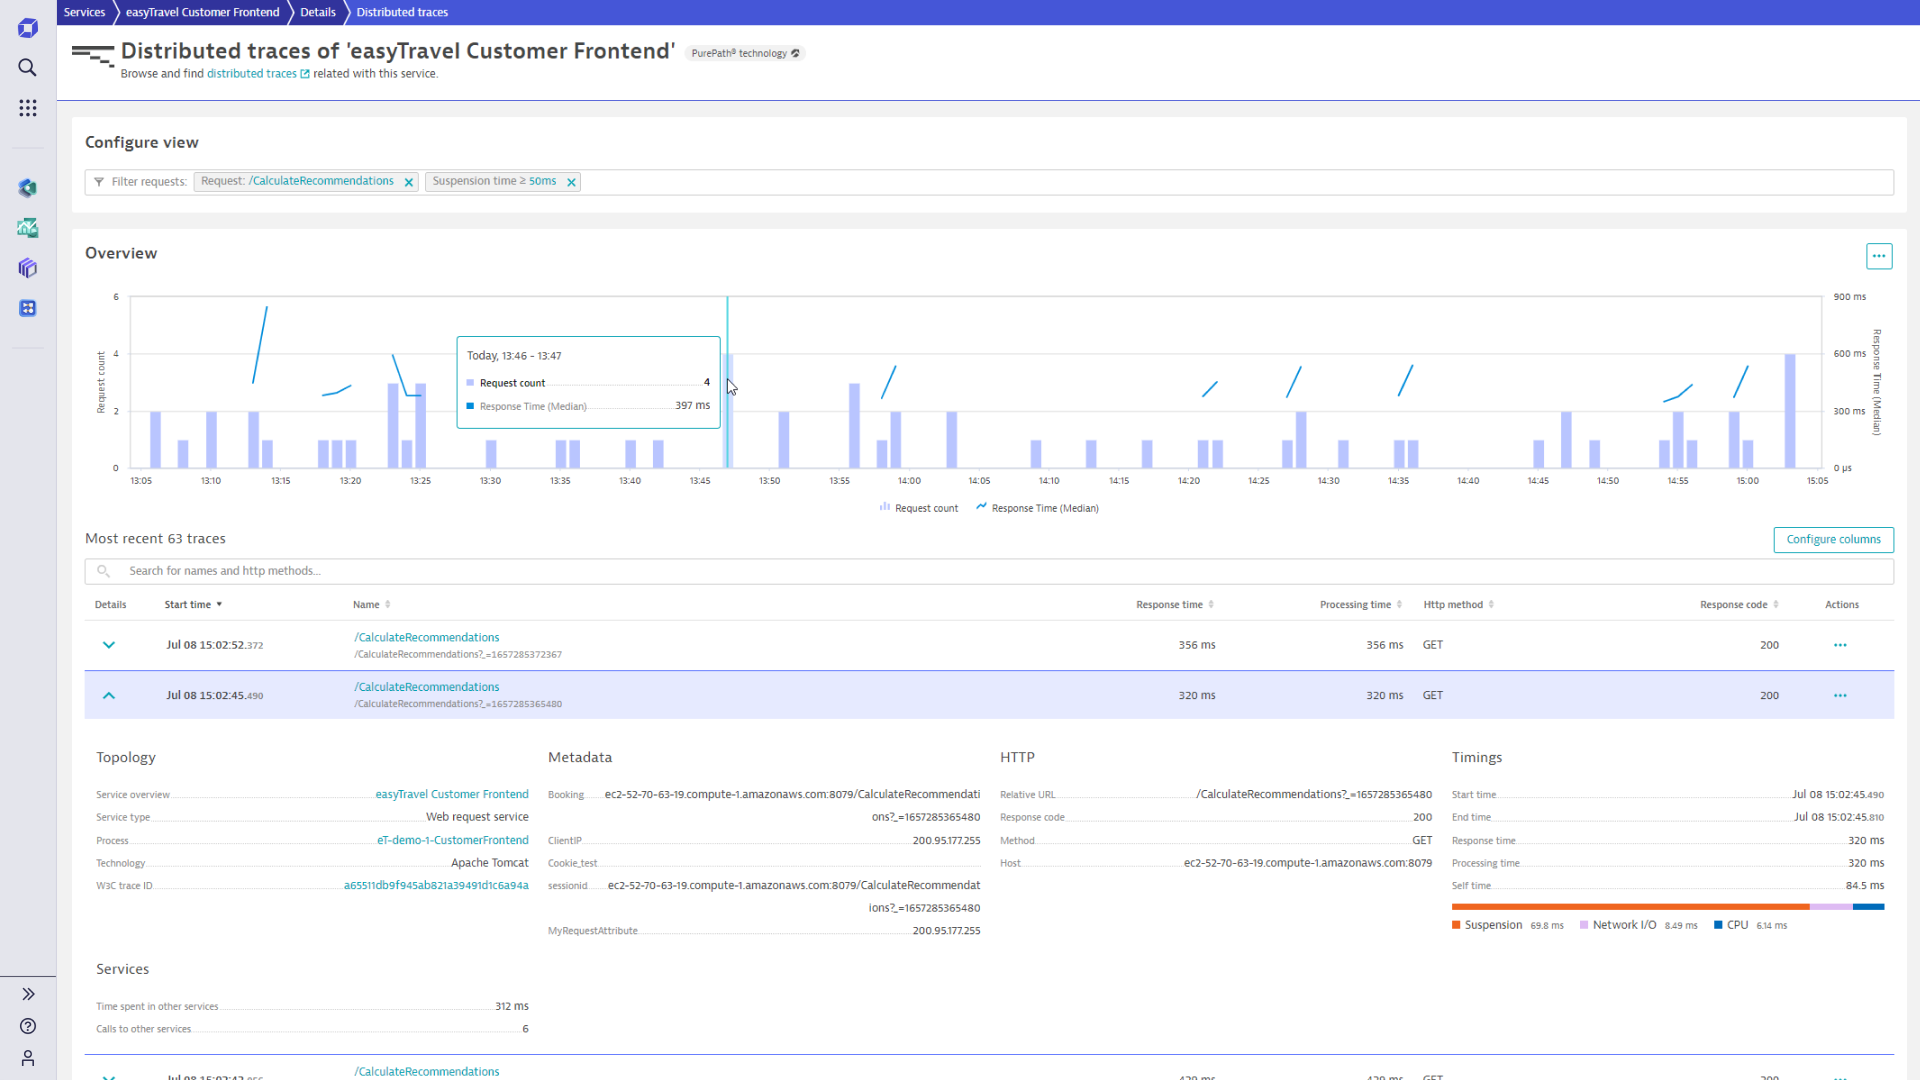
Our patented PurePath Technology® automatically captures and analyzes transactions end-to-end across every tier of your application technology stack with no code changes, from the browser all the way down to the code and database level.
Only Dynatrace provides:
- Automatic injection and collection of data, no code changes or scripting or sensor placement required.
- Code-level visibility across all application tiers for web and mobile apps together, from the front-end to the back-end, including modern cloud-native technologies like microservices and serverless functions.
- Built-in, always-on profiling and industry leading diagnostic tools for the most comprehensive application analysis and optimization.
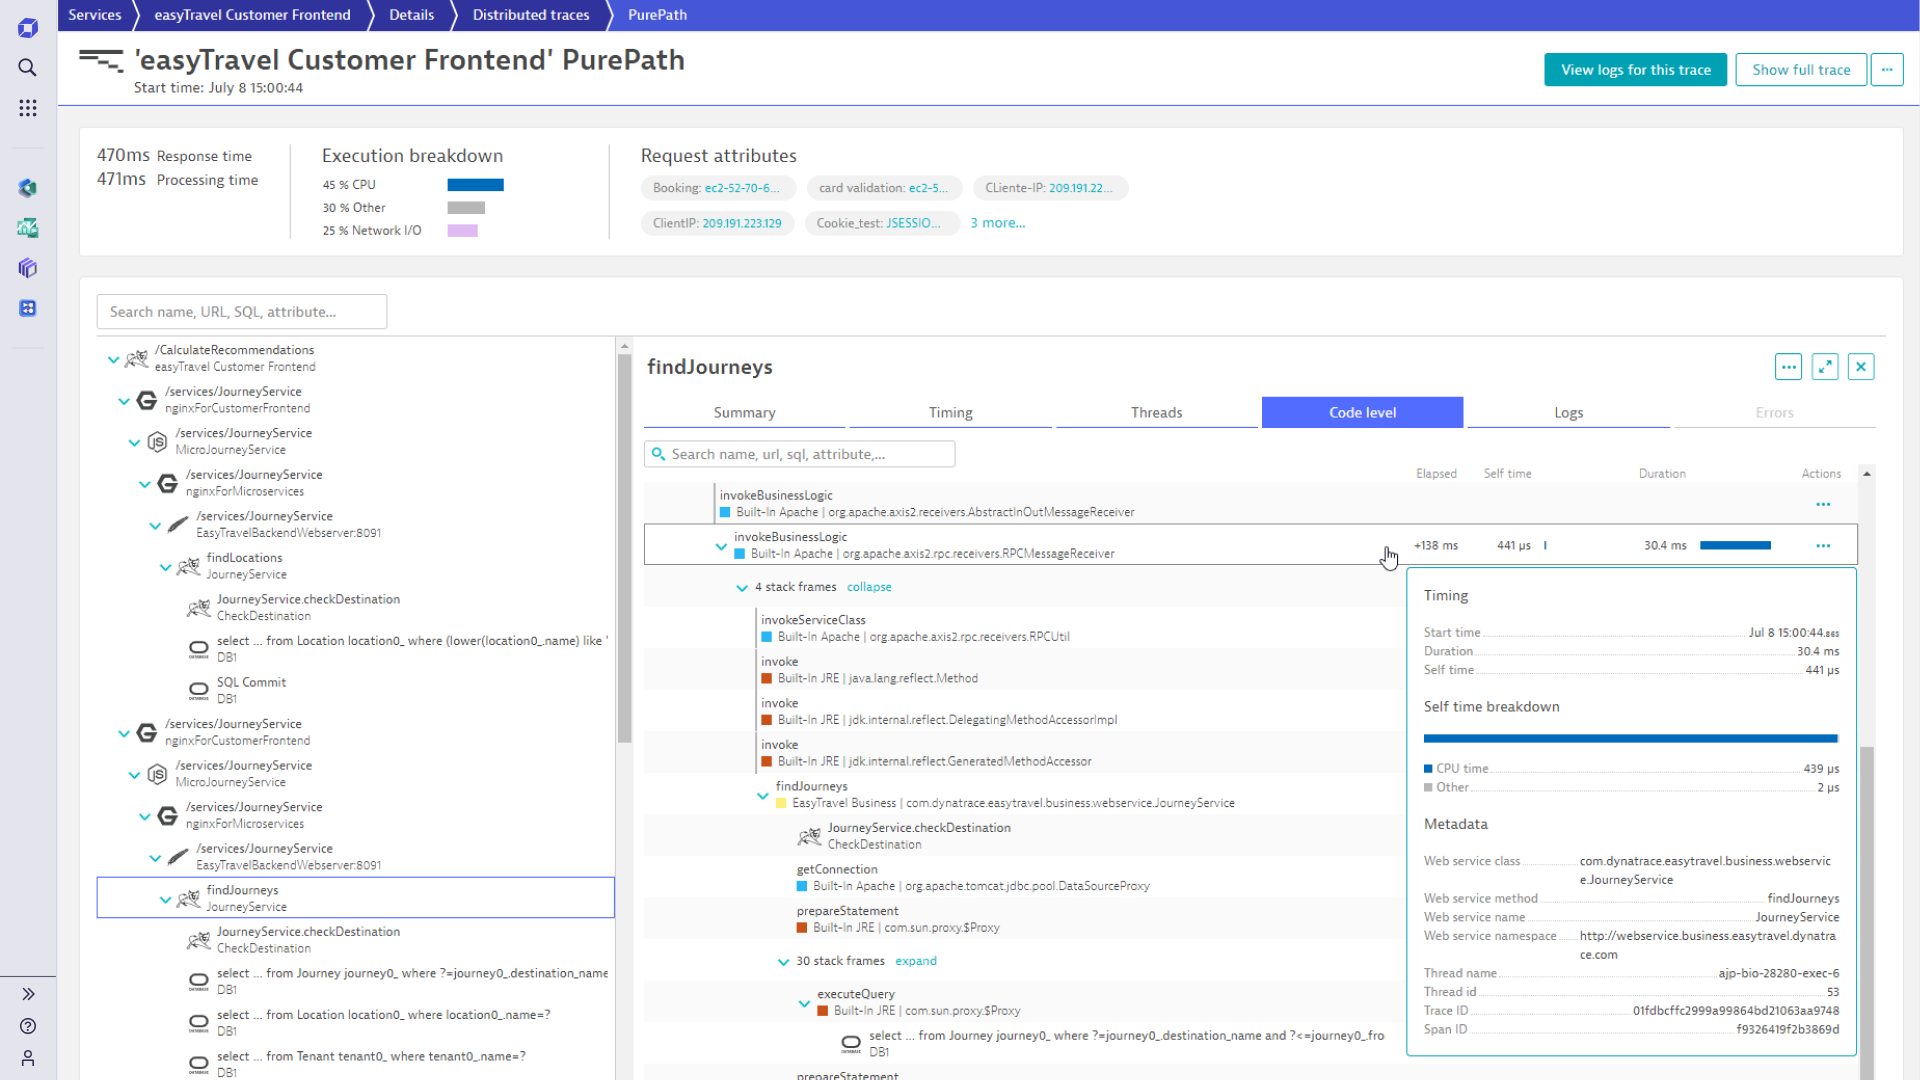
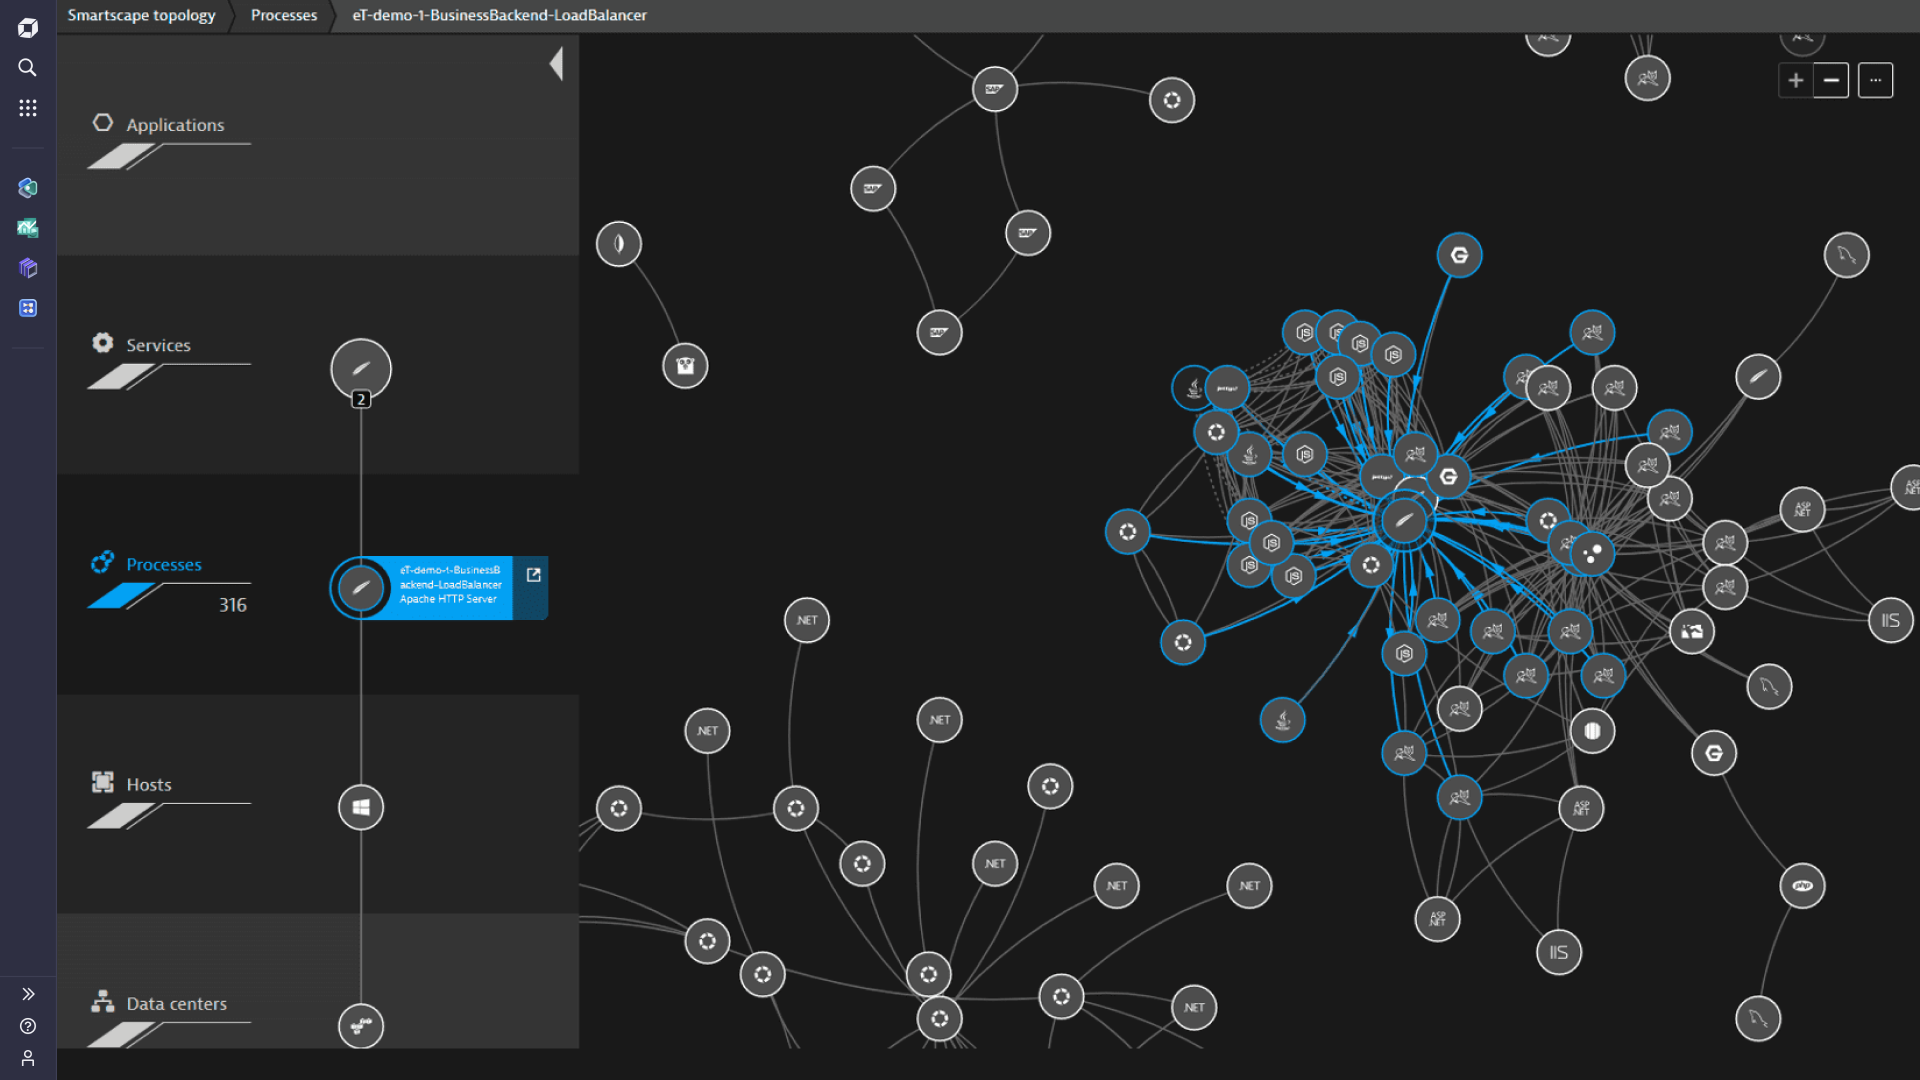
Go from big picture to code level and log detail with just a few clicks
The Dynatrace Smartscape® topology model understands how everything is connected, across the full stack from user experience and business outcomes down to the lowest level of infrastructure. That means your team can drill down from a high-level view into an individual transaction and then down to code-level and log detail with just a few clicks.
End-to-end, even for the most advanced cloud-native apps
With next-gen PurePath®, Dynatrace is the only observability solution that brings together high fidelity distributed tracing, code-level visibility, and advanced diagnostics across the most advanced cloud-native serverless and service mesh architectures. All while, supporting and enriching the latest open standards.

Automatic injection and data collection
With Dynatrace, everything is automatic. Just install OneAgent®, and we do the rest – no manual configuration, tagging, or startup parameters needed. OneAgent automatically and continuously discovers your environment, even auto-injecting into containers and automatically integrating data from open-source telemetry sources like OpenTelemetry. The result? No matter what technologies you are using, the collection and analysis of PurePath data are effortless.
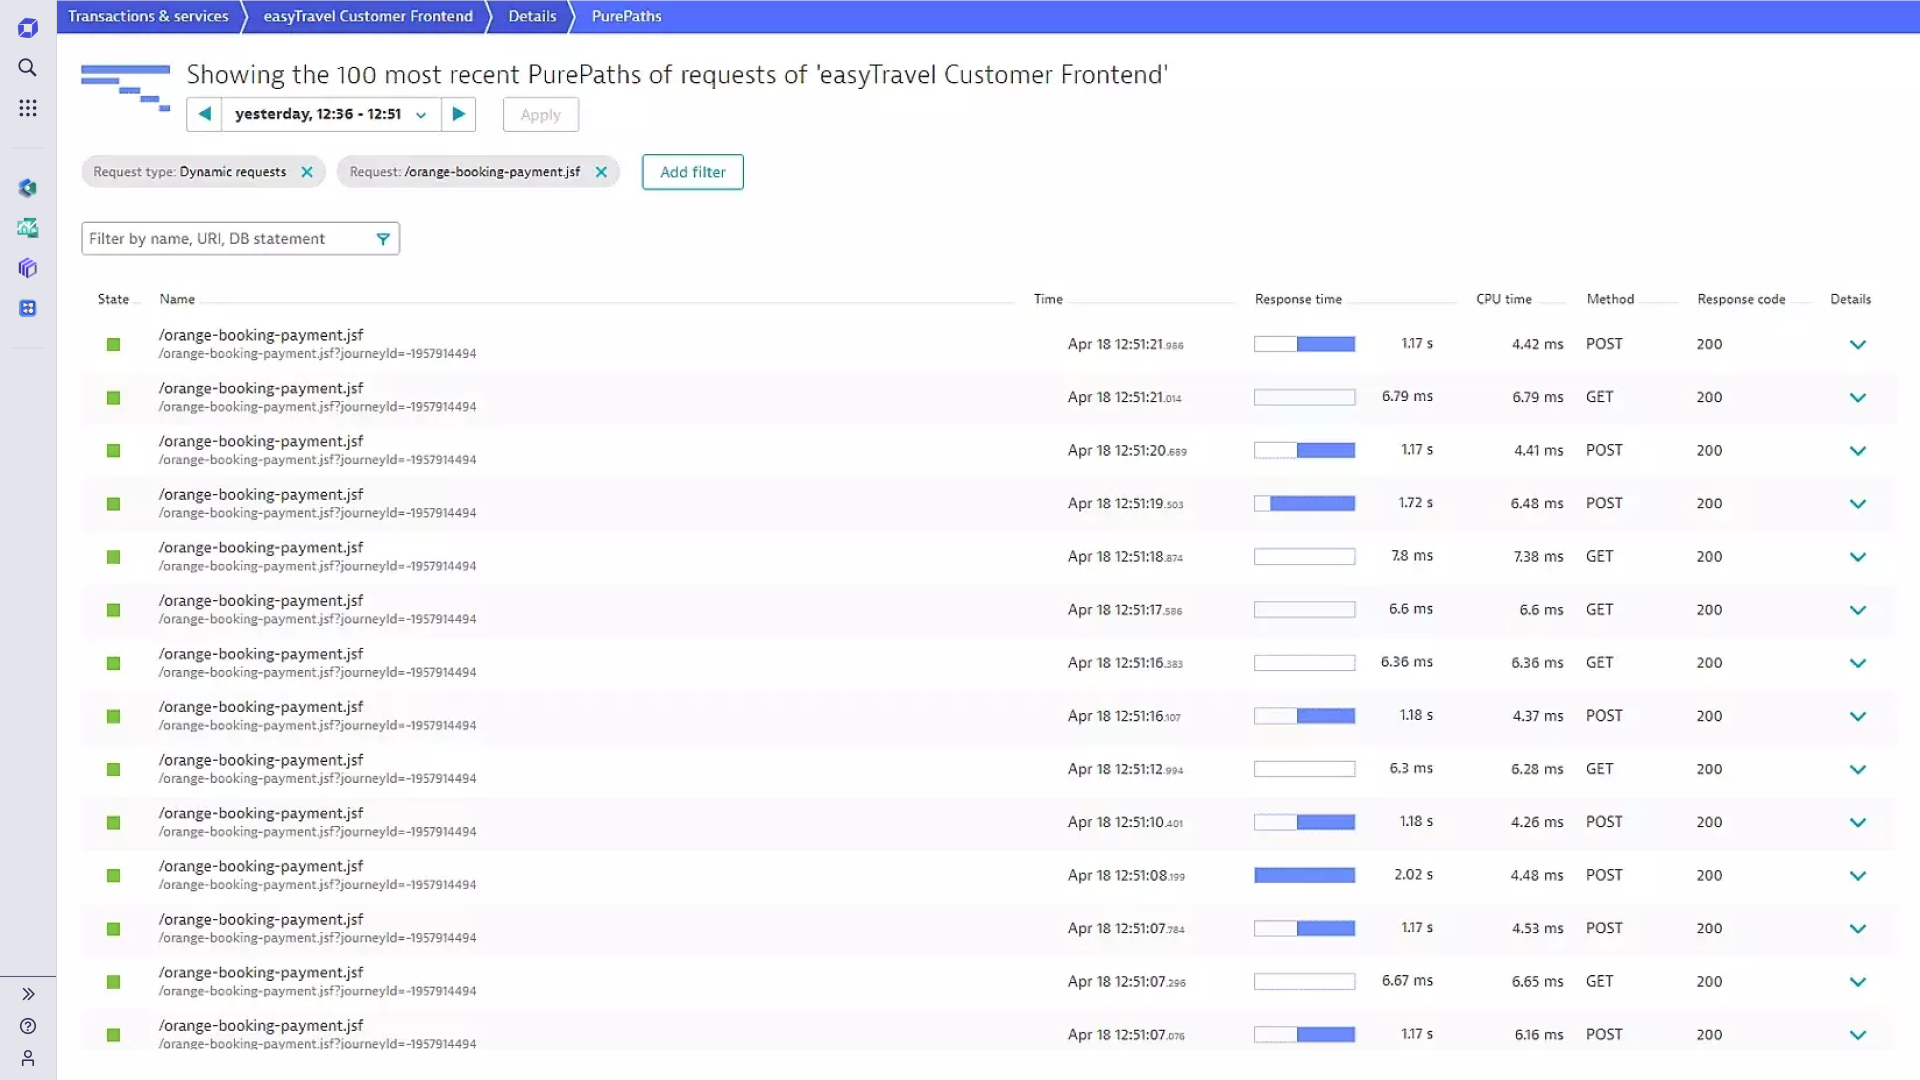
How does PurePath work?
PurePaths are code-level traces that span an end-to-end transaction. Whenever a user initiates an interaction with an application (either real or synthetic activity), Dynatrace gives the transaction a unique ID. As the transaction launches requests, this ID "travels" with the requests on thread-local storage from tier to tier— so we know that all other methods on that thread belong to the same transaction. Ultra-lightweight code components capture relevant metrics which are then sorted and assembled into PurePaths.
Just a few of our enterprise customers


Try it free


