
As digital transformation continues to accelerate and enterprises modernize with the adoption of cloud-native architectures, the number of interconnected components and microservices is exploding. Logs are a critical ingredient in managing and optimizing these application environments. Dynatrace now unifies log monitoring with its patented PurePath technology for distributed tracing and code-level analysis. Logs are now automatically connected to distributed traces for faster analysis and optimization of cloud-native and hybrid applications.
Customers expect enterprises to deliver increasingly better, faster, and more reliable digital experiences. Cloud-native observability is a prerequisite for companies that need to meet these expectations. Observability enables a holistic approach to automation and BizDevOps collaboration for the optimization of applications and business outcomes.
Logs are a crucial component in the mix that help BizDevOps teams understand the full story of what’s happening in a system. Logs include critical information that can’t be found elsewhere, like details on transactions, processes, users, and environment changes.
A key element of effectively leveraging observability is analyzing telemetry data in context. Being able to cut through the noise, with all the relevant logs at hand, dramatically reduces the time it takes to get actionable insights into the optimization and troubleshooting of workloads.
Without automation, this contextualization is hardly feasible, especially in large and dynamic environments. Modern heterogeneous stacks consist of countless interconnected and ephemeral components and microservices. Log entries related to individual transactions can be spread across multiple microservices or serverless workloads. Manual and configuration-heavy approaches to putting telemetry data into context and connecting metrics, traces, and logs simply don’t scale.
Automatically connect logs and distributed traces at scale
With PurePath® distributed tracing and analysis technology at the code level, Dynatrace already provides the deepest possible insights into every transaction. Starting with user interactions, PurePath technology automatically collects all code execution details, executed database statements, critical transaction-based metrics, and topology information end-to-end.
By unifying log analytics with PurePath tracing, Dynatrace is now able to automatically connect monitored logs with PurePath distributed traces. This provides a holistic view, advanced analytics, and AI-powered answers for cloud optimization and troubleshooting.
Automatic contextualization of log data works out-of-the-box for popular languages like Java, .NET, Node.js, Go, and PHP, as well as for NGiNX and Apache Web servers. Unlike other approaches in the market, Dynatrace allows you to apply this new functionality broadly via central activation. This automated approach avoids any manual configuration of tracers or agents and the need to restart processes.
In addition, Dynatrace offers an open-source approach to the contextualization of log entries and distributed traces as well via OpenTelemetry.
PurePath traces provide a transaction-centric view across all telemetry data
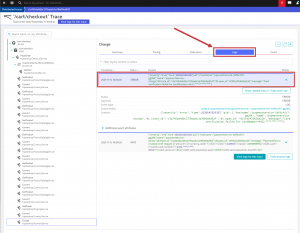
You can instantly investigate logs related to individual transactions on the new Logs tab in the PurePath view. This instantly reveals additional context.
The example below includes analysis of a payment issue. It shows that a call to the payment provider was declined because the credit card verification failed. From the call perspective, you can easily see the related entry in the code-level information to understand where in your code this specific log entry was really created.
Seamlessly switch context and analyze individual spans, transactions, or entire workloads
Dynatrace makes it easy to view the log lines related to individual spans or a broader view that covers transactions end-to-end or even entire workloads.
Uniquely, Dynatrace also provides connections to the processes that handle each call.
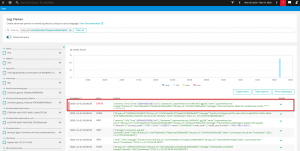
In the screenshot above, you can see that a single trace created 64 different log entries. The top entry, marked with status ERROR is critical to the analysis of this issue.
This seamless user journey is also available from the log viewer side. You can easily get from individual log lines to a transaction-centric view for additional context and analysis.
How to get started
Starting with OneAgent version 1.231, you can activate our OneAgent code modules for Java, .Net, Go, Node.js, PHP, NGiNX, or Apache Web server to automatically enrich logs with trace context without any manual code or configuration change on your workload. Just go to Settings > Server-side service monitoring > Deep Monitoring > New OneAgent features. This ensures that trace IDs are automatically added to log lines for transaction-based analytics.
Structured log entries that are ingested via the Generic log ingestion of Log Monitoring V2 will show up in related PurePath traces starting with Dynatrace version 1.232.
Within the next 90 days, all transaction-related logs will show up in PurePath view after activation of this new functionality.
To find out more, see:
- Dynatrace Log Monitoring Classic documentation
- PurePath distributed tracing documentation
- Log analysis with PurePath® technology
- Connecting log data to traces
Log Monitoring Classic
Log Monitoring Classic is available for SaaS and managed deployments. For the latest Dynatrace log monitoring offering on SaaS, upgrade to Log Management and Analytics.
New to Dynatrace?
If so, start your free trial today!


Looking for answers?
Start a new discussion or ask for help in our Q&A forum.
Go to forum