
With the increase in the adoption of cloud technologies, there’s now a huge demand for monitoring cloud-native applications, including monitoring both the cloud platform and the applications themselves. Many cloud providers offer built-in monitoring tools for transparency and easy management of resources, which begs the question “Why do I need add-on monitoring tools?” Hopefully, this blog will explain ‘why,’ and how Microsoft’s Azure Monitor is complementary to that of Dynatrace.
Do I need more than Azure Monitor?
Despite cloud migration projects continuing to be frontrunners in enterprise IT, the question that still comes up is when to consider third Party monitoring solutions when our cloud provider offers everything.
Azure Monitor features
Microsoft offers a wide variety of tools to monitor applications deployed within Microsoft Azure, and the Azure Monitor suite includes several integration points into the enterprise applications, including:
- VM agent – Collects logs and metrics from the guest OS of virtual machines. (Available as an agent installer)
- Dependency agent Installation – Maps connections between servers and processes.
- Log Agent Installation – Collects logs from the virtual machines.
- Application Insights – Collects performance metrics of the application code. This requires the installation of an instrumentation package into the code making it a hands-on approach to monitoring.
- User analysis – Adding a JavaScript tag into the applications front end pages enables the collection of front-end load times of the applications.
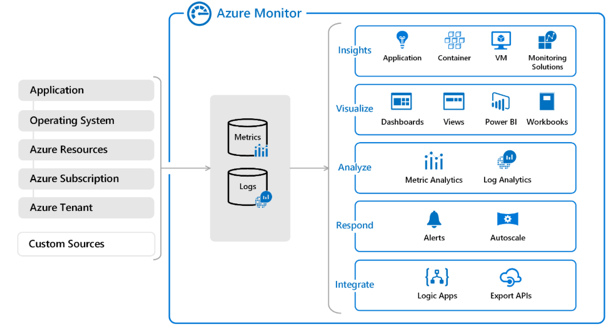
Combined, these integration points cover the full application stack from infrastructure monitoring to end-user experience.
How does Dynatrace fit in?
Dynatrace offers a strong integration with Azure Monitor API to ensure that metrics are collected for platform services as they interact with applications deployed on Azure. This offers a 360 view of all applications. With an all-in-one, fully automated, platform Dynatrace brings some unique values to the table for applications deployed on Microsoft Azure including:
- Dynatrace OneAgent – The Dynatrace OneAgent allows for an automatic approach to collecting monitoring data and business.
- AI engine, Davis® – Automatically processes billions of dependencies to serve up precise answers; rather than processing simple time-series data, Davis uses high-fidelity metrics, traces, logs, and real user data that are mapped to a unified entity.
- Distributed Tracing – Distributed Tracing / Code level insights for multiple technology stacks are achieved without any code changes. Enabling teams across enterprise evaluate transactions flowing between multiple tiers without any added logic.
- Hybrid and multi-cloud platform – The structure of the Dynatrace platform, offers the ability for integrations with several other cloud platforms.
- Digital Experience Monitoring (DEM) – A fully integrated DEM enables monitoring of the end-user experience for your applications while also providing data for business-level analytics. Our DEM offering also includes:
- Synthetics – Run browser-based workflow tests from multiple geographic locations for scoring availability of your applications before end-users experience issues.
- Session Replay – Record user sessions in real-time, with the ability to replay the session to find the root cause of the problem, and usability analysis.
In addition to the OneAgent collecting all these metrics, Dynatrace has an integration with Azure Monitor to capture additional metrics for platform services such as Storage Accounts, Redis Cache, API Management Services, Load Balancers among others. Dynatrace does this by querying Azure monitor APIs to collect platform metrics. This enriches the data by providing cloud infrastructure metrics, metadata exposed by Azure combined with the data captured by Dynatrace OneAgent.
While it may seem that Azure Monitor and Dynatrace are in the same space of collecting metrics, the way Dynatrace adds automation and intelligence to the data elevates Dynatrace away from the Application Performance Monitoring/Gen2 monitoring pack. The Dynatrace platform is a comprehensive one-stop-shop for cloud migration and digital transformation.
Migrating to the cloud
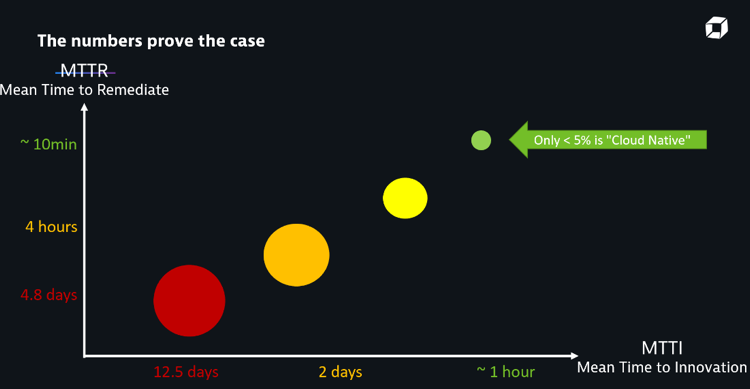
With massive cloud migrations, the successful indicators for Digital Transformation are to reduce Mean Time to Remediate (MTTR) and Mean Time to Innovate (MTTI). This means different things to different personas in an enterprise organization.
So, who cares, and why?
- Developers: When you’re living and breathing the code, you tend to favor a more hands-on approach and would love to see the snapshot debugger (Visual Studio) capture the application trace while adding new application features. Being able to see the code in action ensures developers can identify any code issues in early phases and innovate faster (fail early, fail often).
- Operations: Responsible for ensuring flawless performance of the overall applications they support requires real-time, contextual data, powered by built-in Artificial Intelligence to avoid war rooms. Implementing automation through autonomous cloud management (ACM) capabilities powered by Dynatrace ensures Ops teams can reduce their MTTR, ensure SLA’s are met and outages are avoided, whilst powering massive production roll-outs with minimum effort.
- Business: The business thrives on dashboards and reports. Dynatrace provides business-level insights for the entire application bubbled up from the monitoring data it collects. Contextual revenue analysis and uptime reports have never been easier, or more powerful. Reduced MTTI results in business features released faster and the reduced MTTR ensures less downtime providing more revenue-generating opportunities.
A shift in the cloud landscape demands a shift in monitoring patterns as well as cultural change. Some of the main elements to look for in a monitoring platform includes:
- Support for multi-, and hybrid-cloud enterprise applications.
- End-to-end distributed tracing rather than simply monitoring the uptime of servers.
- Organic scalability of the monitoring platform with the applications.
- AI engine to detect anomalies and perform root-cause analysis, enabling AIOps.
- Strong integrations into common DevOps practices.
While Azure Monitor offers a comprehensive range of solutions, finding the right one for your organization would depend on the personas you are looking to cater to. An effective monitoring strategy for predominantly Azure environments will include a synergy of both Dynatrace and Azure Monitor.
- Using offerings provided by Azure Monitor during the development cycle helps build a strong performance-first mindset in the early stages of application development.
- In order to run production workloads with autonomous operations requires organically scalable and artificial intelligence-enabled feature sets offered by Dynatrace.
Together, Dynatrace and Azure Monitor has the power to improve your operations, reduce your MTTR, and increase innovation in your organization.


Looking for answers?
Start a new discussion or ask for help in our Q&A forum.
Go to forum