Digital Experience monitoring and COVID-19 – What we learned monitoring critical websites.
Since the start of COVID-19, organizations have adapted to a new normal, shifting employees to work-from-home and initiating more remote servicing for customers. As we continue to adapt, Biz/Dev/Ops teams are under intense pressure as organizations turn to apps and the cloud to transact business and keep employees productive and customers satisfied.
Over the last two months, we’ve monitored key sites and applications across industries that have been receiving surges in traffic, including government, health insurance, retail, banking, and media. Despite some instances of disruption, most of these sites and applications have held up, and traffic increases have been manageable.
This evaluation reveals lessons for all digital service owners as we prepare for ongoing, unpredictable demand surges.
Monitoring with the Dynatrace® Digital Experience Monitoring module
Readers who share our privacy concerns, please note, all the data we monitor is publicly available.
The insights in this blog rely heavily on data captured by Dynatrace’s proactive synthetic monitoring capabilities. We are monitoring from remote end–user locations and using a standard Chrome browser to open these key pages every 15 minutes. We are also capturing some Real User Monitoring (RUM) data from JavaScript instrumentation, which is automatically injected into responses by the Dynatrace OneAgent.
Looking at our overall data set, we saw a small increase in some key metrics and performance indicators, but this wasn’t substantial.
- Visually complete – the time it takes for a webpage to appear fully on screen – rose from 2.68 seconds to 2.78 seconds on average, before dropping back slightly to 2.74 seconds.
- Action duration – the time it takes for the page to fully load – increased from 4.0 seconds to 4.14 seconds on average, before dropping back to 4.07 seconds.
A deeper investigation into industry-specific data reveals several interesting findings.
Breaking down performance across U.S. state governments and global COVID-19 portals
We’ve been looking at U.S. state home websites/portals, COVID-19 and employment portals on an ongoing basis since the last week of March.
The dashboard below shows, while U.S. state websites have mostly held up, there were some major performance degradations in several unemployment benefits portals, which led to some of these becoming intermittently inaccessible.

In some of these cases, visually complete times increased by up to 1,000% – averaging 25 seconds versus the usual 1.5 seconds in one case – and action duration times increased by up to 4,000%.
As growth in traffic creates more load on the state government websites, the infrastructure supporting those sites – including everything from network connections to load balancers, web servers, application servers and databases – becomes stressed. Think of it in the same way roads become busier during rush hour.
We have been working closely with several of these states to uncover issues including improperly configured database requests (slowdowns on the server-side) and increased Javascript errors that cause issues on the client (slowdowns on the browser side).
The image below from one state is especially insightful. This is from real user data that is captured by Dynatrace RUM. Historically, this state gets about 58,000 sessions every Monday (due to weekly claims). User sessions then taper off for the subsequent days of the week.

On March 17, everything changed. The state’s unemployment website reported a record 115,000 daily sessions. The following day, a normally mundane Wednesday, traffic soared to 128,000 sessions. On Thursday of that week, traffic increased to 153,000 sessions.
Throughout the month, traffic continued at levels that are well-above average. Most of this traffic was for the new unemployment applications, which tend to be long, demanding user sessions.
- Tuesday, March 24 saw a wave of people coming back to the website to file for unemployment benefits, amounting to 244,000 sessions in one day.
- By March 31, traffic had risen to an unprecedented 307,000 daily sessions. The sessions continue to mount.
- In the first two weeks in April, this state has had more web traffic than it had experience in 2020 to date.
During this time, Dynatrace helped uncover an inconsistent third-party service at the US Dept of Labor that the state was relying on. As a result, the state started to fast track deployment of Dynatrace into its state production website. It instantly uncovered a variety of client-side, browser–based Javascript errors (1,700+ per minute) as well as multiple 404 errors on its backend content server. Prior to the deployment, the state had no idea these were occurring.
Global COVID-19 employment benefit portal performance
We’ve also been monitoring U.S. federal sites as well as other government sites around the world, expecting to see an increase of traffic due to COVID-19. Once again, none of these sites have experienced major outages, but many have experienced some slowdowns.
A closer look at the dashboard below reveals that Italy’s benefits application portal came under strain after its launch on April 1 due to connection issues and slow server-response times.

However, the site had been struggling even in the days leading up to the benefits application portal launch, when Dynatrace saw several hour-long outages and timeouts for some users.
These outages were the result of connection issues in the form of 12014 Connection Timeouts, and 10054 Connection Resets. Additionally, increases in server-side response times (Time to First Byte) caused high response times, leading to failures.
After the portal launch on April 1, the site continued to experience connection issues in the form of 10054 Connection Resets up until April 10, as the dashboard below shows.
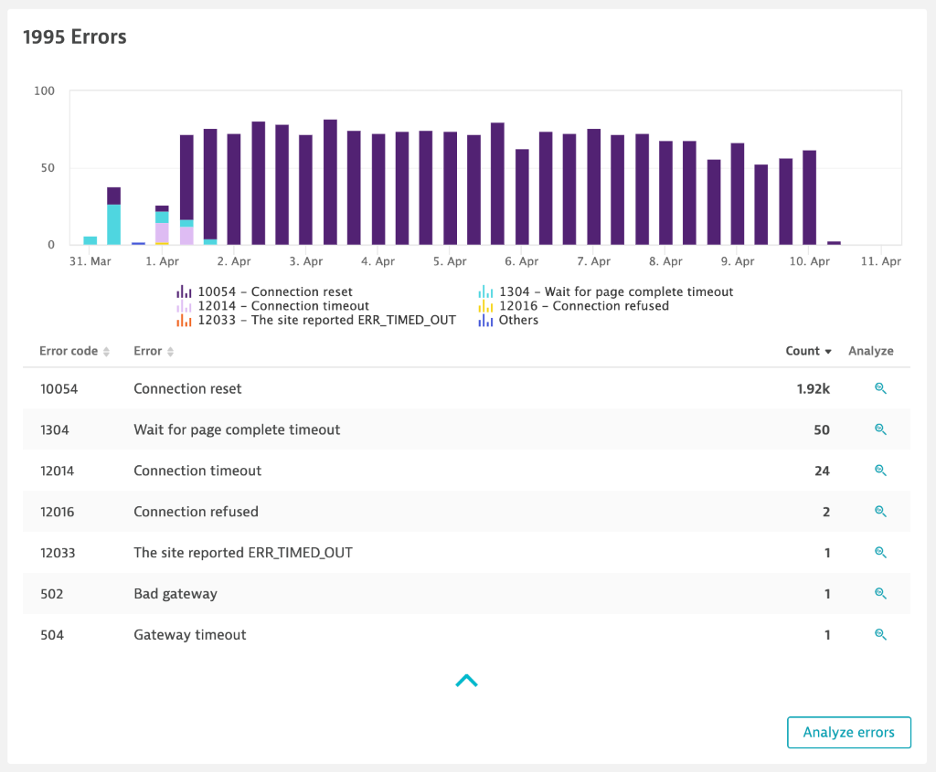
The errors above are automatically discovered by Dynatrace Real User and Synthetics monitoring as end users are experiencing them or our robots observe them.
Given the dramatic increases in traffic, one thing is clear: government agencies should be considering hyperscale computing options that can automatically scale up as demand increases.
Media performance
Watching media sites including CNN, Fox News, and CNBC has been very interesting. At first glance, if you were to look at the total duration of page load, it would appear these sites are under a lot of stress.
However, when you look at visually complete times (more of a perceived render time) the performance of these pages looks okay.
This is vital as many people are relying on these media sites to keep them updated on critical COVID-19 information.
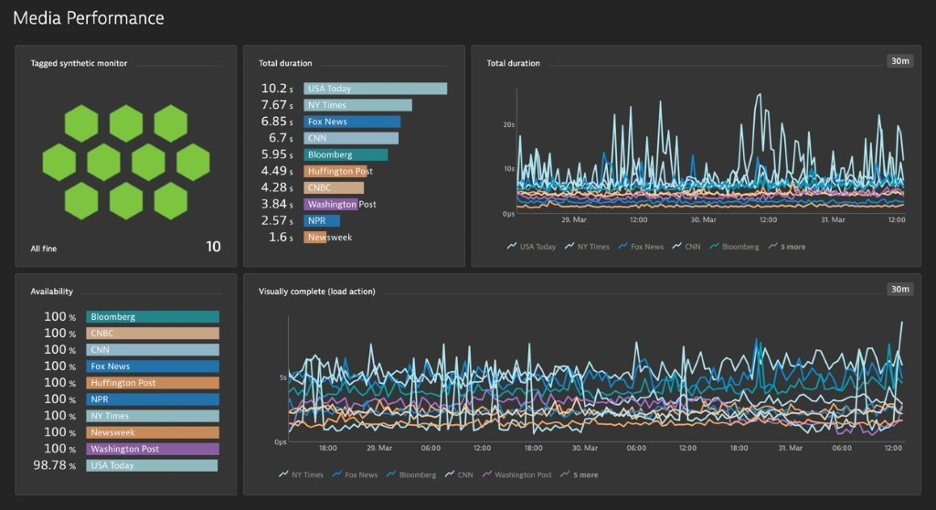
When we look at the metrics for these media sites, it appears they can handle the COVID-19 traffic influx, but many of their third-party ad providers and paid content providers are not able to.
As the dashboard below shows, these problems were particularly prevalent from March 9 – 27 when 24% of the top 34 media sites in the U.S. experienced significant performance degradations. During that period, average Action Duration (page load times) time for the affected media sites rose to 14.4 seconds compared with 8.03 seconds in February.
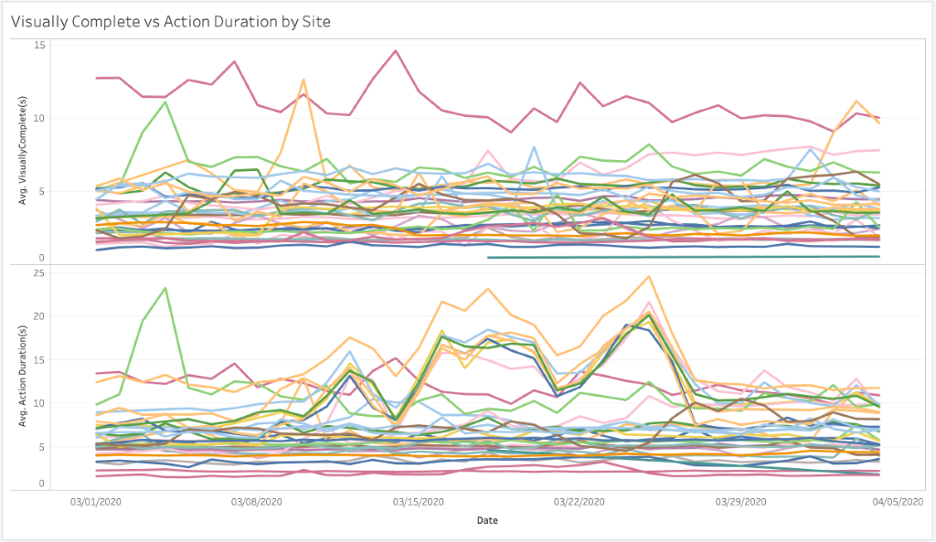
This doesn’t impact the general public, as they can still get the information they need. However, these media providers will eventually want to verify their third-party advertising partners are still meeting their Service Level Agreements (SLAs). If ad content isn’t loading, this could result in lost dollars.
Furthermore, if ad partners are consistently falling short of the expected uptime and performance thresholds laid out in their SLAs, it could null their contract with the media outlet.
Retail performance
Despite a significant spike in demand, overall, service performance in the retail sector has been stable, as the dashboard below shows.
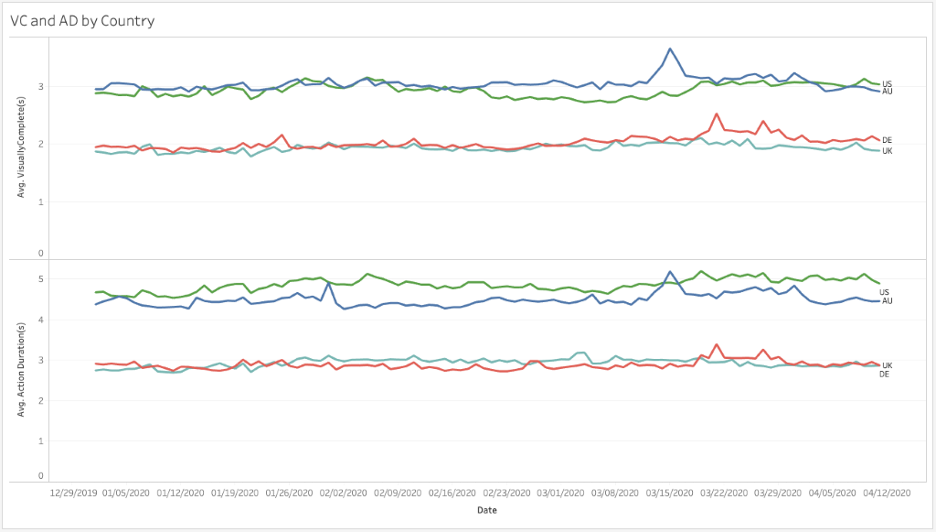
Retail site performance was impacted more by last year’s holiday shopping season than by the current crisis.
However, what this data does not show is where user experience could have been impacted by more drastic measures that some retailers have been forced to take, such as the use of queuing systems by some grocery retailers, or some non-essential retailers temporarily halting online operations due to physical logistics challenges arising from the lockdown.
Despite the general industry trend towards stability, there were some isolated sites that experienced slower than average response times due to server-side issues.
For example, for roughly four weeks, one retailer’s site experienced slow performance times for several key metrics including Visually Complete, Action Duration, Time to First Byte and Speed index.
As the dashboard below shows, these spikes coincided with business hours on weekdays, with performance improving on the weekends. This indicates that these issues could be due to high weekday traffic.
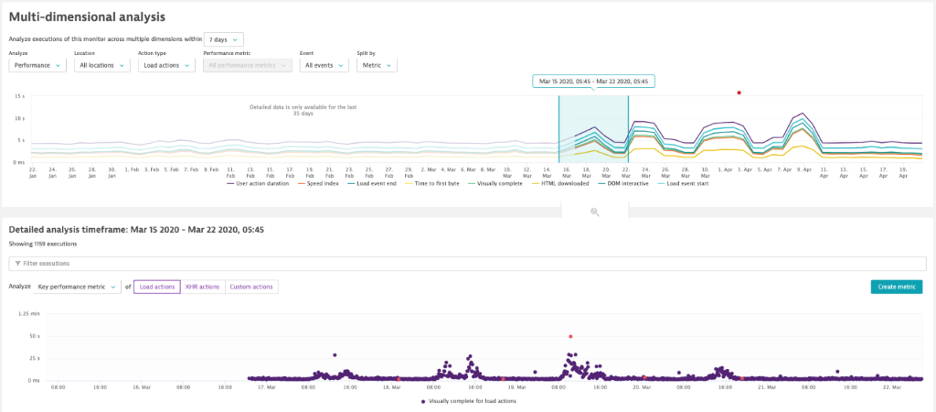
However, while there was a slight decrease in performance, this did not affect site availability, which remained at 99% throughout the affected period.
Recurring patterns and challenges
Beyond these industry-specific incidents, based on our experience working with customers to maintain user experience throughout the COVID-19 crisis, we’ve seen several key recurring trends that are impacting performance.
The most common slowdown issues we’ve encountered have been related to overloaded infrastructure. Other common factors include improperly configured database requests causing server-side slowdowns, and an increase in JavaScript errors, which are causing issues on the client browser side.
Although these problems would ordinarily lead to performance slowdowns, they have been magnified and amplified by the heightened peaks in demand that organizations are experiencing in the current crisis.
We will continue to keep watch
BizDevOps resources are strained, but they are also resilient. Given the increased amount of traffic, we could have expected worse performance and availability from many of these sites. Thanks to the hard work of many people behind the scenes, these sites continue to provide people with valuable information and services to help them during COVID-19 without incurring serious service disruptions due to higher traffic.
If you are running critical applications and infrastructure, please feel free to contact us. We are offering free use of the Dynatrace Software Intelligence Platform through June 19, 2020, and free SaaS Vendor Real User Monitoring, which is what I use to monitor many of the above services, until September 19, 2020.
All the while, the teams here at Dynatrace will keep watch.


Looking for answers?
Start a new discussion or ask for help in our Q&A forum.
Go to forum