
On the product security team here at Dynatrace, we use Snyk and our own platform as our go-to tools to gain visibility into the security state of our software. Snyk detects vulnerabilities while code is being developed, while Dynatrace runtime vulnerability analysis (RVA) provides operational visibility at runtime. RVA covers all the running software that makes up our production deployment to ensure the confidentiality, integrity, and availability of the Dynatrace platform. So, how do we use the two most effectively to keep our environments secure?
In this blog, we’ll discuss the steps we’ve taken to use the newly published Snyk Integration for Dynatrace to create actionable Jira tickets for our engineers. We’ll also share how we are matching the results of Snyk’s Source Composition Analysis (SCA) to Dynatrace’s Runtime Vulnerability Analytics (RVA) results, and outline what lies ahead.
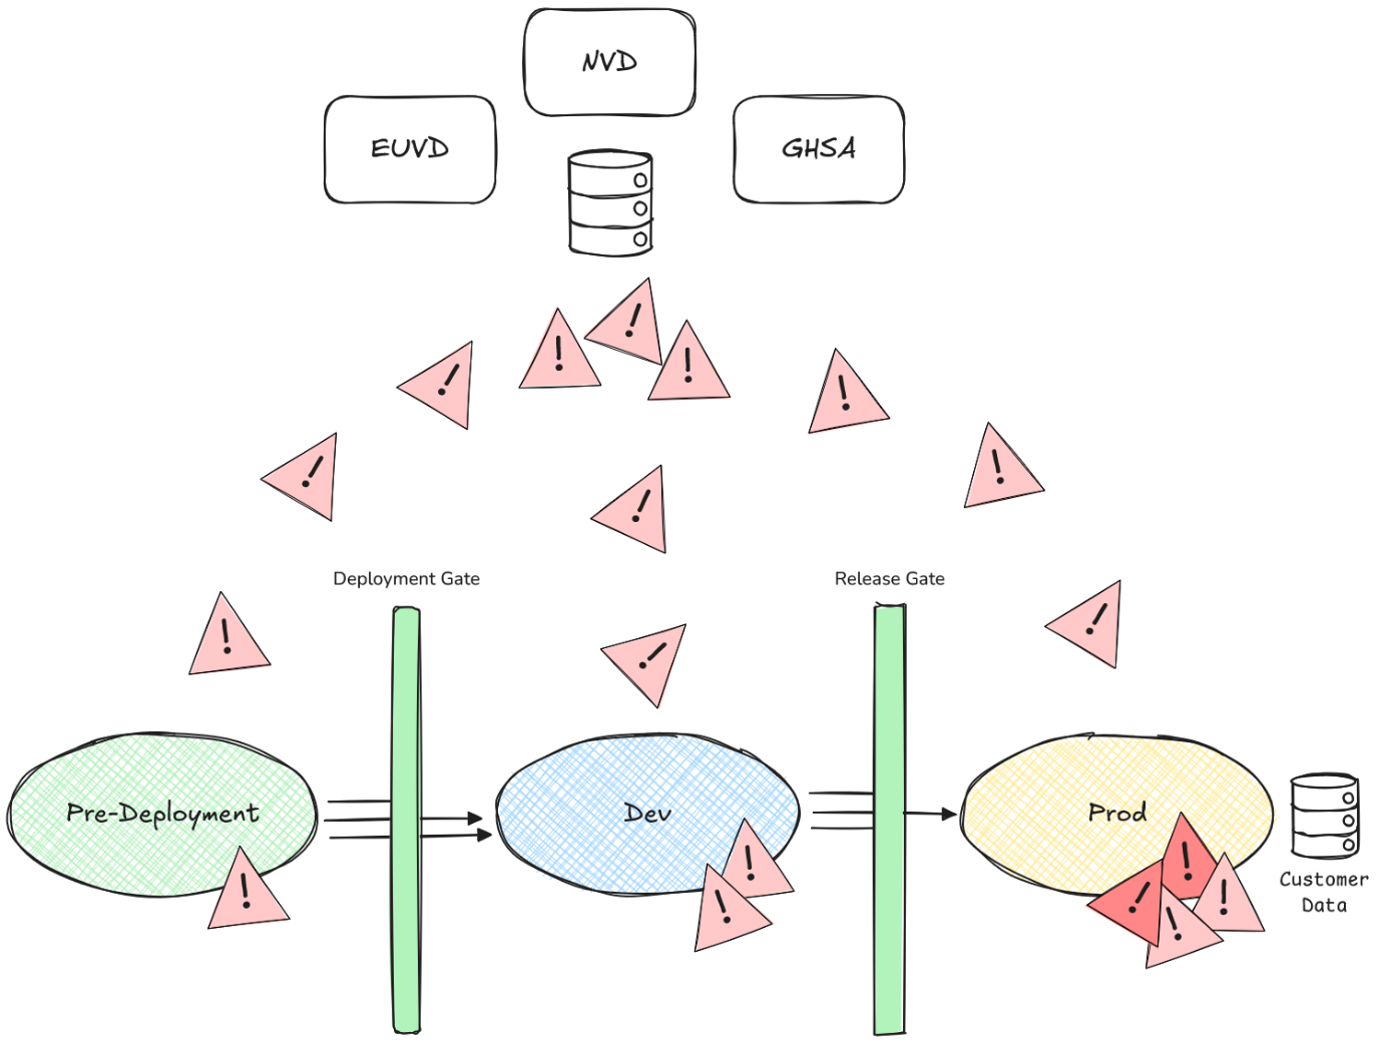
Why do so many vulnerabilities land in prod?
Most vulnerable open-source components do not propagate through the stages, but rather become vulnerable on production.
Generally, new vulnerabilities in both open and closed-source software are continuously discovered and disclosed by a broad community of security researchers. As a result, the number of reported vulnerabilities continues to grow year over year. Nearly 40,000 new CVEs were issued in the past 12 months, making this a key focus area for our internal security practices.
According to internal data for the software our team builds and runs, we have matched approximately 1,600 of these newly disclosed vulnerabilities to the open-source components used in our organization. Multiplied by the number of affected projects, this resulted in over a hundred thousand findings. Put simply, newly disclosed vulnerabilities amounted to over 97% of new findings.
No matter how much release-gating and pre-deployment scanning we do, the main parts of our software will eventually “become vulnerable” on production.
Because our team is responsible for detecting and distributing security findings, we need to address the large overlap between the findings that Open Source scanning by Snyk and Runtime Vulnerability Analysis by Dynatrace will detect for a service that is being monitored by Snyk at build time and by Dynatrace in our production environment.
Static scanning vs. dynamic scanning
Snyk’s static scanner re-scans dependencies every 24 hours and provides detailed insights into how and where vulnerable components are included in the build process of a project. Dynatrace RVA’s dynamic scanner, on the other hand, reports newly disclosed findings in a matter of minutes and is able to include the context of a running application to calculate the Davis Security Score, which represents a more accurate depiction of risk including the environment that a service is deployed in. Dynatrace also shows us if a vulnerable function is executed in our running deployments which heavily influences the required urgency. This makes it a very valuable data source for us in comparison with the more static CVSS scoring that findings in Snyk are typically rated with.
While both scan results have their strengths, bombarding engineers with duplicate notifications for essentially the same findings consumes unnecessary resources, interrupts focus time, and creates frustration.
This is why we needed to investigate matching results of Dynatrace RVA and Snyk, combining the results while fixing some of our long-known issues with the noisiness of native Snyk alerting. Here’s how we did it and how you can set it up for your team.
Reducing security alert fatigue
Last year, we conducted an internal survey to understand how and where our engineers are using Snyk, and what improvements they wish to see. A major concern highlighted was the notification system for issues detected by Snyk. Our engineers complained about notifications being hard to configure and being sent on an abstraction level that was either too high or too low to be usable for them. Also, our teams prefer acting on notifications in Jira since it’s already an integral part of their daily workflows.
Challenges
With these insights, our goal was clear: we wanted to implement automatic Jira ticket creation for security issues found by Snyk. But there were some major roadblocks.
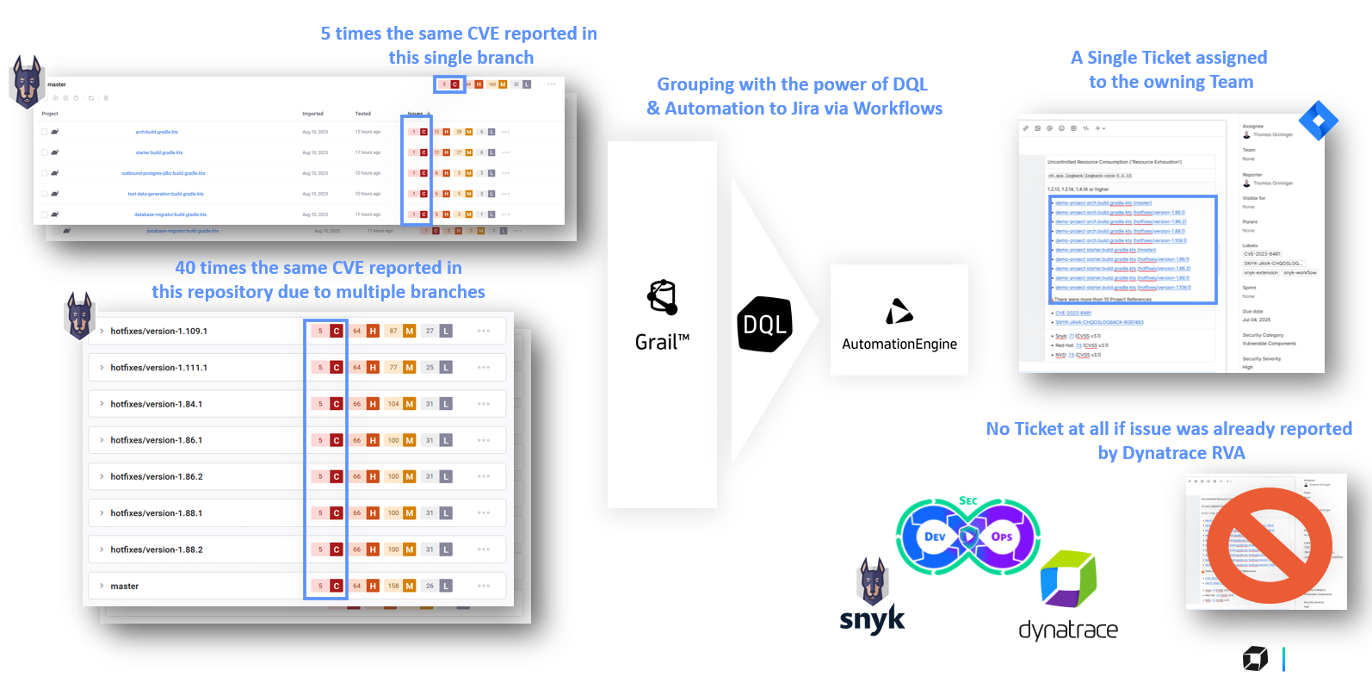
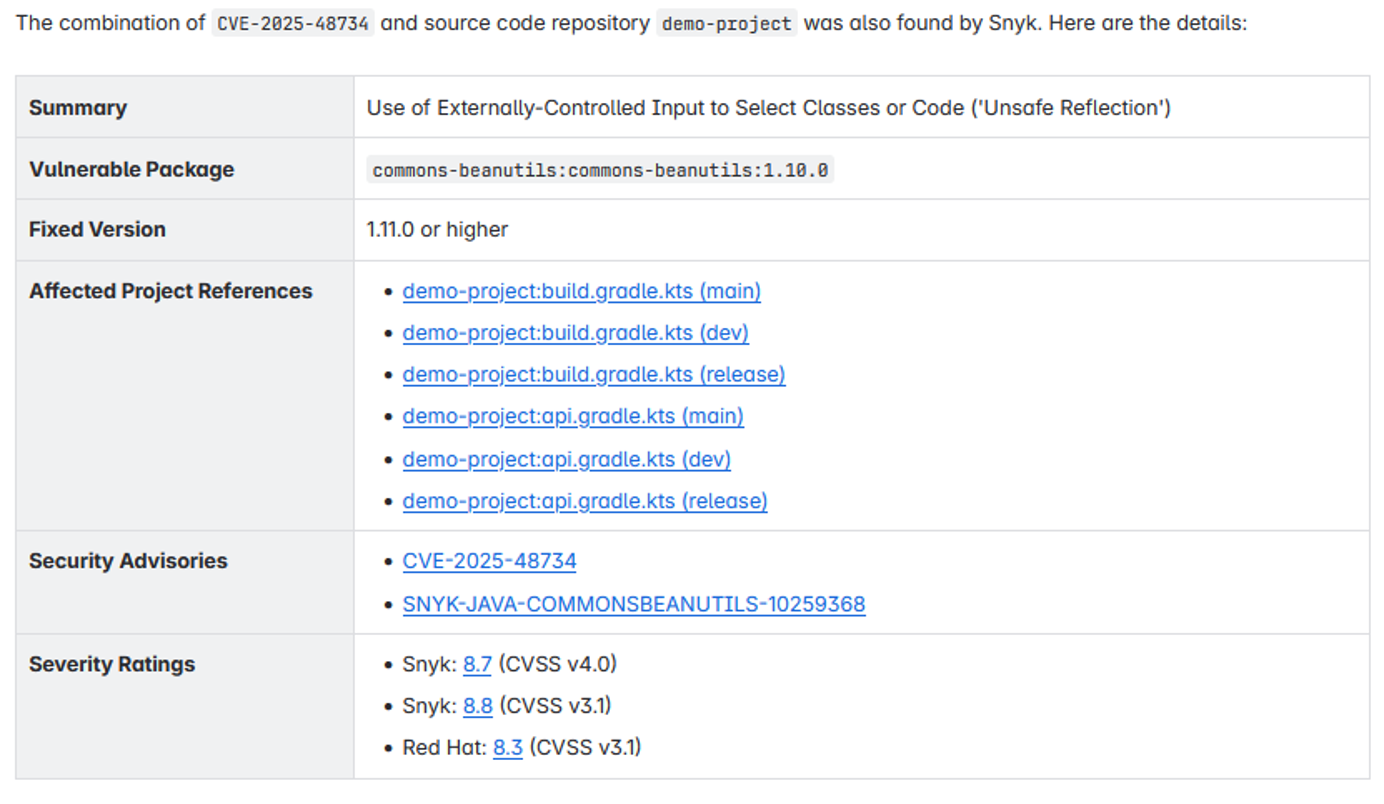
- Notifications & duplicate findings. Snyk’s native notifications are tightly coupled to the way it interprets a project and therefore an issue. Snyk creates a separate project for every single configuration file scanned with Snyk Infrastructure as Code (IaC) and every Gradle sub-project for Snyk Open Source (OS). This leads to a lot of duplication for findings that often require a single remediation action in the source code.
- In some cases, a single vulnerable component included in a repository resulted in over 40 new issues (and therefore 40 Slack notifications or action items as reported by Snyk’s native integration with Jira).
- Overlap with Dynatrace detections. We needed to find a way to match Snyk findings to Dynatrace RVA findings and prevent teams from being spammed with two tickets for every finding. Especially in the case of vulnerable components, this can become frustrating, with a project being flagged at build time by Snyk and at runtime by Dynatrace RVA.
The foundation of the Dynatrace and Snyk integration
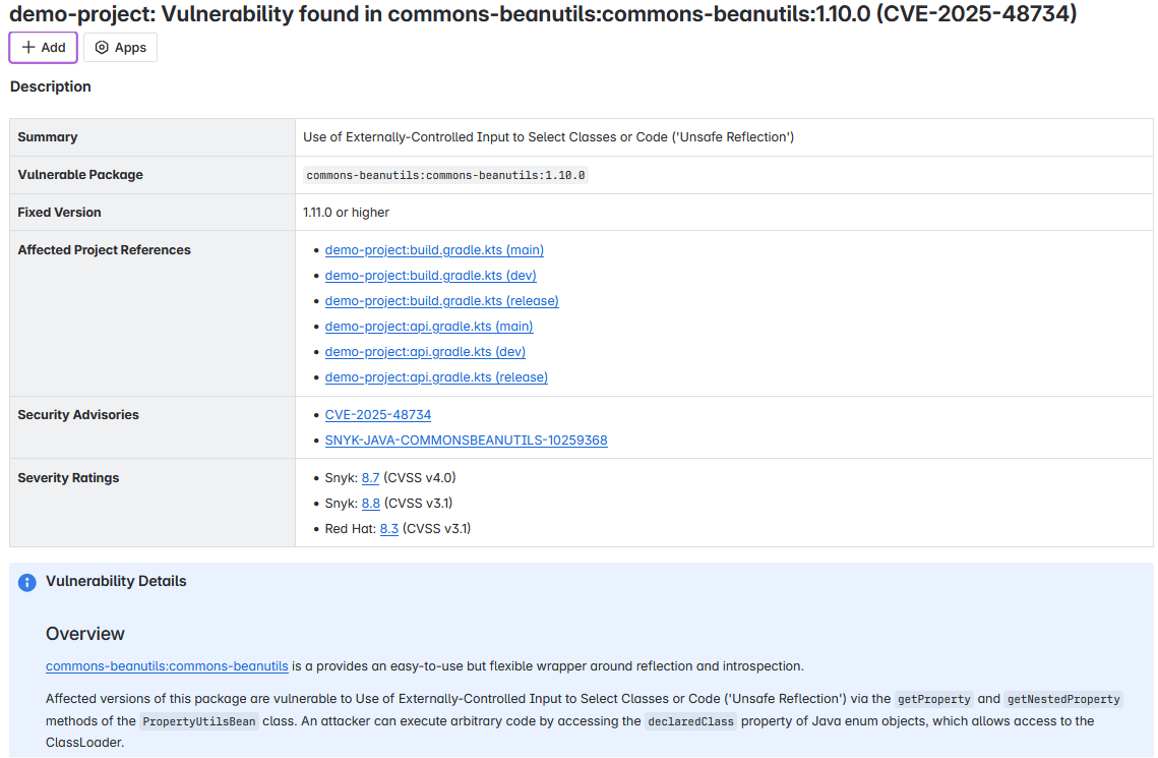
We wanted more flexibility and to redefine what an “issue” is in our alerting context. Instead of reporting a vulnerable component finding (such as how Snyk defines it per file or Gradle sub-project), we just wanted to see the finding once on a source code repository. To make that happen, we needed a less rigid way of working with the data.
This is where the Dynatrace – Snyk extension comes in handy. This extension allows us to synchronize all our Snyk findings to our Dynatrace environment without a single line of code.
The Snyk findings persist as Security Events in Grail, which gives us all the power of DQL to transform into the views that we need. To reduce our example of 40 different issues (as detected by Snyk) into a single issue for a source-code repository, we can do a quick “summarize” call with DQL while grouping on the Snyk target.
fetch events

| filter dt.system.bucket == "default_security_custom_events"

    AND event.kind == "SECURITY_EVENT"

    AND event.provider=="Snyk"

    AND event.type=="VULNERABILITY_FINDING"


// take the most recent findings

| dedup snyk.issue.id, sort:{timestamp desc}

// group by target name and vulnerability id

| summarize {references = collectArray(record(project=snyk.project.name, branch=snyk.target.reference))},

    by:{snyk.target.name, vulnerability.id}
Putting this simple query in a Notebook already shows us a reduction of alerts by 80% compared to the issues we see in our Snyk environment!
Automated Jira ticket creation
We did not want to stop at Notebooks. Instead, we wanted to go the extra mile and create actionable Jira tickets for engineers without any manual intervention slowing down the distribution process and tying down resources.
This is where Dynatrace Workflows enter the picture. They allow us to easily put together simple automations that (either periodically or event-based) can trigger actions such as querying Jira for existing tickets and creating tickets based on certain criteria.
Our setup uses two workflows. The first periodically queries Security Events on Grail using a similar DQL query as depicted above to group the Snyk issues into the representation we want to have. After this query, we loop over a second workflow that receives each record as an input, resolves the owning team, and creates a Jira ticket.
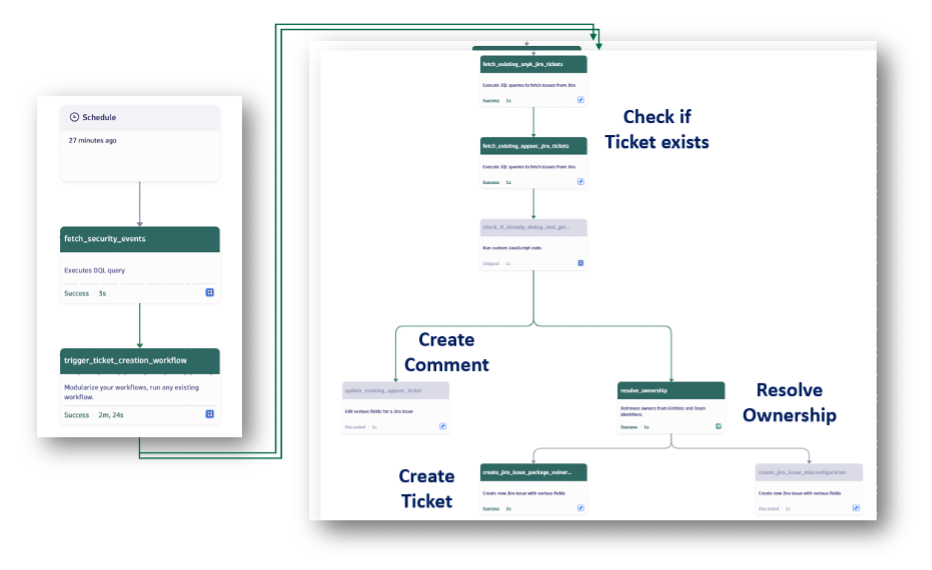
To ensure we are not creating tickets for already-reported findings, we depend on the help of the Jira labels. We search if there is an existing ticket with the labels: CVE, Snyk Issue ID, and Snyk Target (usually the source code repository).
If we do not find an existing Jira issue for a new Snyk finding with the same combination of labels, we create a new ticket.
To derive the correct Jira project and assignee, we use the Dynatrace Ownership feature and the get_owners action. We can supply it with an owner identifier and Dynatrace resolves it against the stored ownership metadata. This fully automates the distribution of the created tickets directly to the responsible teams.
This simple combination of querying and grouping with DQL and then feeding into a workflow allowed us to get rid of about 80% of our alerts and create a single automatic Jira ticket for a vulnerability in a source code repository.
But there came the next challenge. If the vulnerability was already reported by Dynatrace for the same project, we did not want to create a new Snyk ticket at all. That is where we needed a solution to match findings between Snyk and Dynatrace RVA.
Connecting development and runtime
Many might remember that the Dynatrace app security product team already explored this connection of pre-deployment and runtime observability two years ago with the DevSecOps-Lifecycle (DSOL) app. While this was a great step in the right direction, it fell short on some parts that are important to us.
The DSOL app builds upon matching container scan results of Snyk to hashes of container monitored with Dynatrace. Unfortunately for us, our Snyk scanning strategy mainly focuses on Snyk OpenSource scans instead of Container scans. This meant that we could not use container hashes to match the scan results.
This brought us to the following question: How can we consistently correlate a scan that operates on repository level to scan results of Dynatrace that operate on a running system without relying on container hash matching?
Correlation of Snyk and Dynatrace RVA tickets based on Source-Location
Snyk already provides the source repository for each project in the terminology of a target which we propagate already as labels on the Jira tickets we create. However, Dynatrace also needed to be made aware of how to connect a finding on a running process to the source location that houses its source-code.
To solve this, we added a Kubernetes annotation to our main deployment templates:
dynatrace.com/source-location: <SCM-URL>
This change was rolled out across many systems through automated template updates. Dynatrace picks up these annotations and makes them queryable via DQL, allowing us to attach the source location to every Dynatrace RVA ticket we generate.
With this setup we have a common identifier between tools which allows our workflows to detect if a vulnerability has already been reported by another scanner at a different stage of the project’s lifecycle. Instead of creating duplicate tickets, we simply comment on the existing one, adding metadata about the new occurrence.
By correlating a static scan performed at build time with a runtime scan during process execution, we can leverage the strengths of both approaches without being overwhelmed by the noise of overlapping findings.
Snyk provides repository-level analysis, offering teams precise insights into how a vulnerable component is introduced into their project and where fixes need to be applied. Dynatrace RVA, on the other hand, contextualizes these findings by identifying whether a vulnerable function is invoked at runtime and whether the deployment environment influences the real-world risk.
Together, these insights play a crucial role in effective prioritization, equipping our engineers with the tools they need to assess and remediate vulnerabilities as efficiently as possible.
The outcome: Minimal alerts with maximal impact
This initiative highlighted two key strengths of the Dynatrace platform for us.
- Dynatrace is a powerful general-purpose analysis and automation platform. It helped us significantly reduce noise and prevent alert fatigue among engineers. While our focus was on integrating with Snyk, the underlying approach is broadly applicable to other external systems that are hard to align with organizational requirements.
- Dynatrace excels at providing precise runtime insights. In the realm of open-source vulnerability management, different scanners offer unique strengths, where Snyk prevails with scanning close to the developer with features such as IDE integrations, Dynatrace shines through tracking executed functions and the actual environmental context.
However, overlaps between scanners are common and can lead to frustrating experiences for engineers. To bridge this gap, we enrich Dynatrace runtime data with additional context using custom metadata, Kubernetes annotations, or OCI annotations on container images. This metadata also supports broader use cases like ownership tracking or cost management.
By embedding this context into our runtime monitoring, we can map complex production environments back to organizational structures and connect events across diverse systems.
What silos can we break next?
While we have built our solution a bit ad hoc, there are very interesting possibilities emerging in the Dynatrace platform of referring to source code and integrating it with running processes.
One of those was released recently with the Dynatrace Live Debugger and its ability to load source code from a configured repository and debugging applications in production in a non-breaking manner.
Similarly, some of our Dynatrace power users shared how repository information and commit hashes allow them to trace certain increments across environments, automate health gates, and alert on potential service degradations.
All these developments show how the Dynatrace platform is in the best position to enable true end-to-end observability from when code is committed to when it is processing millions of requests in production. And this breaking up of silos is what is needed in truly modern environments.


Looking for answers?
Start a new discussion or ask for help in our Q&A forum.
Go to forum