
Understanding user authentication patterns and security events is critical for maintaining robust application security. Auth0, a leader in identity management, is a secure and customizable identity platform that simplifies authentication and authorization for applications of any scale. Auth0 generates rich logs detailing every authentication event. Meanwhile, Dynatrace provides powerful observability across your entire technology stack. Auth0 monitoring with the Dynatrace observability and security platform enables organizations to gain unprecedented insights into authentication behaviors, security anomalies, and the relationship between identity events and application performance.
This blog explores how to implement the power of Auth0 monitoring, the benefits it provides, and real-world examples of how it enhances your security posture and user experience monitoring.
Why monitor Auth0 with Dynatrace?
Auth0 logs capture detailed information about authentication events, including:
- Login successes and failures
- Password changes and reset requests
- Multi-factor authentication events
- Permission and access changes
- Anomalous security events
- API token usage
- User management operations
While the Auth0 dashboard provides basic log viewing capabilities, integrating these logs with the advanced analytics of the Dynatrace platform offers several significant advantages:
- End-to-end observability. Connect authentication events with application performance metrics, infrastructure health, and user experience data.
- Advanced visualization. Create comprehensive dashboards showing authentication patterns alongside other system metrics.
- Proactive alerting. Set up intelligent alerts based on complex combinations of authentication and application metrics.
- Security monitoring. Quickly identify suspicious login patterns or authentication failures.
- Compliance requirements. Generate comprehensive audit trails to meet regulatory compliance requirements.
Ingesting Auth0 logs into Dynatrace
Before you begin, ensure you have the following:
- An active Auth0 account with admin access
- A Dynatrace environment with appropriate permissions
- API access to both platforms
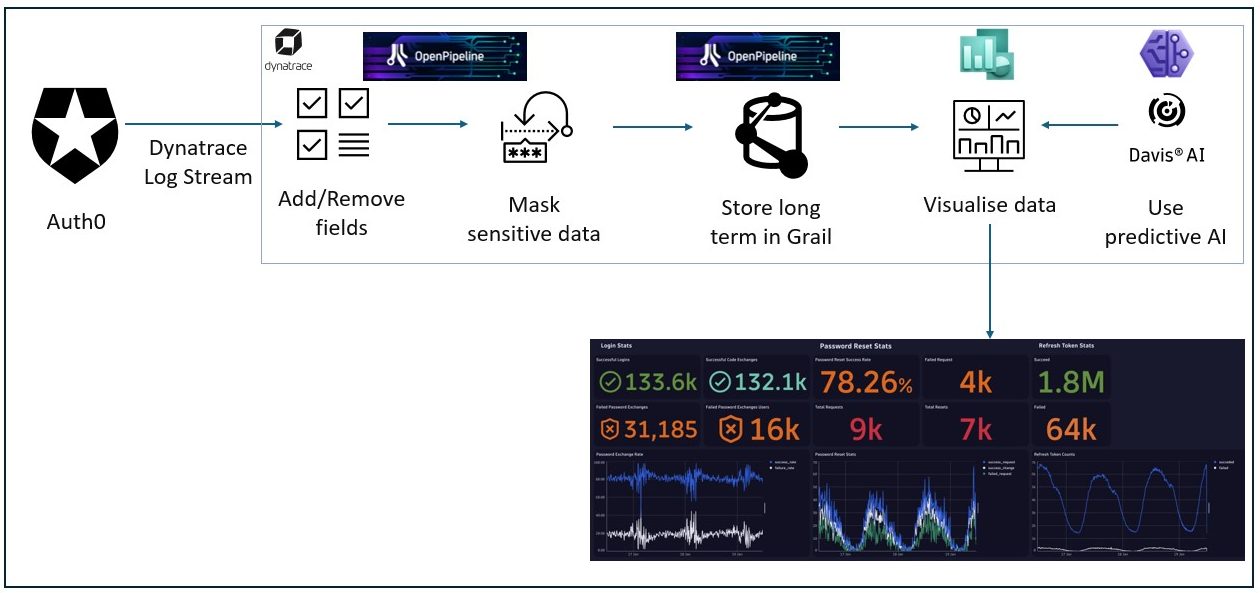
First, we’ll set up the data extraction, then transform and enrich the data with Dynatrace OpenPipeline™, and finally, the analytics part, set up dashboards and engage Davis AI.
Data extraction
Auth0 provides multiple ways to export logs. For Dynatrace integration, use the Auth0 Event Stream capability. For detailed step-by-step instructions, see Dynatrace Log Streaming on the Auth0 Marketplace. Authentication for ingesting logs and connecting to the correct tenant are key to integrating the data. If the extracted data contains personally identifiable information (PII), you can perform the data extraction in a pre-production environment.
Data transformation
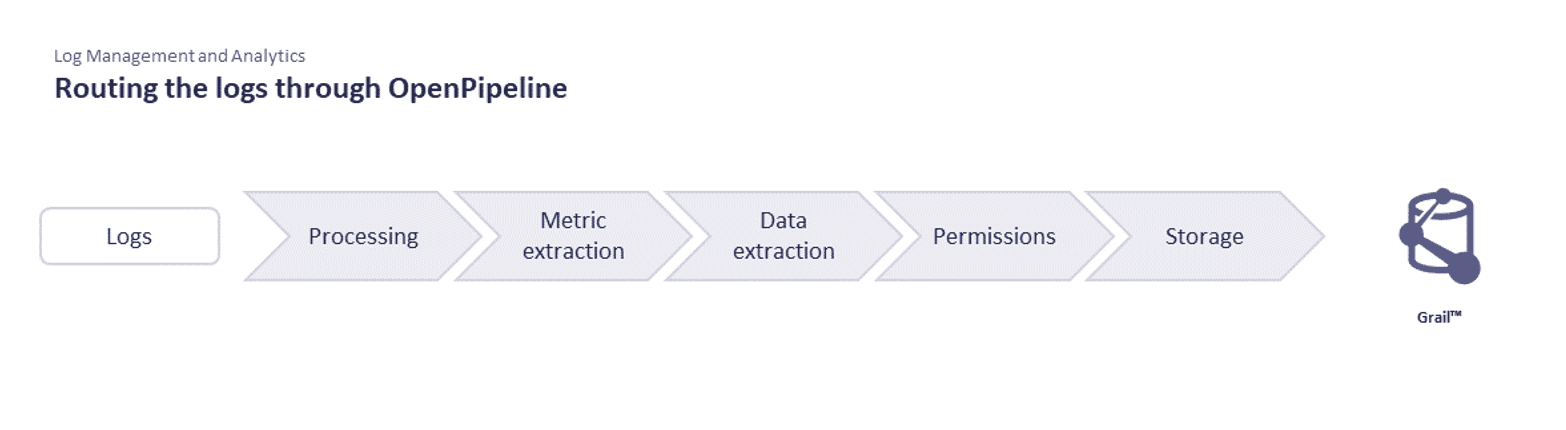
Once ingested, Dynatrace OpenPipeline, a unified, high-scale stream-processing technology, automatically contextualizes incoming data and enriches signals by adding metadata and links to other relevant data signals. In addition, OpenPipeline ingests and processes data securely and compliantly.
For this Auth0 example, we set up a new log pipeline and added the following three OpenPipeline processing steps:
- Set log level and status for ingested logs
- Mask and replace pattern
- Route incoming log data to a separate bucket
We provide sample snippets below that you can add to your own pipeline.
Set log level and status for ingested Auth0 logs
First, let’s add the log level and status for the ingested Auth0 log signals using Dynatrace OpenPipeline processing instructions (processors) expressed in the Dynatrace Query Language (DQL).
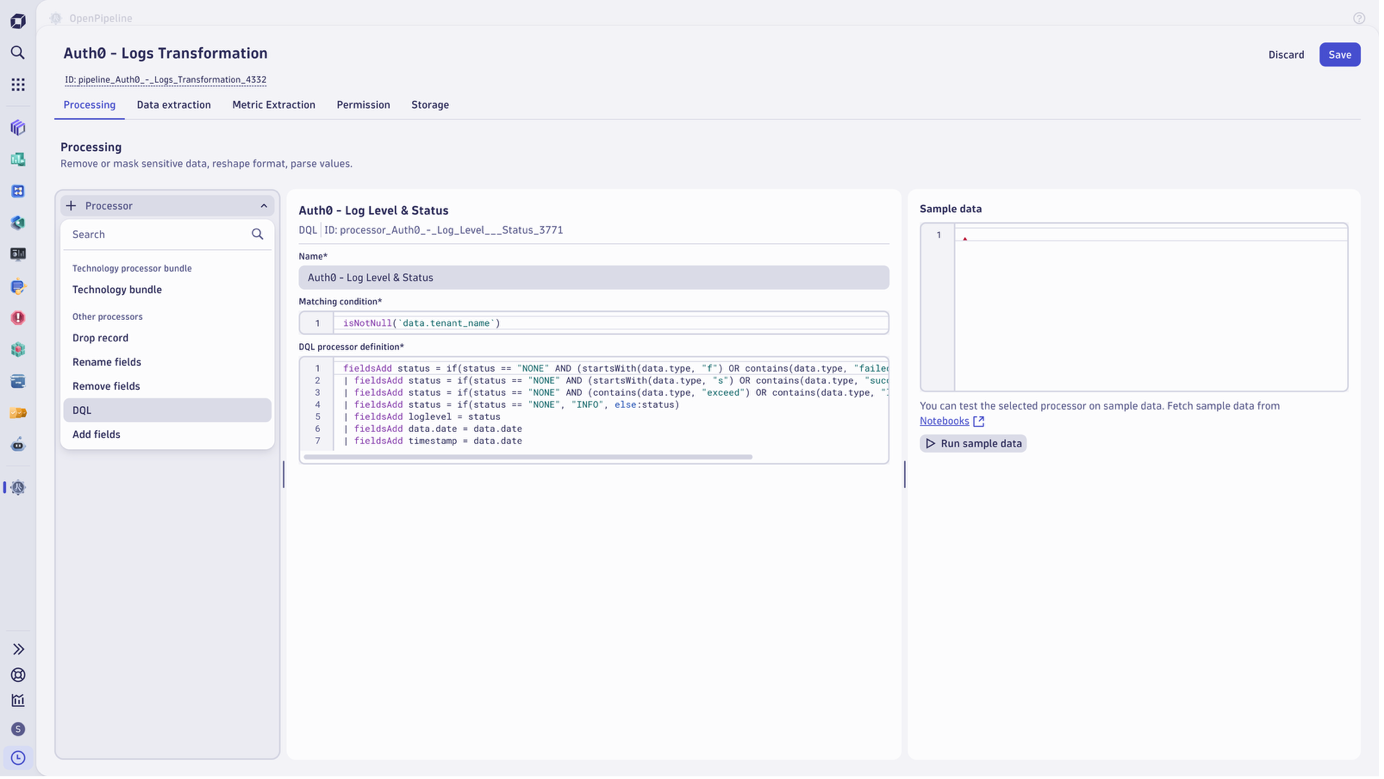
fieldsAdd status = if(status == "NONE" AND (startsWith(data.type, "f") OR contains(data.type, "failed")), "ERROR", else:status)
| fieldsAdd status = if(status == "NONE" AND (startsWith(data.type, "s") OR contains(data.type, "succeed")), "INFO", else:status)
| fieldsAdd status = if(status == "NONE" AND (contains(data.type, "exceed") OR contains(data.type, "limit")), "WARN", else:status)
| fieldsAdd status = if(status == "NONE", "INFO", else:status)
| fieldsAdd loglevel = status
| fieldsAdd data.date = data.date
| fieldsAdd timestamp = data.date
Masking and replacing pattern
Dynatrace applies this masking pattern to data from specific geographic regions, which can vary based on area codes. When using the example code below, add a DQL processor, paste the example code, and alter it based on your individual content.
parse content, "LD ([a-zA-Z0-9.!#$%&*+-/=?^_{|}~]+ '@' LD '.' ALNUM'.'? ALNUM?):email"
| parse data.user_name, "LD:email"
| fieldsAdd content = replacePattern(content, "([a-zA-Z0-9.!#$%&*+-/=?^_{|}~]+ '@' LD '.' ALNUM'.'? ALNUM?)", hashMd5(email))
| fieldsAdd data.user_name = replacePattern(data.user_name, "LD:email", hashMd5(email))
|fieldsRemove email
Routing incoming log data to a separate bucket
Log data in Dynatrace can be stored in different buckets for addressing security, compliance, or performance objectives. The sensitivity of Auth0 data calls for storing its logs in a dedicated bucket with long term retention and access rights limited to tightly restricted admin users.
Log analytics and insights
Once the data is stored in Dynatrace, we can start analyzing data.
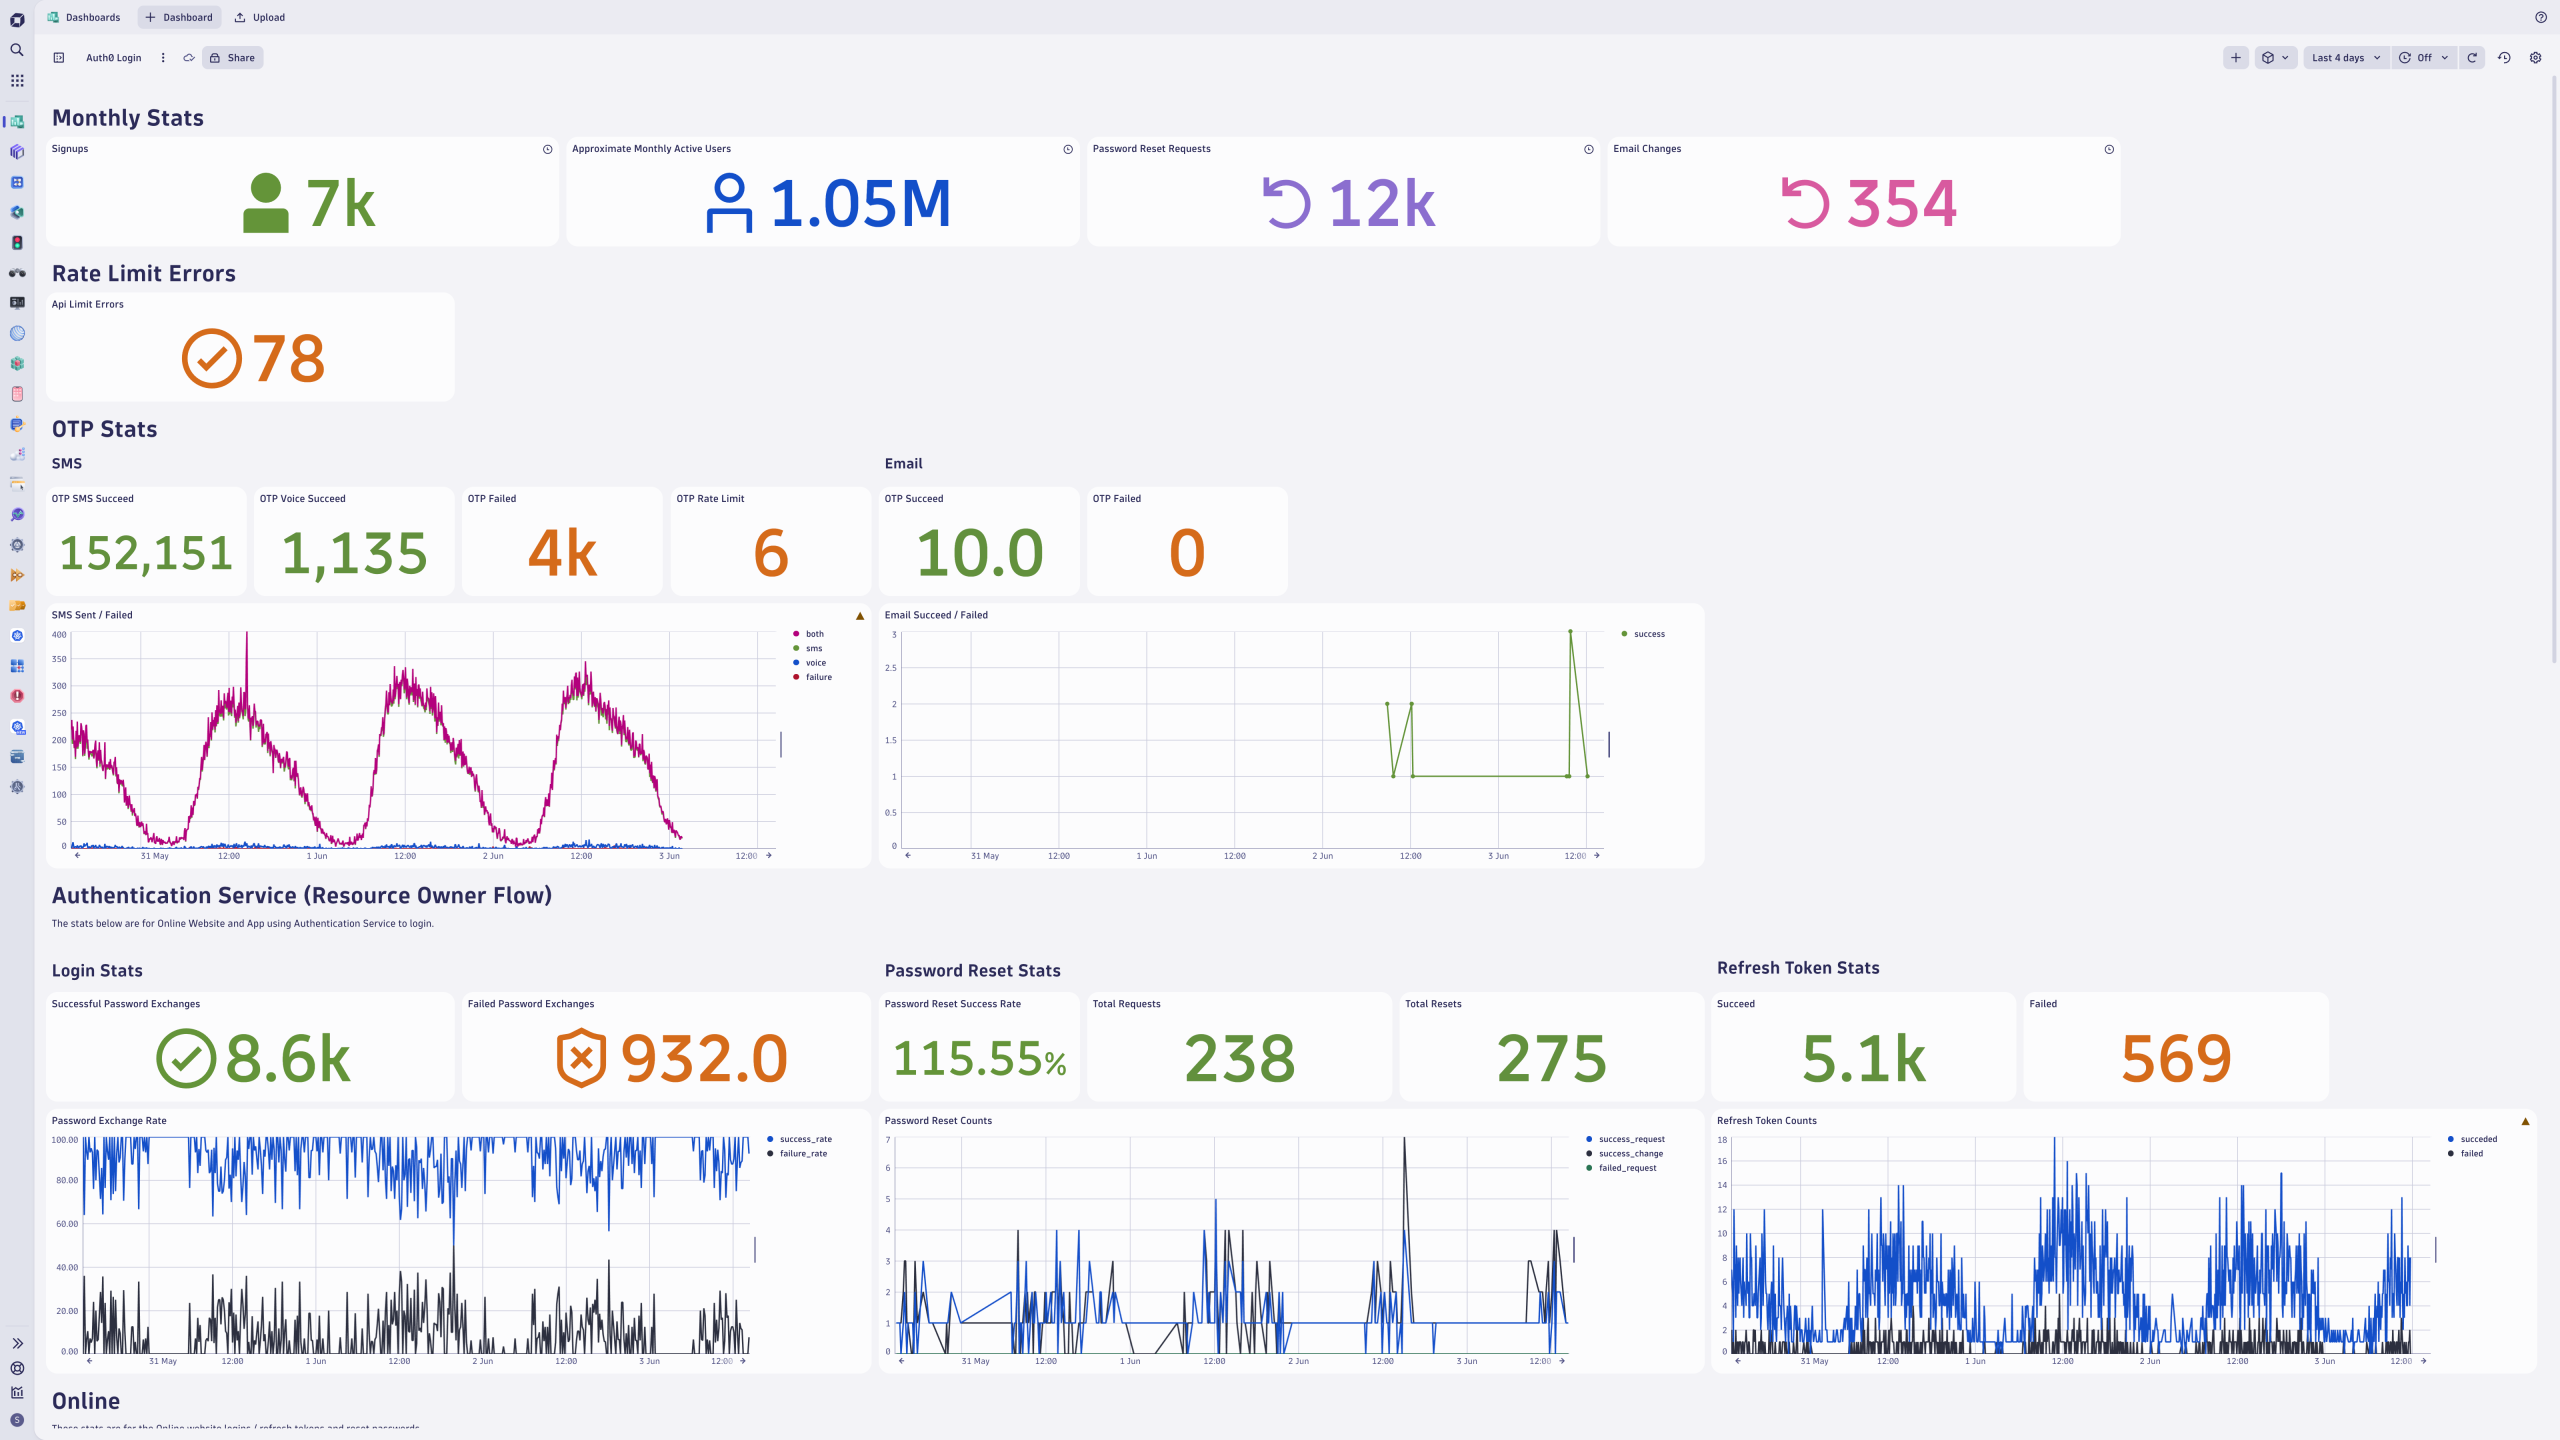
First, let’s create a dashboard for simple visual data exploration purposes. It’s very straightforward to create your own dashboard—you can either use the built-in explore data interface, translate natural language prompts into DQL statements using the Dynatrace natural language AI assistant, Davis CoPilot™, or create the DQL statement on your own.
In the second step, we remove and mask sensitive data to address compliance and privacy requirements. You can learn more about applying sensitive data masking on capture using either Dynatrace OneAgent® or OpenTelemetry. As an alternative, you can also use field-level permissions to apply data masking on read.
Once this is done, we can concentrate on visualizing data. Dynatrace dashboards provide the flexibility to view data with any required dimensions.
By using the detailed information captured by Auth0, you can easily identify system health and spot user behavior trends. For example, you can track trends for the following use cases:
- Login successes and failures
- Password changes and reset requests
- Multi-factor authentication events
- Permission and access changes
- Anomalous security events
- API token usage
- User management operations
Using Davis AI for advanced anomaly detection and forecasting
Davis AI can identify anomalies in data and predict future trends. While anomaly detection ensures that administrators will be notified once a metric is no longer operating within its boundaries, forecasting is used to predict the future based on historic values.
Davis AI is fully integrated in Dashboards. To learn how to add your own anomaly detectors or set-up forecasting, see the blog Better dashboarding with Dynatrace Davis AI.
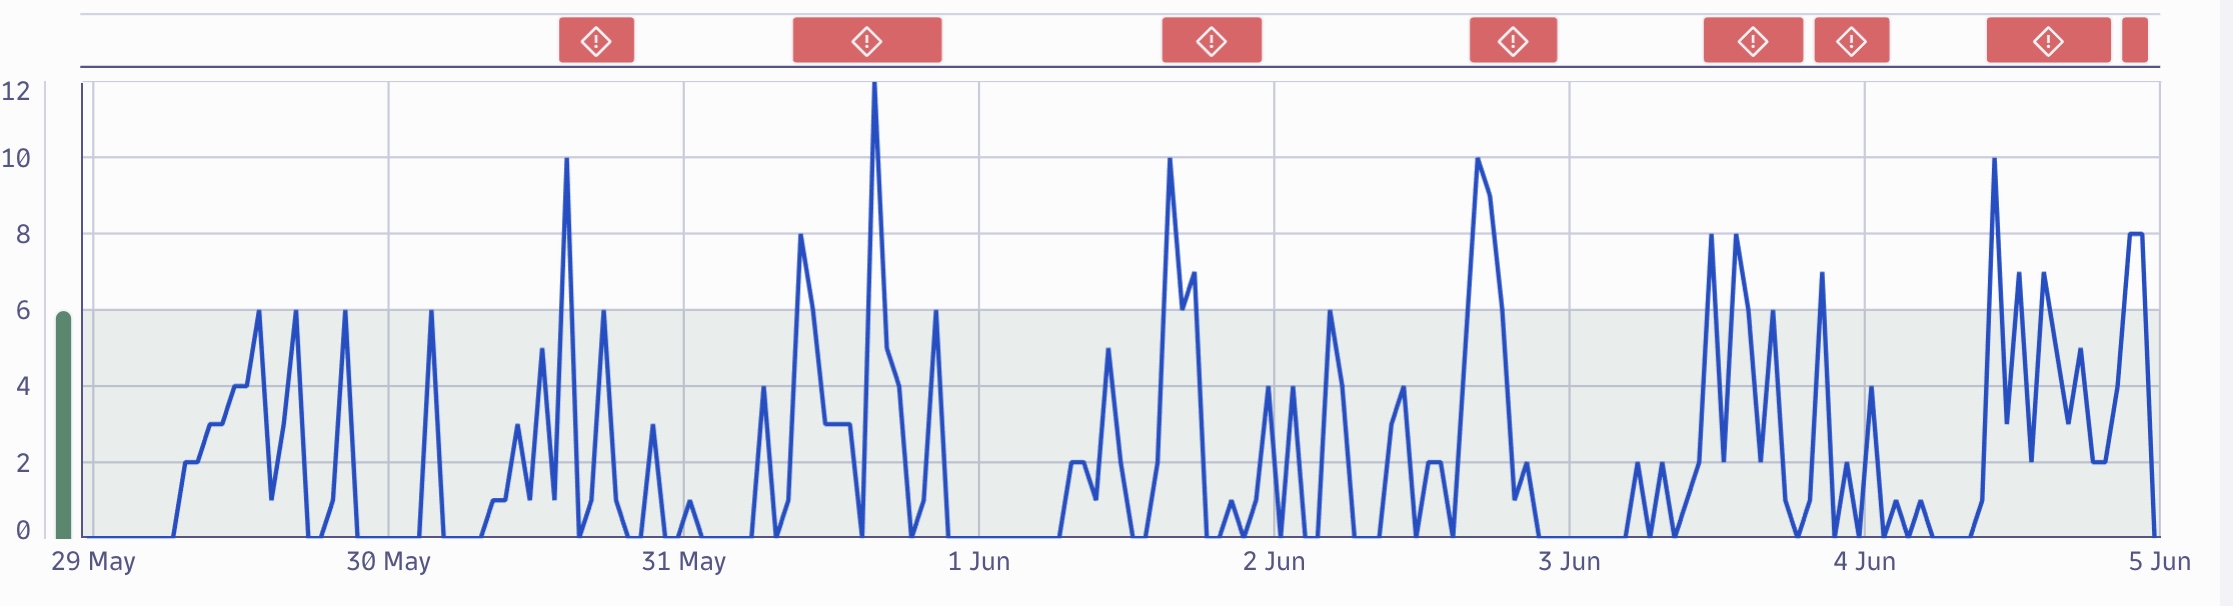
Alerting incorporated in dashboard
The following example chart shows the number of times the failed SMS count has breached the auto adaptive threshold. These conditions can generate an alert and notifications via Slack or email as required.
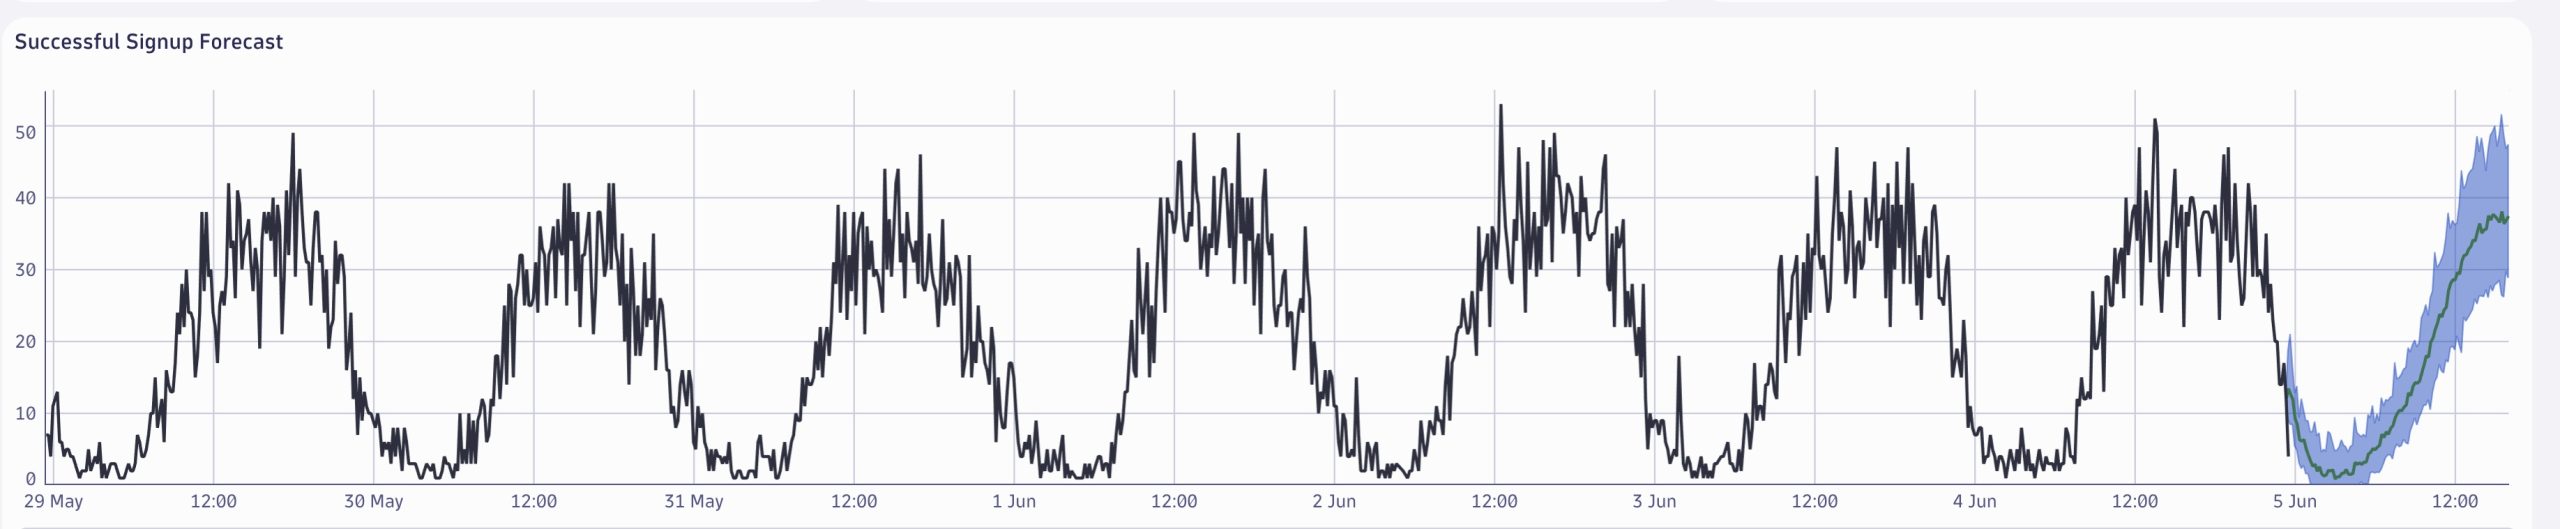
Predicting the number of sign-ups
Davis AI forecast analysis predicts future numeric values of any time series. It can even process external datasets or the results of any data query if it can be displayed as a numeric time series, such as occurrences over time.
Advanced use cases for Auth0 monitoring
Once you have Auth0 data in the Dynatrace platform, you can do some advanced analytics.
Correlating authentication events with application performance
One of the most powerful aspects of this Auth0 monitoring integration is the ability to see how authentication processes impact overall application performance. For example:
- Create a custom dashboard showing login response times alongside application load metrics.
- Set up alerts when authentication response times exceed thresholds.
- Analyze how authentication traffic spikes affect backend services.
Security anomaly detection
Configure Davis AI to detect unusual authentication patterns:
- Sudden increases in failed login attempts
- Authentication attempts from unusual locations
- Password reset patterns that deviate from normal behaviour
- Unusual activity on dormant accounts
User behavior analytics
Combine Auth0 logs with Dynatrace Real User Monitoring to create comprehensive user behavior profiles:
- Typical login times and locations for specific user segments
- Authentication method preferences (password vs. social logins vs. SSO)
- Device and browser usage patterns during authentication
- User journey patterns following successful authentication
Auth0 monitoring best practices
Based on our experiences, we recommend applying the following best practices:
- Filter judiciously. Auth0 generates extensive logs; only send relevant events to Dynatrace.
- Respect PII. Be careful with personally identifiable information in logs; consider masking.
- Set appropriate retention. Configure log retention based on security requirements and compliance needs.
- Monitor integration health. Create monitoring for the integration itself to ensure log delivery.
- Start small. Begin with key authentication events before expanding to full log streaming.
Auth0 monitoring places authentication events in context
Integrating Auth0 logs with Dynatrace creates a powerful security and performance monitoring solution that bridges the gap between identity management and application observability. This integration enables organizations to:
- Detect security threats earlier through correlated analysis
- Optimize authentication flows based on performance data
- Understand the relationship between authentication and user experience
- Create comprehensive security analytics
- Streamline troubleshooting for authentication-related issues
In an era where digital identity is the cornerstone of security, having comprehensive observability of authentication events within your broader application monitoring strategy is invaluable. The Auth0-Dynatrace logs integration provides this critical capability, empowering organizations to enhance both security and user experience simultaneously.


Looking for answers?
Start a new discussion or ask for help in our Q&A forum.
Go to forum