
For most organizations, online service reliability that balances innovation and uptime is a primary goal. SLO monitoring and alerting on SLOs using error-budget burn rates are critical capabilities that can help organizations achieve that goal.
In the digital age, a company’s success depends on the reliability of its online services. To manage this crucial aspect, many companies adopt service level objectives (SLOs). SLOs are specifically processed metrics that help businesses balance breakthroughs with reliability. They help define how often and for how long services can afford to fail without severely impacting users. SLOs are pivotal for development, DevOps, and SRE teams because they provide a common language for discussing system reliability.
But just establishing SLOs isn’t enough. Without implementing robust SLO monitoring, anomaly detection, and alerting on SLOs, teams can miss issues that breach defined quality targets. Monitoring performance against these objectives using AI is where the true value lies, based on establishing error budgets and monitoring an error budget burn rate.
What is SLO monitoring? And what is an error budget burn rate?
SLO monitoring is an IT process that tracks microservices architecture health based on metrics that express specific performance targets.
An error budget is the acceptable number of errors or downtime a service can experience while still meeting its SLO, akin to a risk buffer.
An error budget burn rate is a measurement of how fast your service is using up its error budget.
This metrics-based approach to SLO monitoring helps organizations plan and adjust before problems escalate into outages.
Imagine your operations is a car, and the error budget is the tank of gas. An error budget burn rate is the rate at which your car consumes the gas. A high burn rate is a red flag indicating you may not meet your SLO of making it to the next exit, while a slow burn rate suggests you have room to take more risk and maybe go to the next town. An error budget encourages a healthy trade-off between innovation and reliability.
Why using error budget burn rates is important for SLO monitoring
Setting up alerts on SLOs using burn rates is an approach to anomaly detection that is valuable for several reasons:
- Sends alerts proactively: Alerting on SLOs using burn rate is based on how fast the service is consuming its error budget (the allowable threshold of errors within the SLO). When the error budget burn rate is too high, the system sends out alerts, helping teams to proactively address the issue before the SLO is violated (for example, you run out of gas).
- Provides granularity: Traditional threshold-based alerts on the SLO status might miss short but significant anomalies, whereas burn-rate metric alerts are more granular and can detect these.
- Reduces alert fatigue: By alerting only when the error budget burn rate is high, it reduces alert noise and helps prevent alert fatigue. Teams can focus on the most critical issues that might lead to an SLO breach.
- Improves decision making: By analyzing burn rates, teams can make better decisions about deploying new releases or initiating actions that could potentially affect the service reliability.
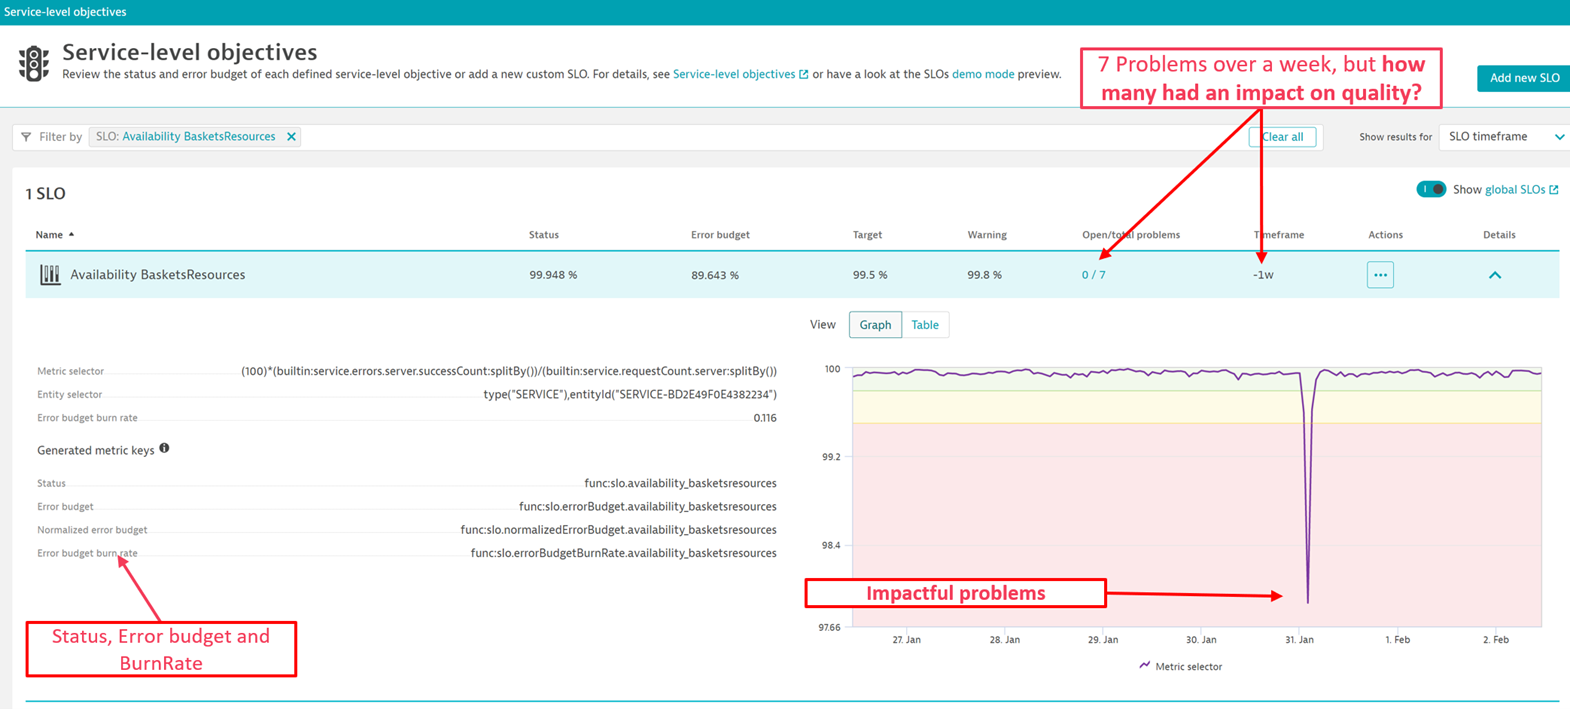
In the following example, the Dynatrace platform identifies seven problems with the service Availability BasketsResources in less than a week. It further identifies which problems had an impact on quality.
Using unified observability and causal AI for SLO monitoring and alerting on SLOs
The key to understanding precisely how services are delivering on their SLOs is having accurate, real-time intelligence and context about services and their dependencies. Most monitoring solutions and do-it-yourself setups simply correlate probabilities to estimate where things could be going wrong. Often, data comes from many individual point solutions, and teams must piece together evidence based on hunches and specialized knowledge. And because each solution measures the performance of various components using its own scale, teams often receive a flood of false positive alerts. As a result, teams waste time verifying which alerts matter instead of improving performance and maturing DevOps practices.
The Dynatrace approach brings all the data into a unified platform and converges SLOs with our causal AI engine, Davis®. Using real-time dependency mapping and fault-tree analysis, Davis AI determines the precise root cause of a problem in context, so it identifies problem areas before they become outages. This unified approach promptly alerts on the business-critical SLOs, which enables DevOps teams to manage service reliability without noisy false positive alerts. With fast alerts and the precision of Dynatrace Davis AI, teams gain immediate insight into the problem context and root causes affecting SLOs.
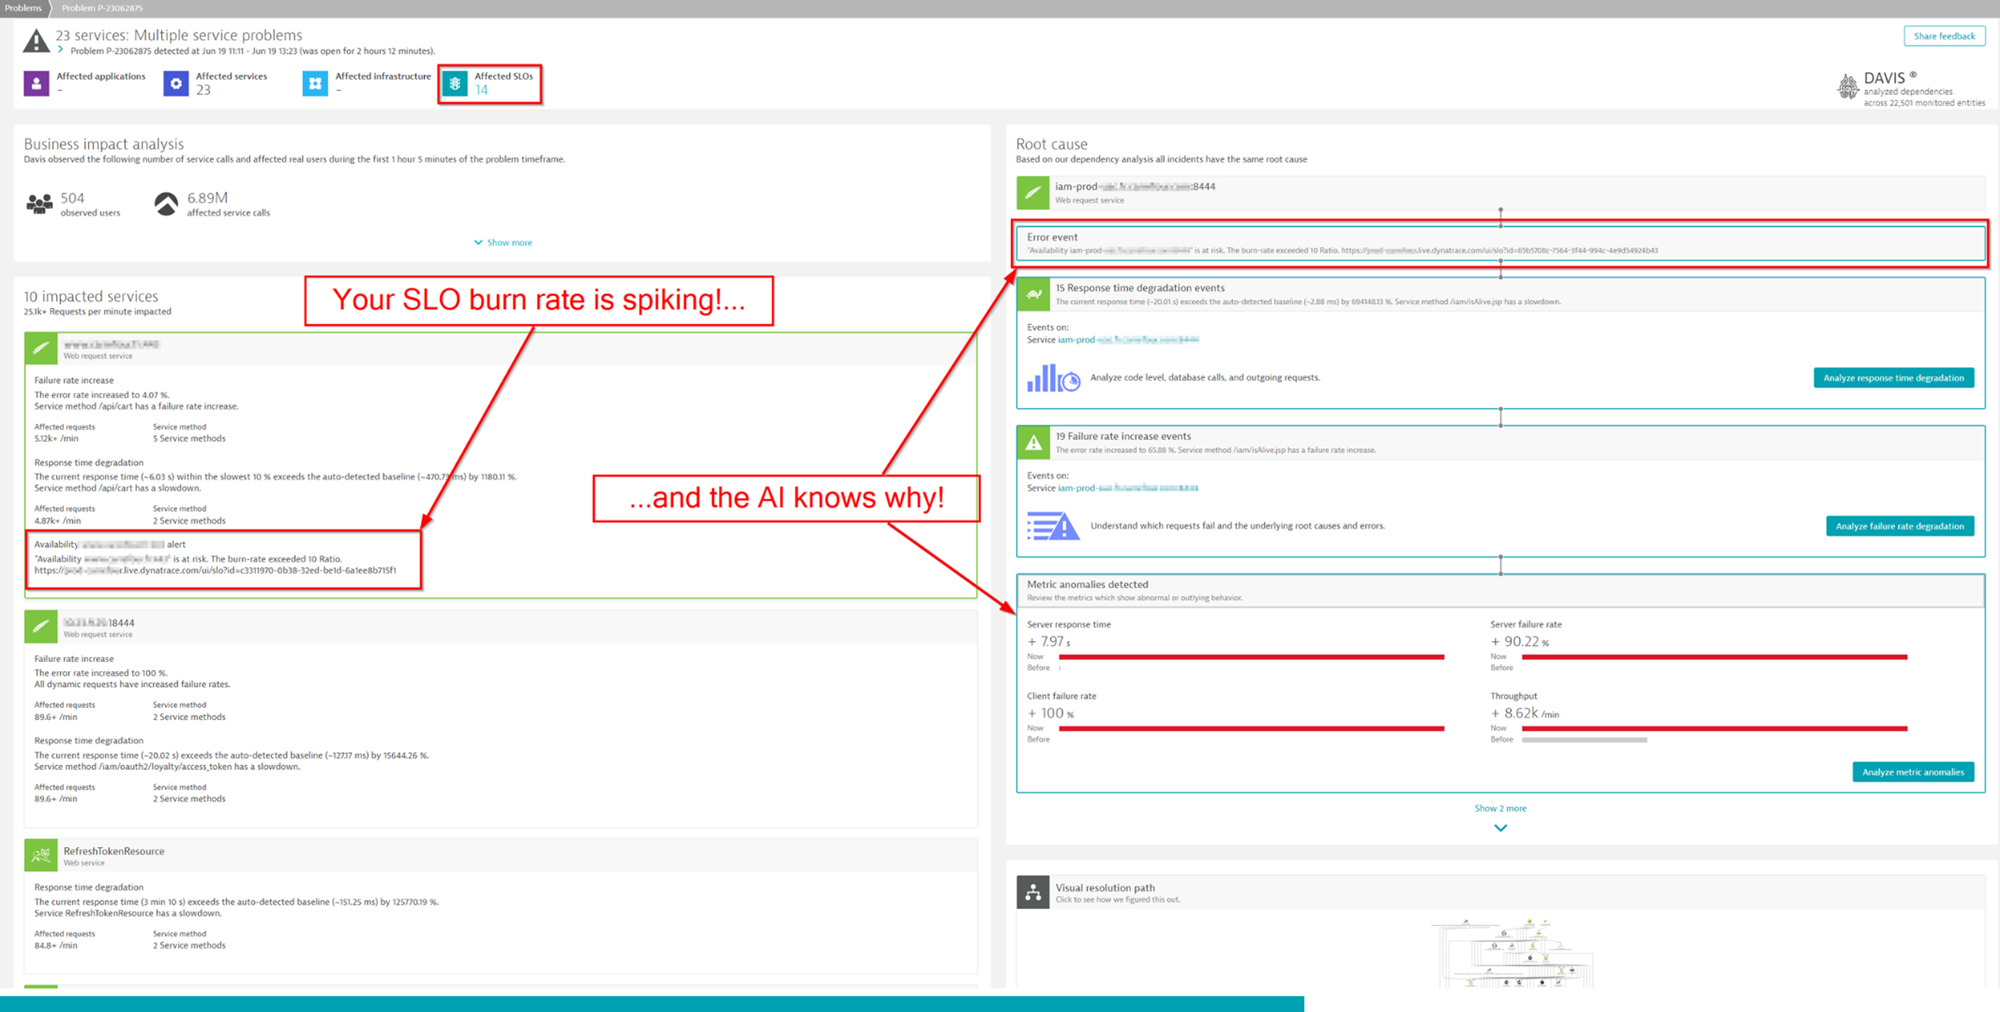
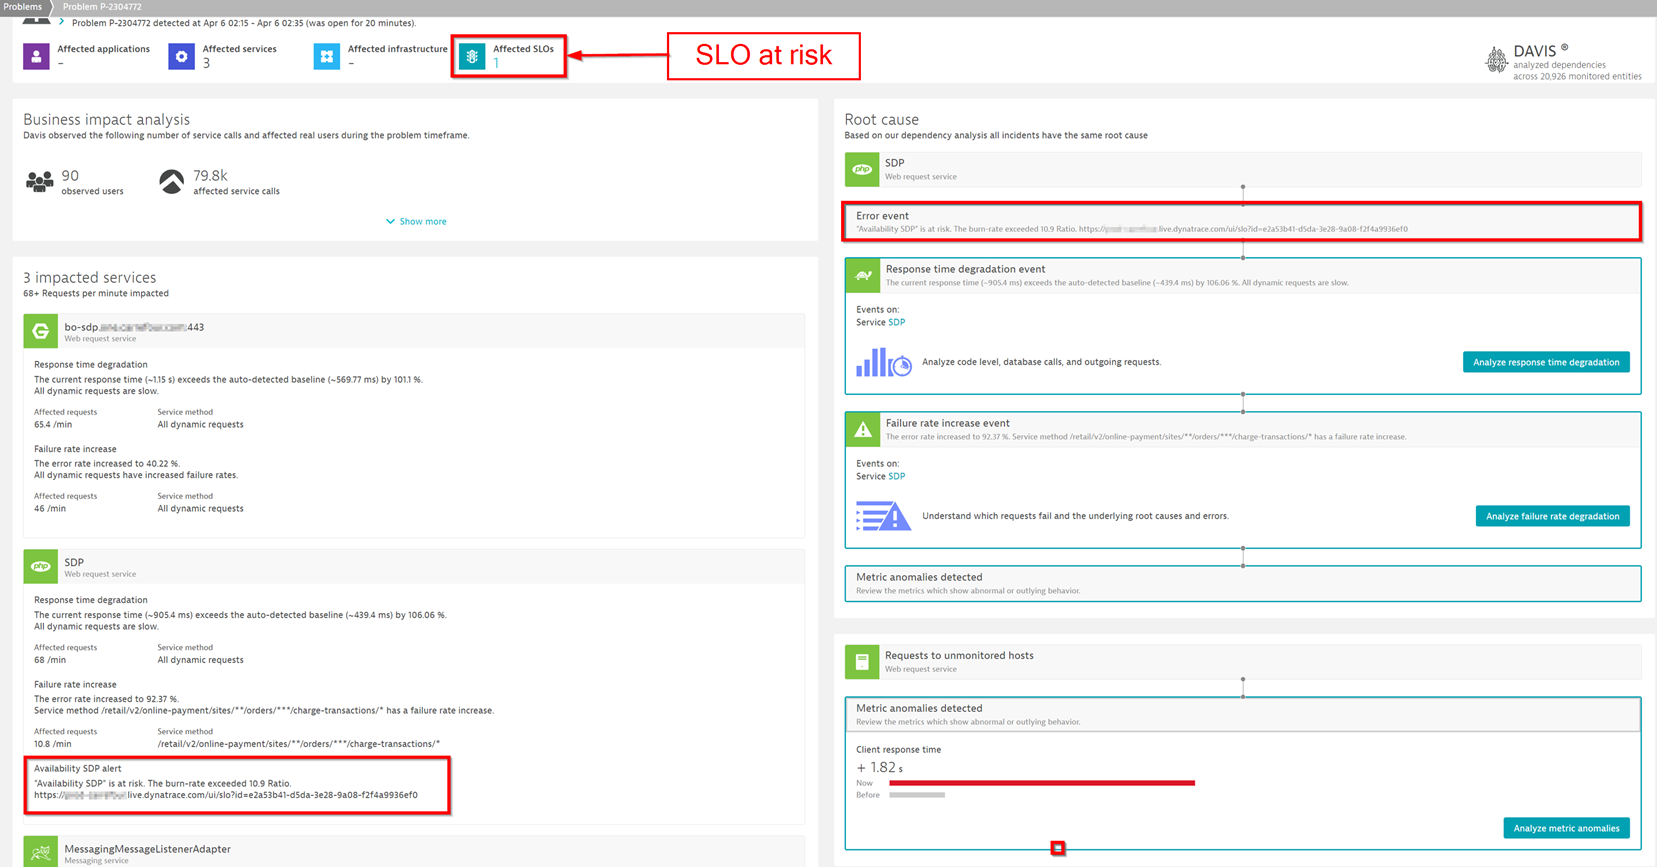
In the following example, Dynatrace identifies an SLO at risk, the three affected services, and the precise root cause of each issue.
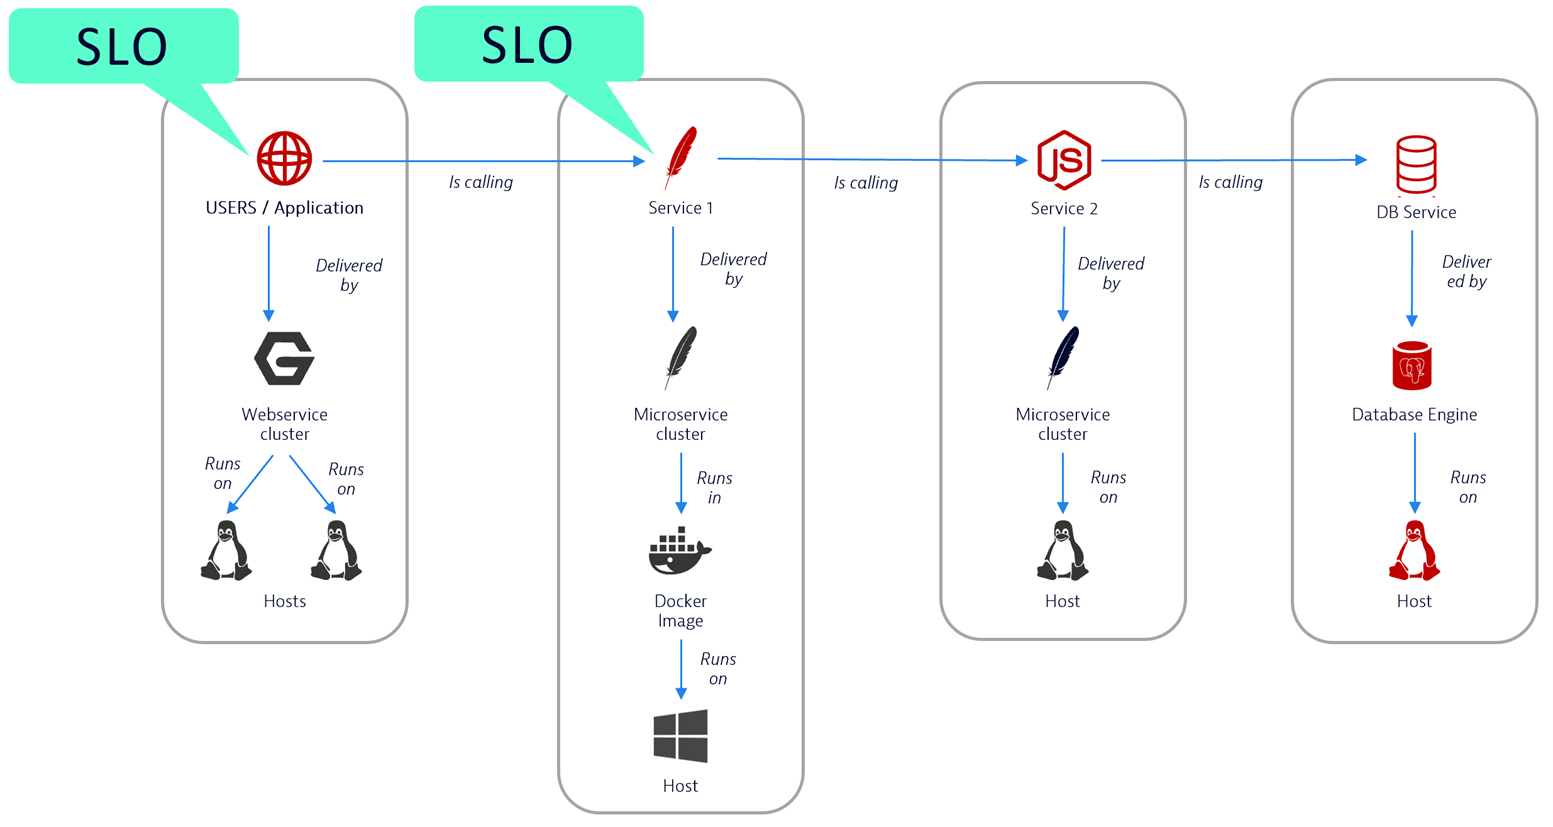
Focus on key SLOs for each application to deliver great user experiences
Front-end services directly impact the user experience and indicate overall system health, including potential backend issues. With a few carefully selected SLOs on the frontend, you can maintain effective, focused visibility on your overall system health.
This strategic positioning of SLOs ensures that you can immediately identify any spike in error budget burn rate. That’s because the direct relationship between the front-end services and user experience minimizes the risk of false positives. Furthermore, this approach allows for rapid alerting on burn rate spikes. Fast alerts are critical for mitigating any potential impact on the frontend, thus assuring consistent and optimal user experiences. This approach aligns with business goals and supports a proactive, user-centric model of service delivery.
Setting up SLO monitoring using burn rates
Dynatrace provides a unified platform for monitoring and establishing SLOs, integrating crucial performance metrics seamlessly into a comprehensive, real-time observability environment.
If you are just getting started with SLOs in Dynatrace, we highly recommend this introductory video, which provides a comprehensive and user-friendly overview of this SLO functionality.
Set up SLOs on front-end services that focus on failure rates
- Open the service you’re interested in and create your SLO by using the shortcut in the entity menu:
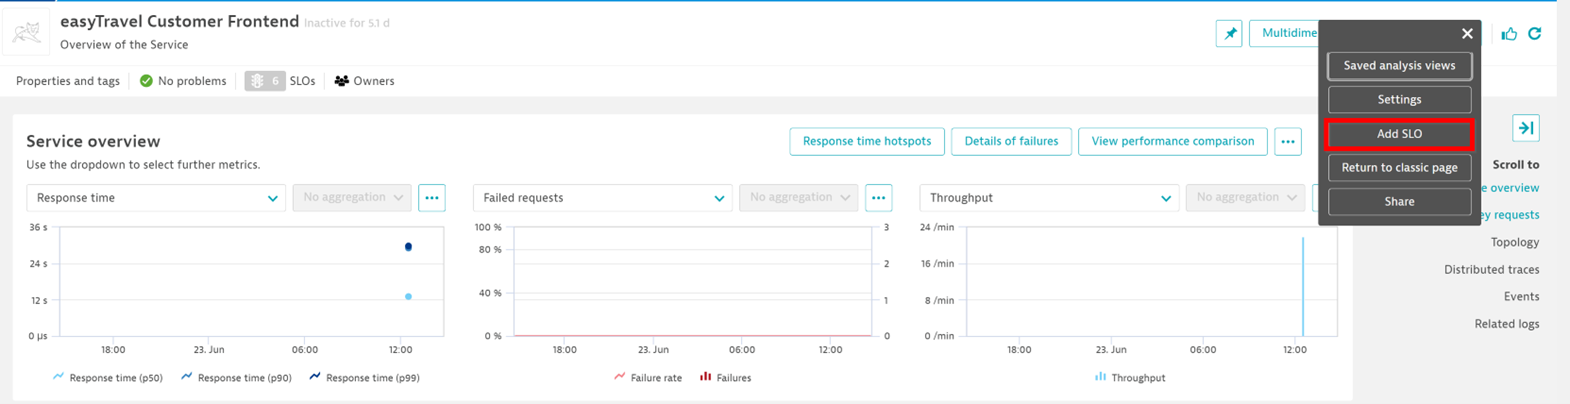
- As mentioned earlier, focus on your front-end services. The direct correlation between the front-end services and user experience minimizes the risk of false positives and over-alerting.
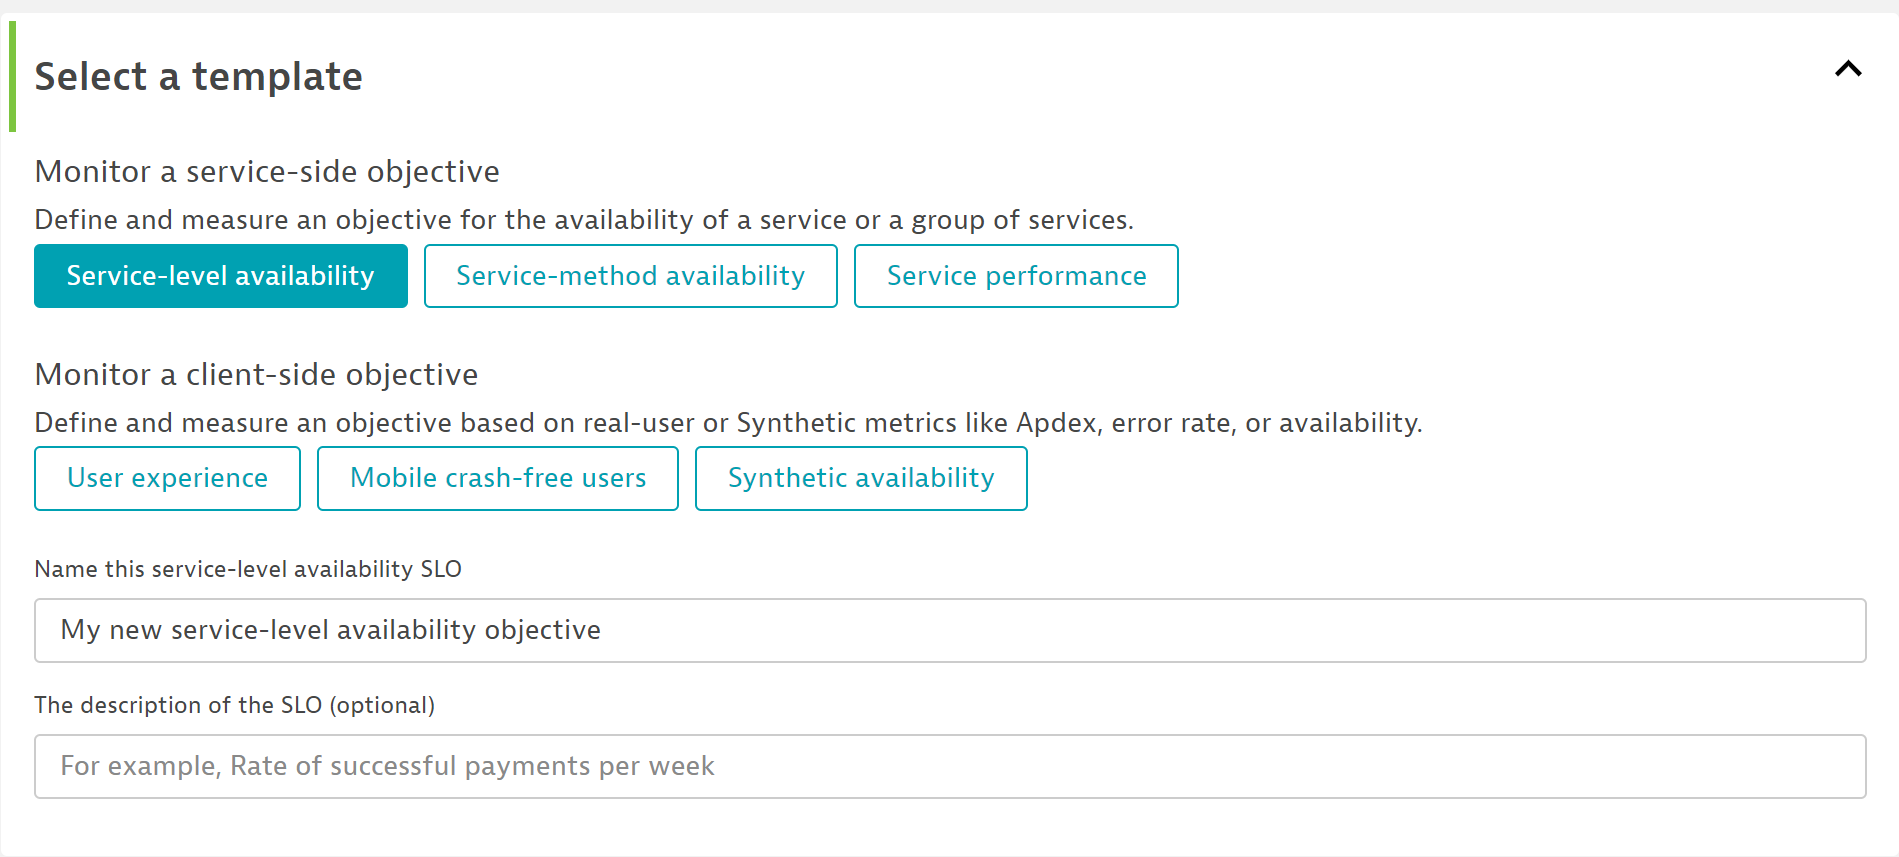
- For alerting, start with SLOs that focus on failure rate. Such SLOs monitor the percentage of successful calls for a specific service. To create such an SLO, choose the “service-level availability” template.
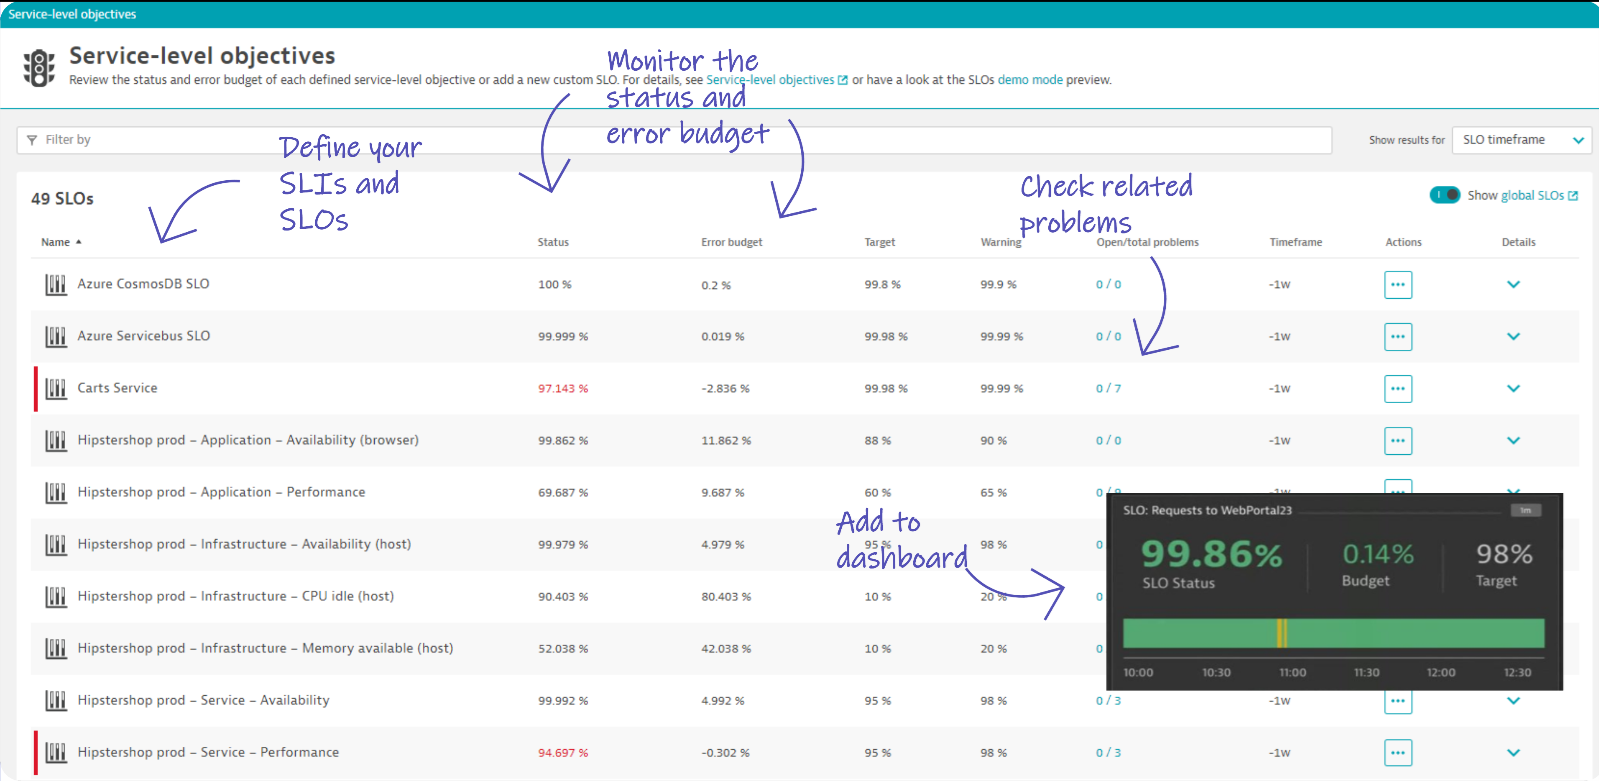
Once set up, you can seamlessly monitor your SLOs, their status, error budget, and burn rate. If a SLO is at risk of being violated, the Dynatrace AI engine automatically finds the root cause, so you can clearly see the related problems. Dynatrace then makes it easy to add issues to a dashboard or other reporting mechanism for follow-up.
Set up alerting on SLOs using error budget burn-rates
Once you configure the SLOs, you can set up alerting on them using your error budget burn rate. Automatic burn rate alerts let your team know when any SLO is at risk of being violated.
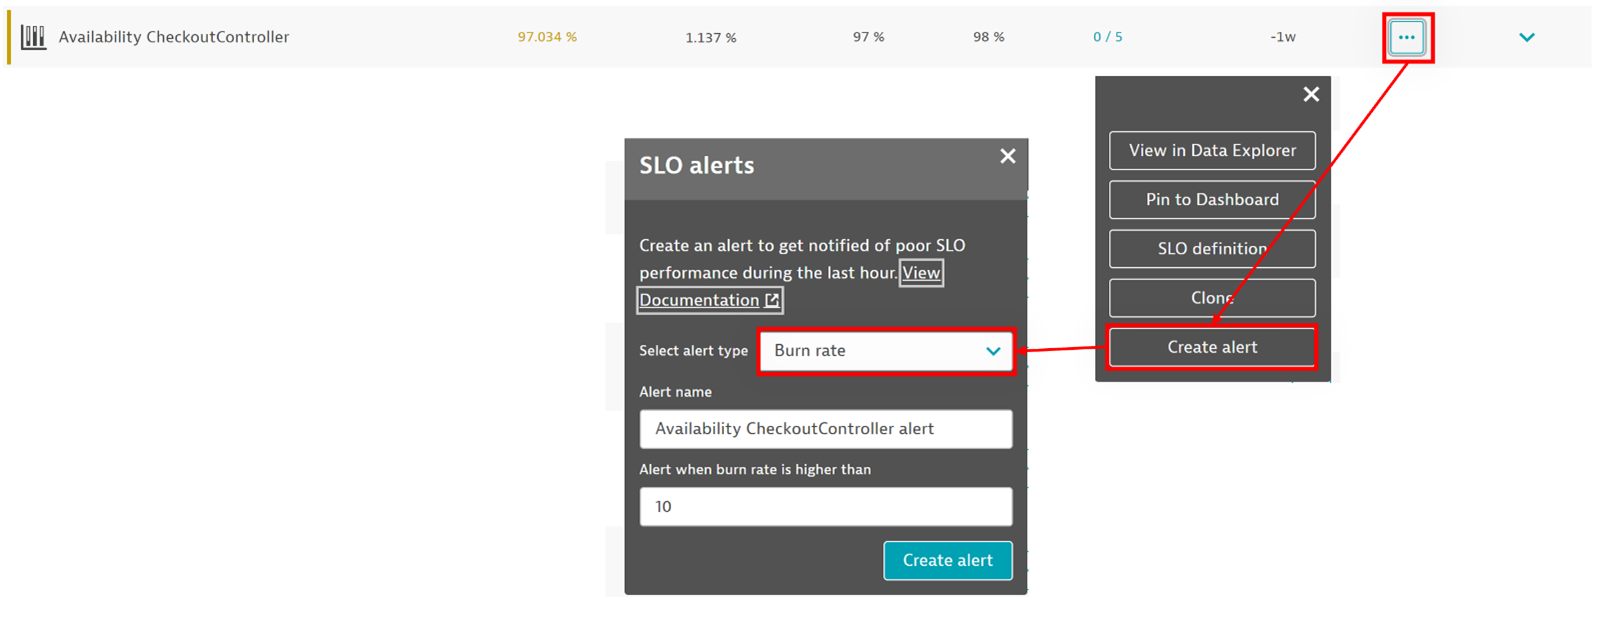
To create alerts, go to Service-level objectives, <your SLO>, and select More (…), Create alert (see Set up alerts for complete instructions). This generates a metric event in Dynatrace, which you can then configure as follows:
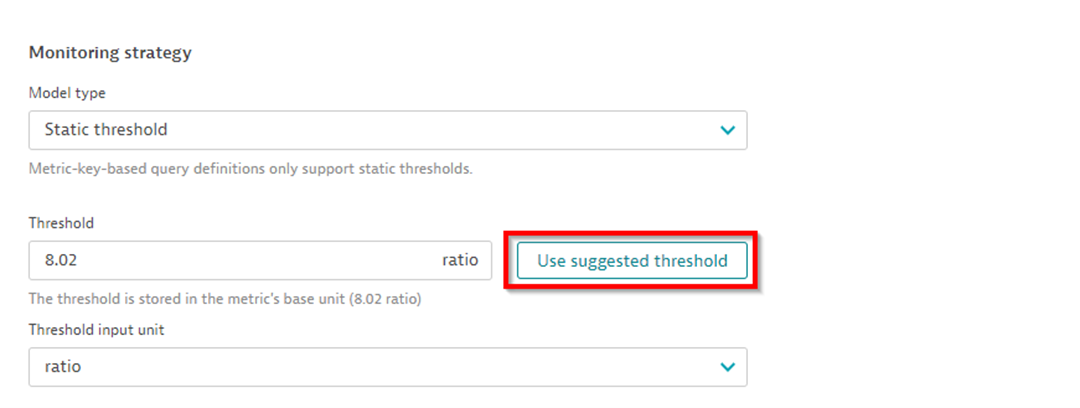
- What burn rate is too high? Let Dynatrace help by making a “suggested threshold.” It automatically calculates a threshold based on the target value you defined for your SLO and historic data.
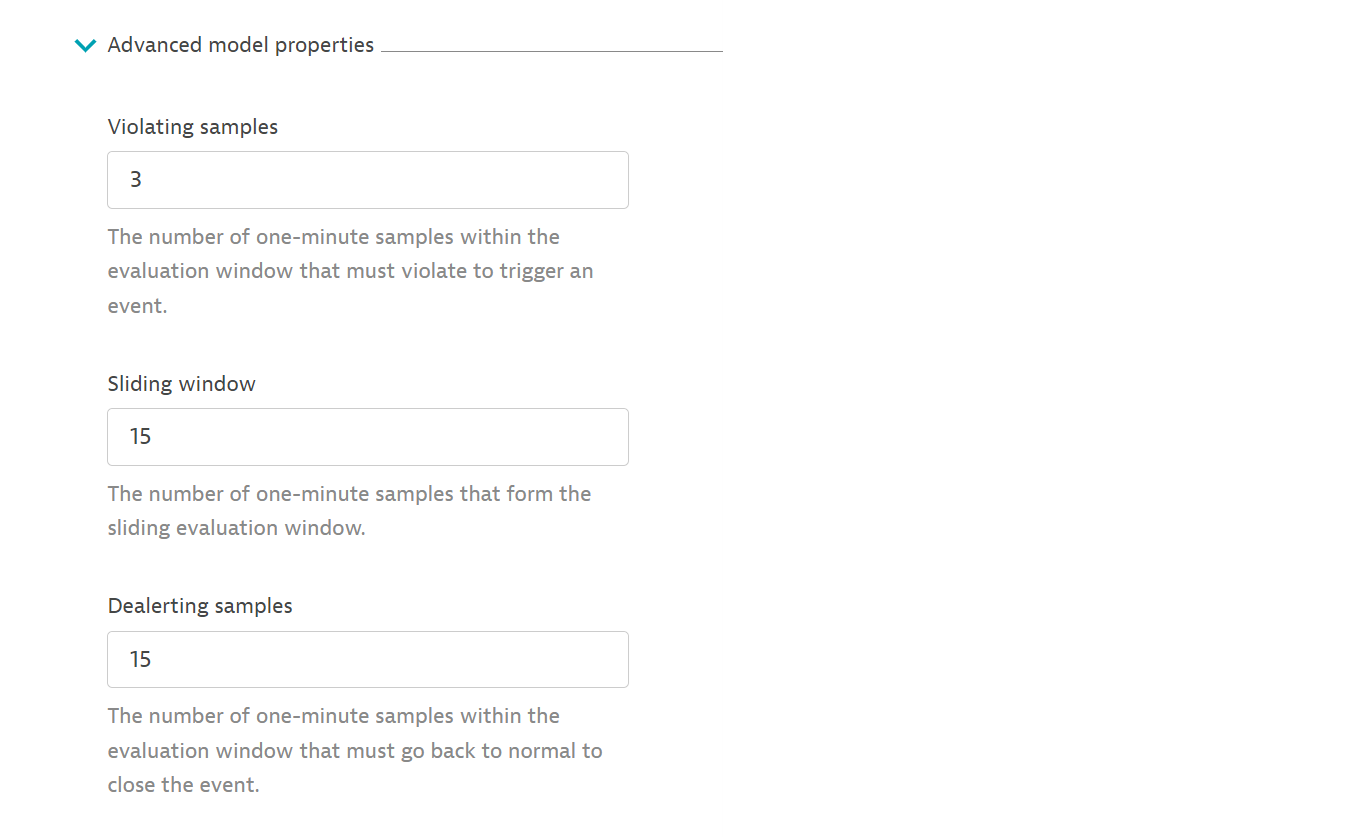
- Since we’re monitoring the burn rate of crucial front-end services, we want to be alerted quickly when issues emerge. You can control how quickly you get alerted in the “advanced model properties.”
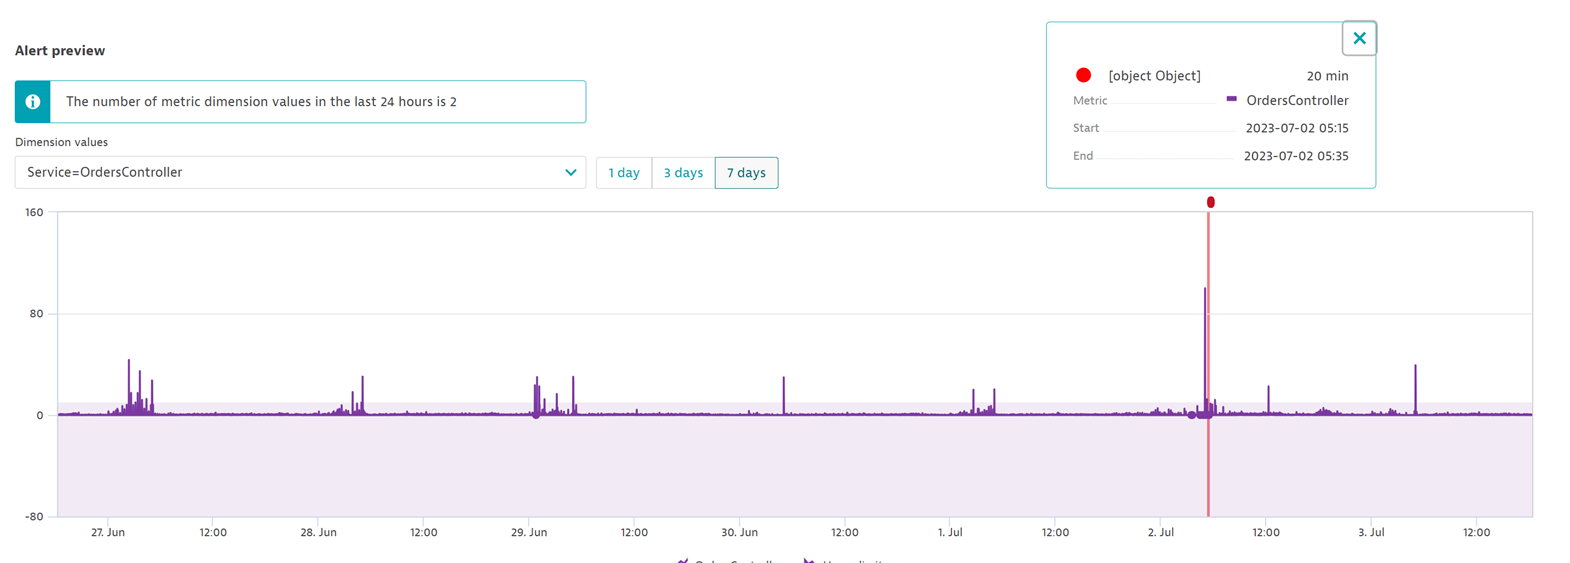
- Understand how many alerts your configuration would have generated over the past week. If it generates too many problems, your SLO target may be too ambitious. Adjust these figures until you reach the right alerting threshold for your situation.
Alerting is just one side of the equation. You also need context if you’d like to proactively take action to keep your SLO healthy. Here Davis causal AI provides insights into possible root causes of SLO degradation.
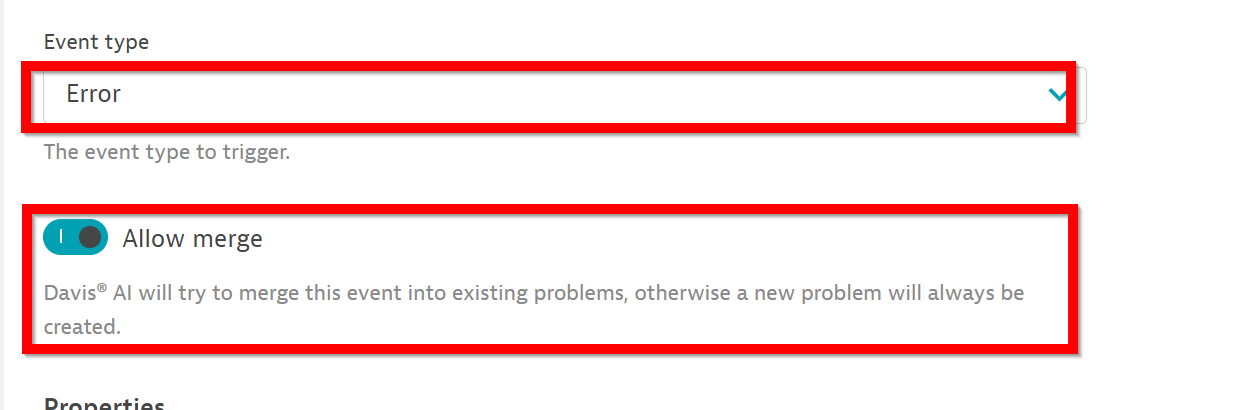
- Choose the right event type for the alert. They’re available via dropdown on the “event type” field. If you start with failure rate SLOs, choose the “Error” event type.
- Allow Davis causal AI to merge the problem opened by the SLO with other problems.
Monitoring SLOs made easy with unified observability and Dynatrace causal AI
Alerting on SLOs using burn rates on your front-end services ensures that you can detect and resolve system anomalies swiftly. In the process, Davis causal AI provides automatic and comprehensive root cause analysis. This unified approach with observability and AI allows teams to focus on critical issues, reduce alert fatigue, and make informed decisions that drive efficiency and better business outcomes.
To see this use case in action, tune in to my conversation with Andi Grabner in the Observability Clinic, SLO Error Budget Burn Rate-Based Alerting.
For additional tips about scaling SLOs, see the blog post Service Level Objectives (SLOs) at Scale (Tips and Tricks).


Looking for answers?
Start a new discussion or ask for help in our Q&A forum.
Go to forum