
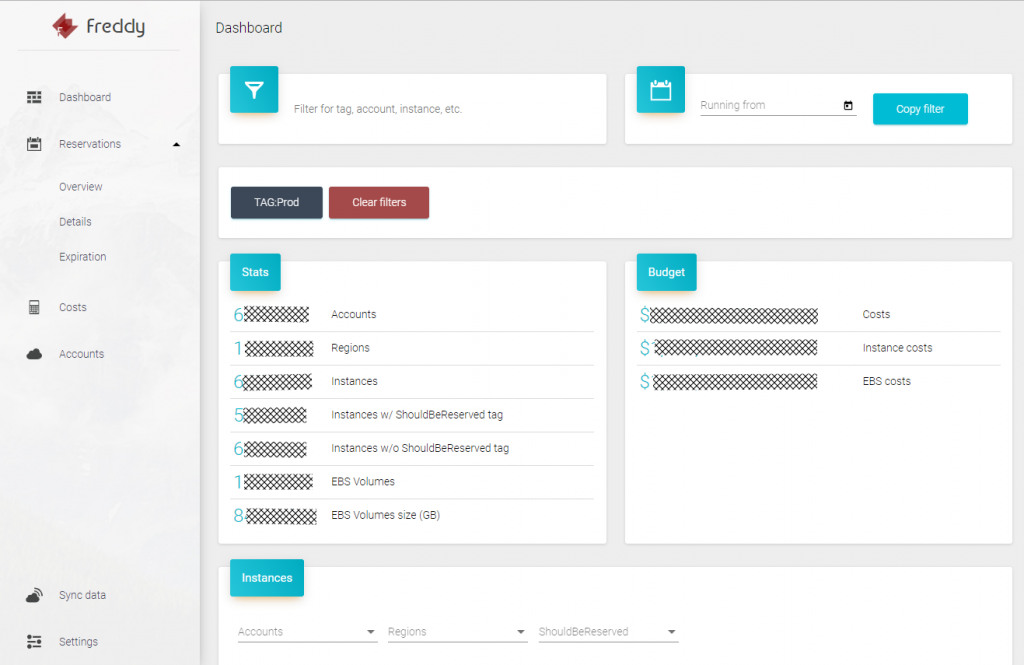
Our Dynatrace DevOps team is not only using Dynatrace to monitor the Dynatrace Clusters we run for our customers in the public cloud, but they have also developed a set of tools that help them in their day-to-day work. In my quest to share more stories about how our Dynatrace team automates their processes, I came across Freddy, an internal application developed to report on AWS resource consumption across several of our AWS accounts.
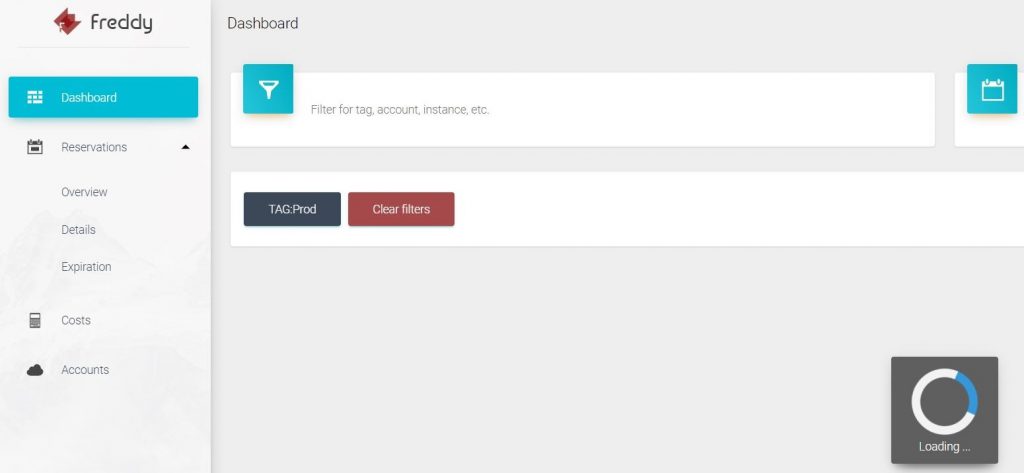
Freddy runs a scheduled task every 4 hours that pulls in data via AWS’s CloudWatch API and stores it in a DynamoDB table. The Freddy web interface then allows our internal users to run queries against the data to answer questions like this one, for example: how many EC2 instances with a certain characteristic are currently running across all Dynatrace’s AWS Accounts?
The reporting tool quickly became very popular as querying information across AWS accounts is otherwise not an easy task. With growing popularity, it became apparent that Freddy couldn’t stand the test when it comes to high performance, scalability and great user experience. Our internal users were reporting up to 30s-page load them when executing queries such as “How many EC2 instances across all our AWS accounts have a PROD tag?”
David Rousar, a DevOps Engineer at Dynatrace, shared the steps he took to diagnose and fix the performance issue he inherited from the original developer of Freddy. Turned out to be, that our old friend – the N+1 query problem – we have seen over the past years & decades with other databases, had returned. Thanks David for sharing your steps. It’s a great example on how Dynatrace gives developers the automatic insights they need to identify and fix a problem within a couple of clicks.
Step #1: Top Web Requests Analysis
In Dynatrace, navigate to Diagnostics -> Top Web Requests. In that view Dynatrace, shows you all the web requests that came in during the selected timeframe. This view – and many others within Dynatrace – allow you to filter on different meta data, e.g: request type (GET, POST, …), request URL (/myreport), failure state and even request attributes. Request Attributes tell the Dynatrace OneAgent to capture method arguments, return values, HTTP parameters …
For David’s use case, the request URL he is looking for looks like this: https://internal.devops-services.dynatrace.com/freddy/home?terms=TAG:Prod. That means we can create a Request Attribute like the following screenshot shows – capturing the terms HTTP Parameter:
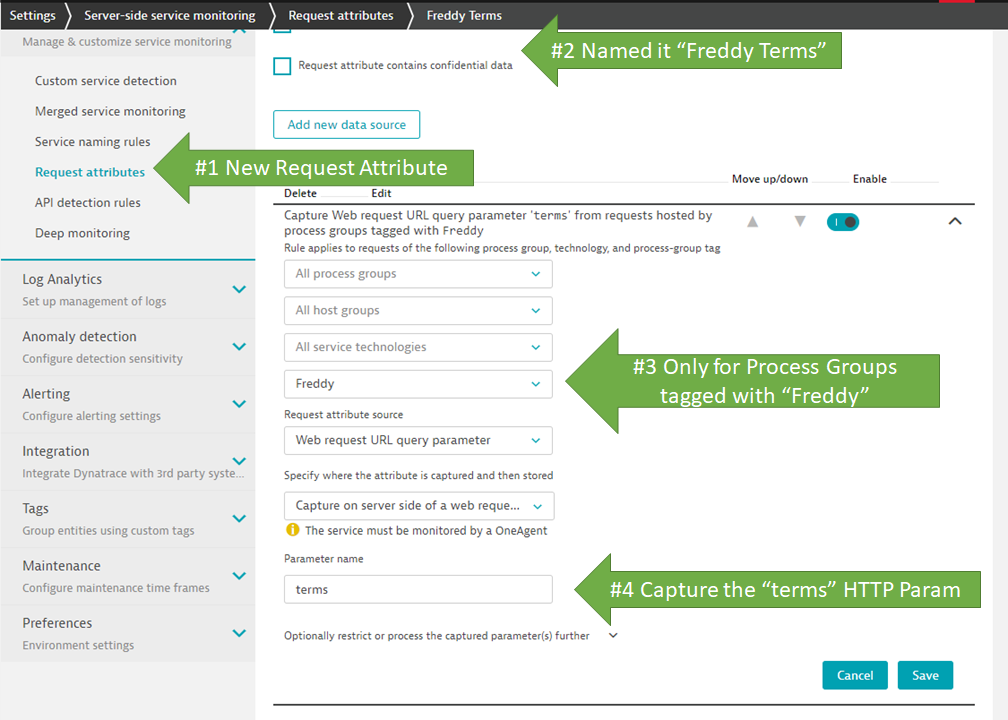
Once we configure a Request Attribute for the terms parameter we can simply use this as a filter in the Top Web Requests Diagnostics View:
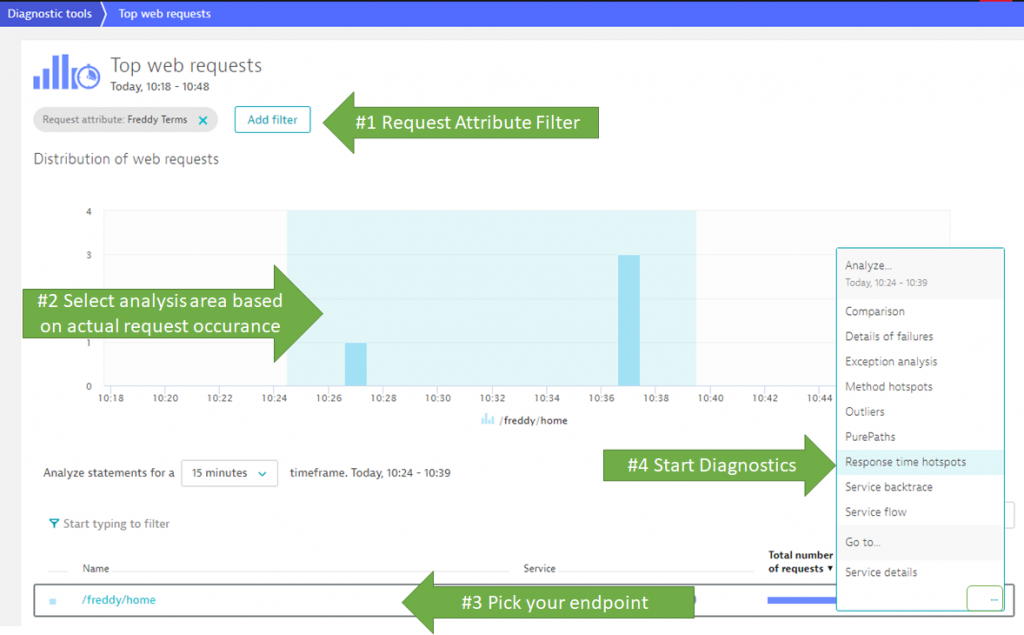
Tip: In the bottom of the Top Web Requests view you have a “…” link next to every endpoint. This opens up a very useful menu with diagnostics steps to execute on exactly the requests that hit that endpoint and that are highlighted in the Analysis Time Range as selected in the chart above! From here I typically select “Response time hotspot”
Step #2: Response Time Hotspots Analysis
When analyzing the Response Time Hotspot, Dynatrace crunches through all the PurePaths that match that filter and highlights the top hotspots and top findings:
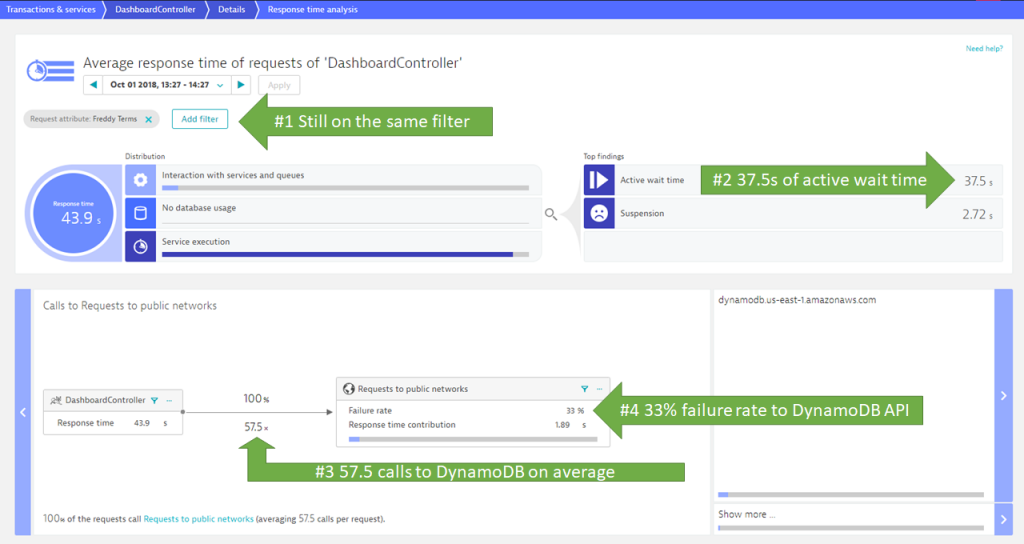
In the screen above, we see that the average Response Time for these requests was 43.9s. Most of that time (37.5s) was, spent in waiting. It is waiting for calls to a public service endpoint: dynamodb.us-east-1.amazonaws.com. We also see that it is not a single call that is made. In fact: on average the DashboardController implementation makes 57.5 calls to DynamoDB for each transaction. 33% of these calls actually fail!
Step #3: PurePath Analysis
The final step is to learn how DahsboardController is making all these calls and how to fix it. For this, we want to eventually drill into a single PurePath. Either directly from the Response Time Hotspot or via the Outlier Analysis.
Tip: Personally, I first use the Outlier Analysis and zoom in on requests that fall into a certain response time bucket, e.g: > 30s. That allows me to narrow down the number of PurePaths to those that match my previous filter, plus, those that show a certain response time behavior!
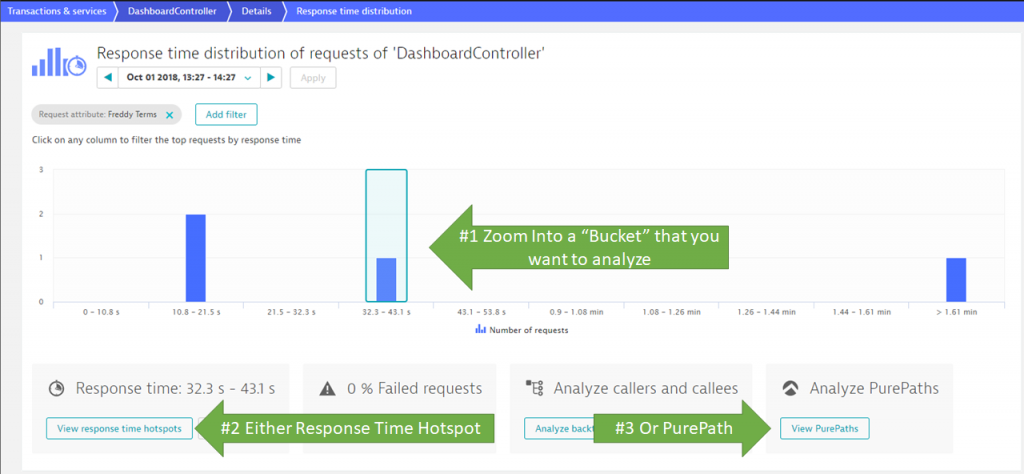
In any case you end up with a single or a list of PurePaths that meet your criteria:
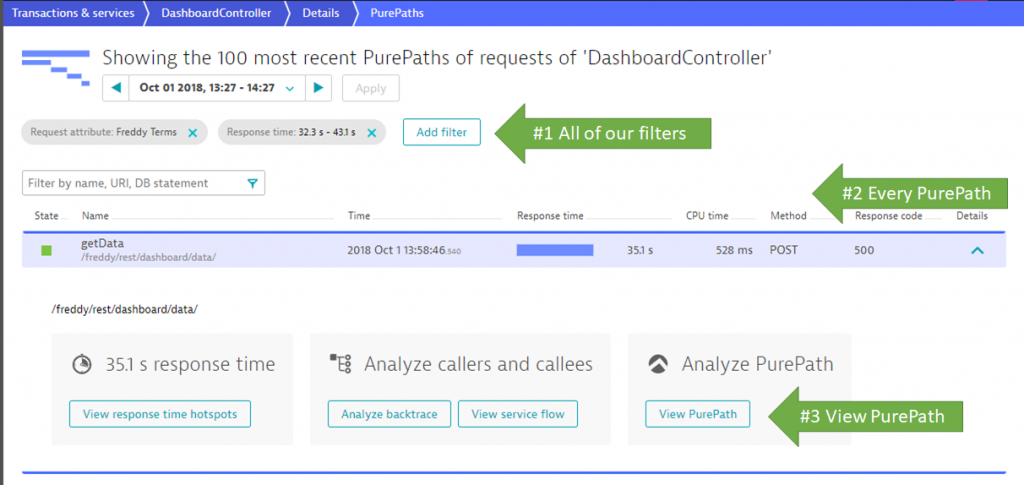
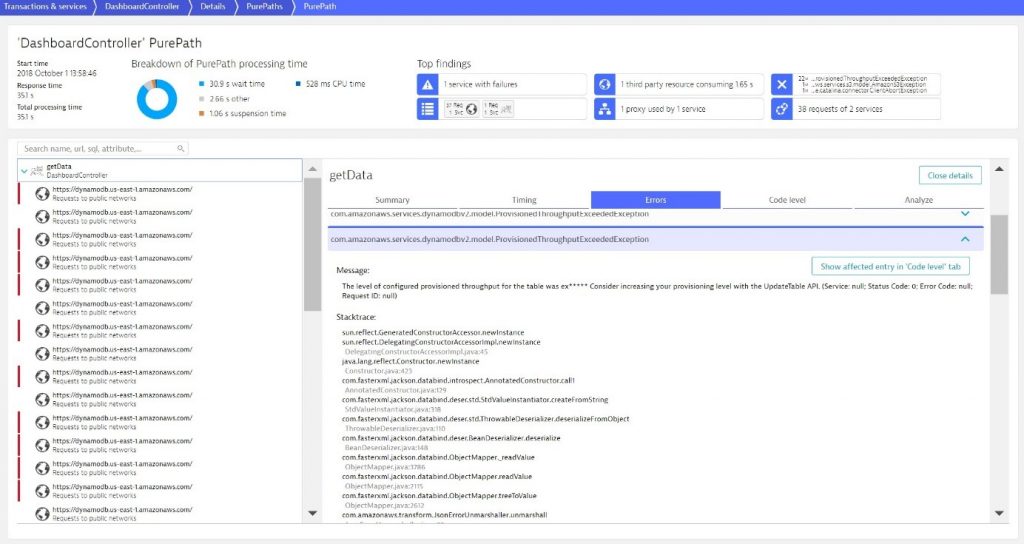
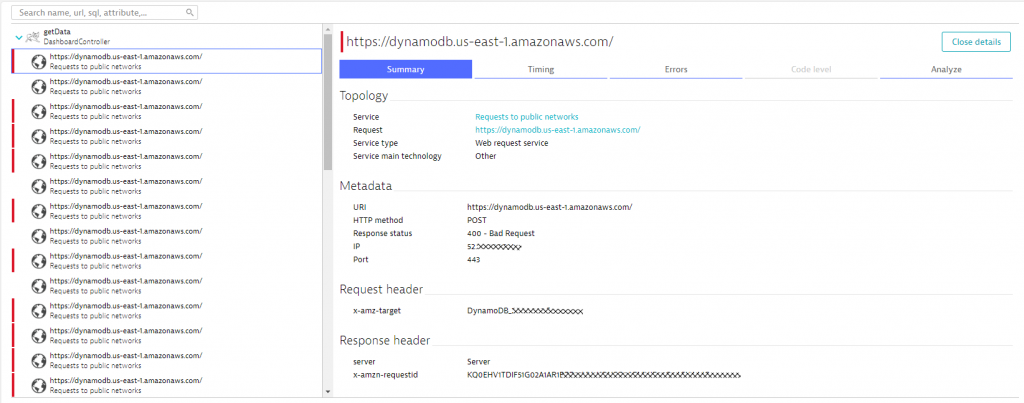
In the PurePath details view we can now see how the getData endpoint of the DasboardController is making these excessive amounts of calls to DynamoDB. A great help in this view is the “Top findings” section where we immediately see that this PurePath made 38 service requests and that we also see a lot of ThroughputExceededExceptions.
The waterfall diagram next to the tree shows how these DynamoDB calls get executed. (Looks like it’s all synchronously after one other.) The red bar on the left side of each call, is indicating that these calls actually resulted in an error.

Tip: you can click on these top findings and it will automatically highlight them in the PurePath tree.
When clicking on one of the failing requests, we see the actual reason for these failures. Seems the excessive amount of calls to DynamoDB exceeds the AWS enforced limits. This is classical throttling of an API that our Freddy reporting tool is suffering!
The PurePath view provides even more details such as Code Execution Details or all the details on HTTP Parameters that came in from the end user or the parameters that got passed to the external DynamoDB Endpoint:
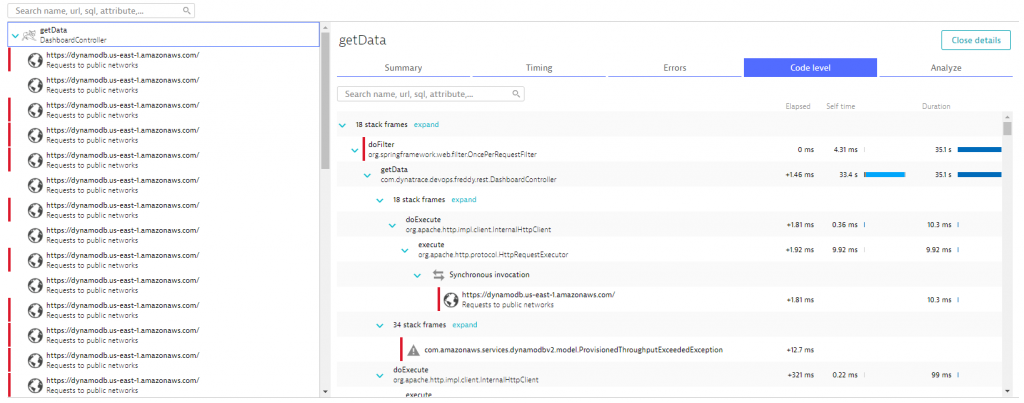
If you want to learn more about the PurePath view check out the blog post from Michael Kopp on PurePath Visualization, as well as my diagnostics focused YouTube tutorials.
Step #4: Fixing the issue!
David and team took all the evidence as provided by Dynatrace and fixed the issue with smarter access to the DynamoDB API, some caching and other code improvements. The result speaks for itself, as you can see from the following Response Time Hotspot Analysis done on a PurePath that was captured after the fix was published:
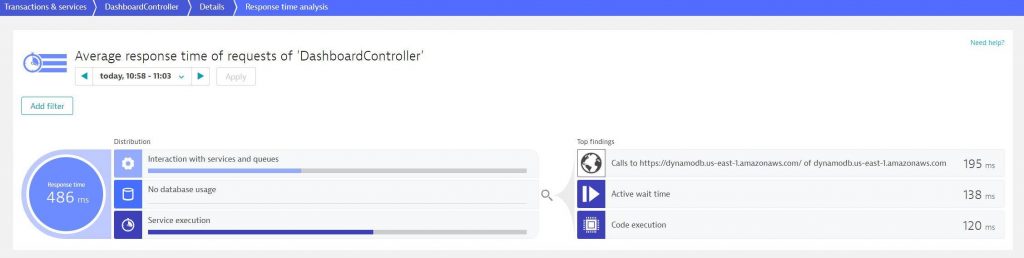
The improved response time also makes it more fun to use the tool itself – whether you are executing queries with a single tag or multiple tags. Everything is now “lightening fast!” 😊
Share your own Diagnostics Story with me!
Just as David shared his story with me, I encourage every reader – whether you are a developer, architect, tester … – to analyze your slow transactions and share your findings. I am very happy to help you analyze the data as part of my Share Your Problem Pattern program!
The only thing it takes for you to get started is to sign up for our Dynatrace SaaS Trial and then install the Dynatrace OneAgent on the machine where your application or service runs. From that point on Dynatrace, will provide you with all the level of visibility and diagnostics options as shown in this blog!
For starters I can also recommend my YouTube Video “What is Dynatrace and How to get Started”!

Looking for answers?
Start a new discussion or ask for help in our Q&A forum.
Go to forum