
IT monitoring professionals and business analytics teams need to collaborate to deliver an optimized customer experience and a better user journey.
Driving better business outcomes has more organizations focusing on the customer journey. “Within the past few years, differentiating through customer experience has become a corporate mandate,” says Gary Kaiser, Product Manager of Business Analytics at Dynatrace.
And it’s easy to see why. One report found that companies that adopt a customer-centered mindset are 60% more profitable than companies that don’t. From the users’ side, 77% of consumers reported that poor customer experiences diminish their quality of life.
“Our roles as IT monitoring professionals have expanded to embrace collaboration with the business users,” Kaiser explains at the recent Dynatrace Perform 2022 conference. But in most organizations, IT and business teams work in silos.
Along with Dynatrace Insights Analytics Manager Adam Russo, Kaiser discusses the importance of customer experience along the customer journey and explains how IT teams and business stakeholders can collaborate. “The business users own the digital experience strategy, but depend on us for insights,” Kaiser says.
IT metrics vs. business goals
To align with business users, an organization must first conduct a business impact analysis to understand the goal of an application and determine the number of affected users. “If you’re being proactive, you might look at an Apdex score to identify high-volume pages with lower scores, which may have a large impact on users,” Kaiser says. Although important, these starting points provide IT metrics, not business metrics.
To understand how IT metrics relate to business goals, teams must ask: “Does this metric impact business outcomes?” If the answer is yes, then consider the following questions:
- Is the application customer-facing or internal?
- Are the users geographically relevant buyers or browsers?
- Are these conversion pages with key interactions or incidental pages with less impact?
- How do you measure customer experience?
IT teams often think about conversions, which carry across all industries. For example, a bank conversion occurs when someone opens an account. An insurance company conversion happens when someone files a claim.
However, it is important to consider the entire funnel or the customer journey from when a user enters a site down to the conversion.
KPIs that focus on customer experience and business context
Associating KPIs with these different user interactions can create a foundation for many business analytics use cases. “We want to go beyond a simple count of conversions and provide some business context or business value,” Kaiser explains.
This process is relatively straightforward because most organizations have already identified and codified business tracking goals in the website data layer. They may categorize these business goals as follows:
- Transaction data: Product, quantity, and cart value
- Behavioral data: Page views, scrolls, and clicks
- Audience segment data: Loyalty status, characteristics of users, and geographical data.
With defined goals, any tool can take advantage of this data or a subset of data to obtain customer experience analytics. One example is Adobe Analytics, which uses data enrichment and data cleansing in the UI. But many of these tools don’t capture the whole picture. “Typical use cases with Adobe share a common problem we see, which is lack of visibility into all functional errors,” Russo explains.
How to overcome lack of visibility into the customer journey
Three common reasons for this lack of visibility are the following:
- Cascading style sheet (CSS) selectors may be overly complex and setting up a property is not possible
- Action names don’t match between Adobe and Dynatrace
- Naming rules might be difficult to manage because of the structure of the uniform resource identifier (URI).
But organizations can solve these problems in the following three ways:
- Pushing errors to the data layer
- Define Adobe custom insight conversion variables (eVars)
- Capture Dynatrace Real User Monitoring (RUM) as a user session property
You can also pull Adobe pagename and pagetype variables, which are common across the industry and apply to naming rules.
Using these methods, teams can use Dynatrace to achieve faster visibility and automatically identify root causes of customer experience problems. Using Session Replay, teams can easily filter errors in user sessions and clean user action names using synchronous data between Adobe and Dynatrace.
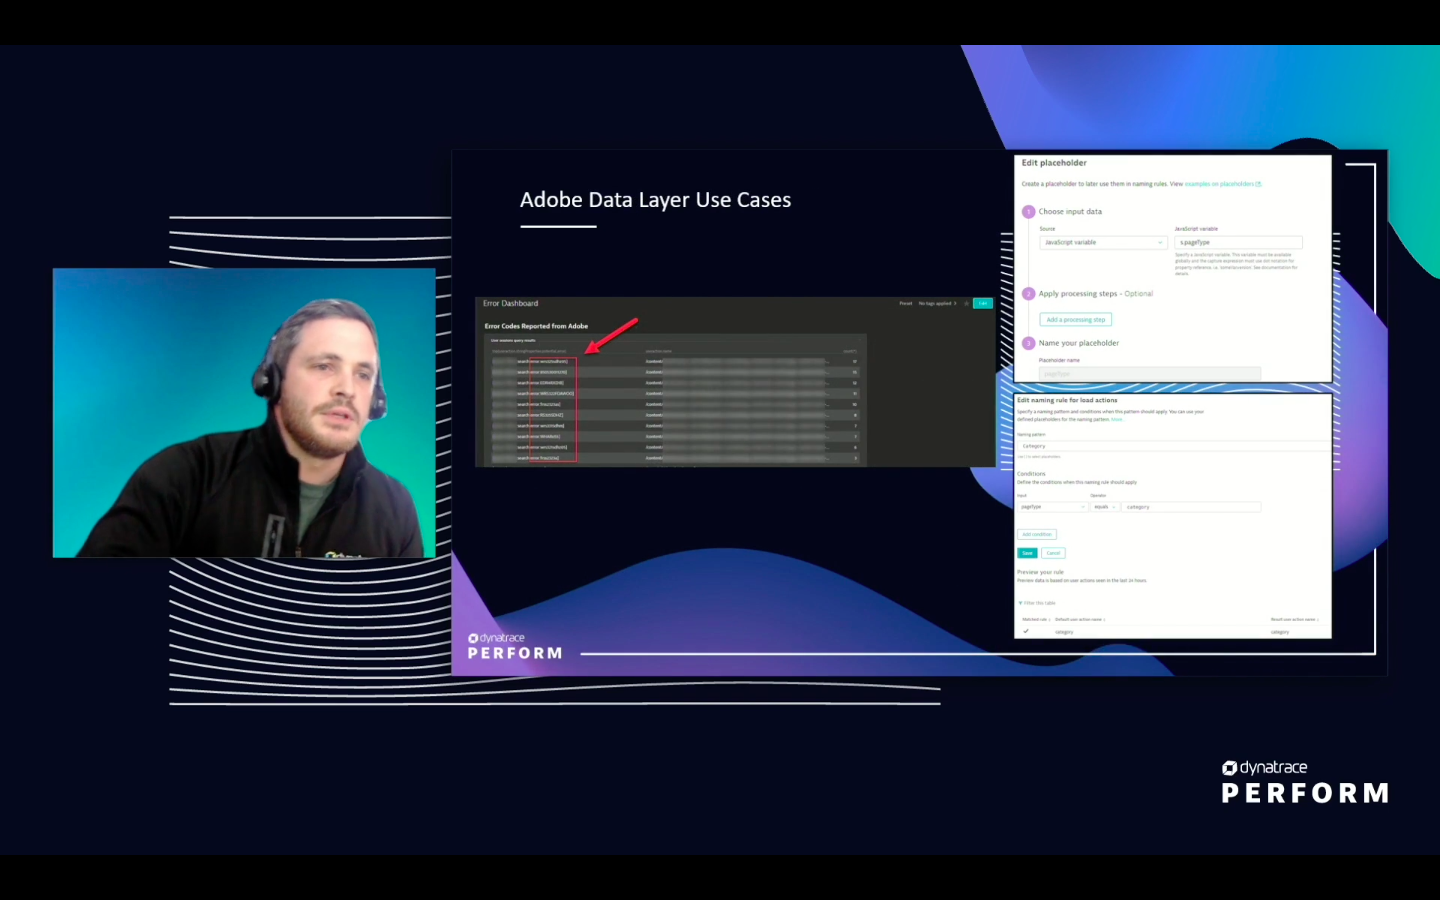
Tracking the customer journey: Adobe data layer use cases
“The data layer is a great starting point for business analytics,” Kaiser says. “Many business analytics use cases can be solved exclusively through metrics and context available through the data layer.” If an organization has RUM or Digital Experience Monitoring (DEM), they already have access to this data. Other data sources include real user sessions, application business logic, and log files.
The first use case involves pushing errors to the Adobe layer and capturing them within Dynatrace.
“There are specific error codes related to specific actions,” Russo says. “Then, we can go from there and filter user sessions, then dive down and see which users are being impacted by these errors.”
Another use case demonstrates how Dynatrace can enable both IT and business teams to look at the same customer experience data from different angles. “Marketing folks may use ContentSquare to measure behavior analytics, while IT uses Dynatrace to measure performance analytics,” Russo explains.
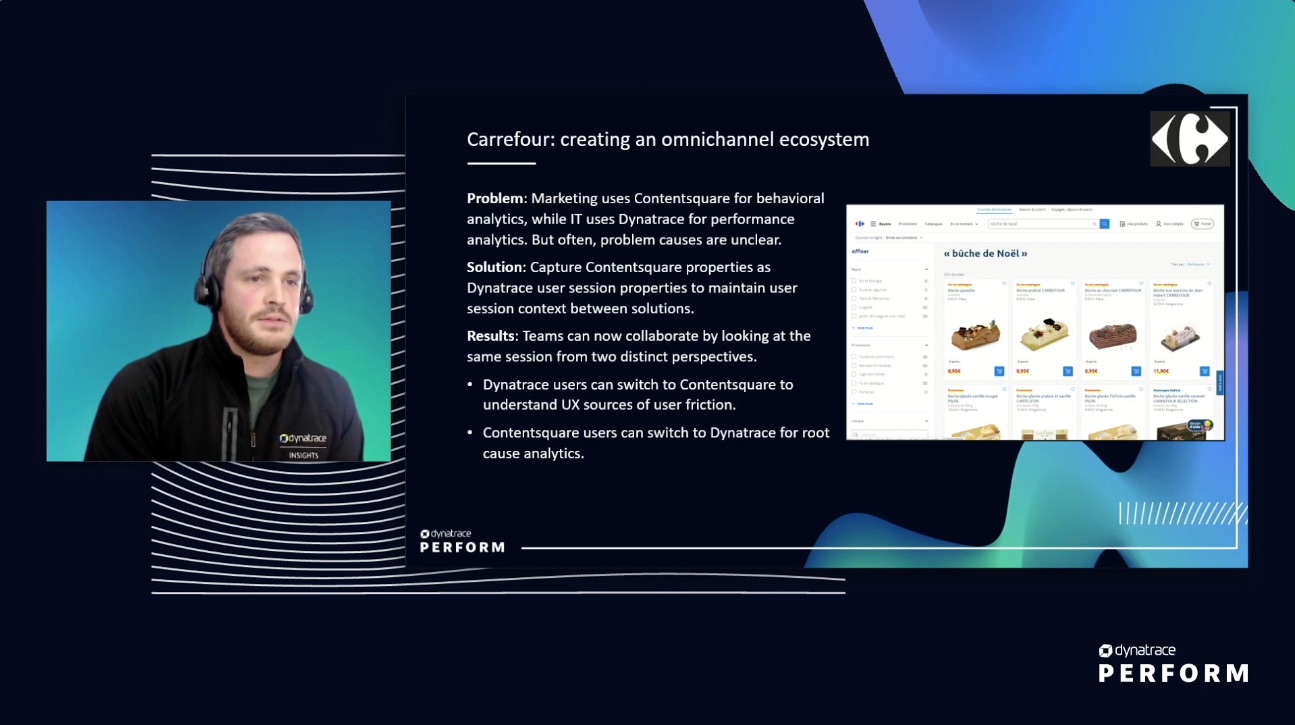
In this case, Dynatrace captures properties from ContentSquare as Dynatrace user session properties. “We’re looking at behavioral data,” says Russo, “but we’re taking into account the performance impact on that user behavior.” As a result, IT analysts can understand the effects of a problem on the customer journey, and business analysts can understand its root causes.
Gaining insight into the customer experience using APIs
You can extend insights beyond the data layer by ingesting other data sources, metrics, and context from external business tools using an API. One example is Voice of the Customer (VoC) data. “A VoC solution allows a customer to provide feedback about their customer experience, either while they’re navigating a site or afterward through a survey,” Kaiser explains. “Some of that data can be valuable to IT.”
For example, a customer may rate website performance with three stars and give usability one star. Often, there can be a days-long delay between when a user submits feedback and when teams analyze, categorize, and escalate it to IT.
Using the API, you can directly ingest VoC metrics into Dynatrace so IT analysts receive instant feedback about IT-relevant ratings. With the two tools connected, teams can switch contexts and investigate individual complaints.
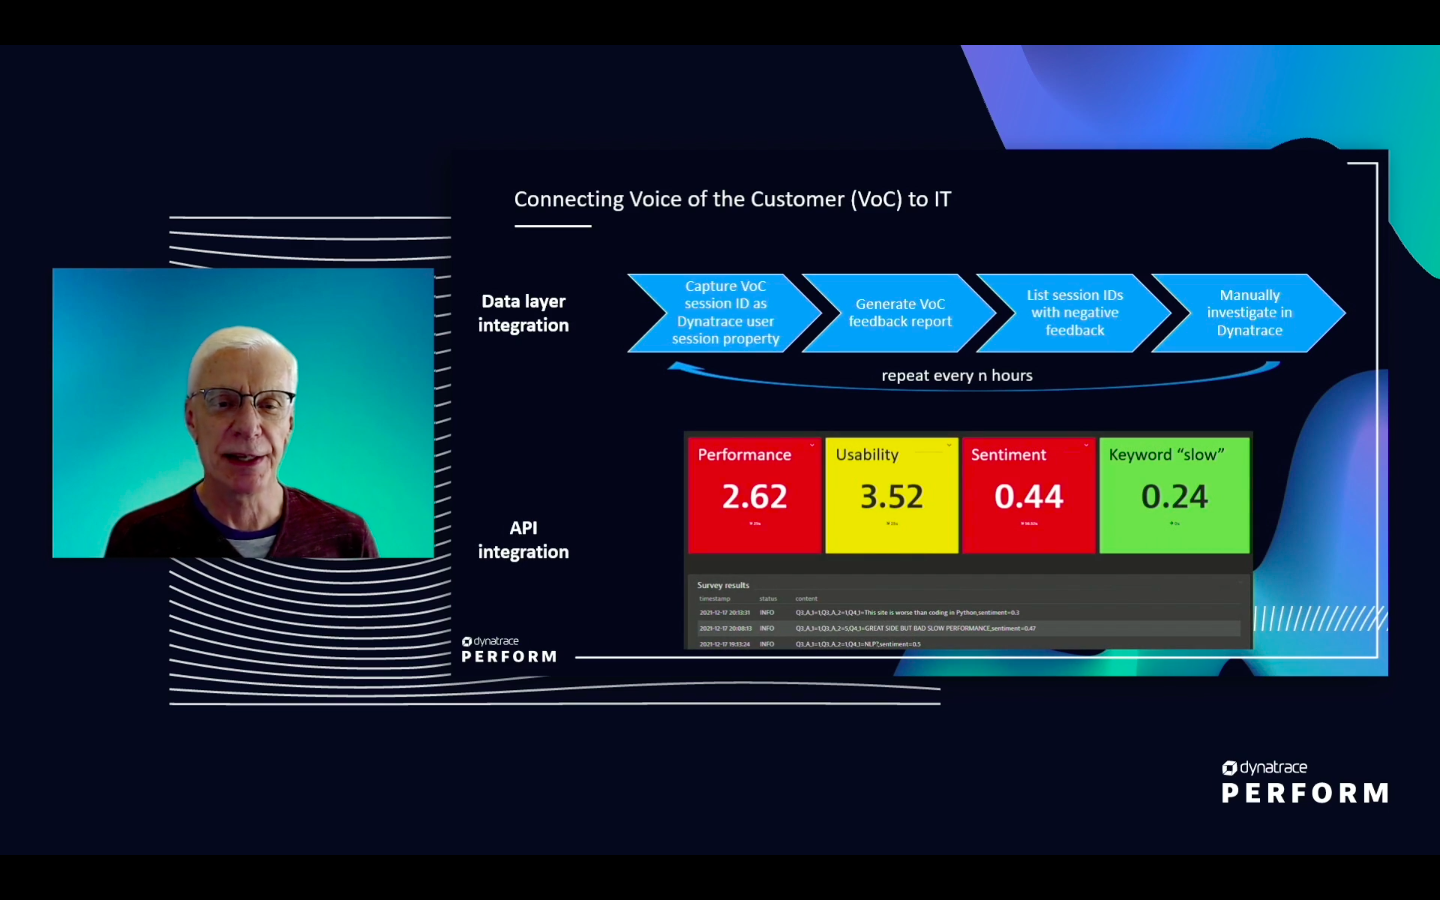
“You can alert on these or graph them over time to look for trends,” Kaiser explains. You can also drill down in Dynatrace and identify the underlying problem.
“The message is to start thinking about the business tools your business peers rely on, that they use in your organization, and what business metrics, what business context those tools might have,” Kaiser explained. Then, they can bring those tools into Dynatrace to speed up and enhance critical insights for business leaders and peers. The result is a better customer journey.


Looking for answers?
Start a new discussion or ask for help in our Q&A forum.
Go to forum