
Dynatrace now offers native support for OpenTelemetry logs, which opens up the ability to collect all your observability data in a single platform and benefit from unified observability with other OpenTelemetry signals. This complements existing Dynatrace support for collecting traces and metrics via OpenTelemetry Protocol (OTLP) and allows you to get actionable answers from log data with the powerful combination of Grail and Dynatrace Query Language.
Without native log support, overhead and complexity grow
OpenTelemetry, the Cloud Native Computing Foundation (CNCF) incubating project, introduced standards that enable companies to instrument, generate, and export telemetry data. When combined with out-of-the-box correlation, such telemetry data provides context-rich observability. Dynatrace has supported the OpenTelemetry project for years as a key contributor and contributed to its rise to a popular open source observability framework for cloud-native software. Many global enterprises have instrumented their code to emit traces, metrics, and logs in a standardized and vendor-neutral way using OpenTelemetry.
While ingestion of OpenTelemetry traces and metrics into Dynatrace is supported, companies often prefer to collect logs in the OpenTelemetry format. Earlier this year, OpenTelemetry announced that their logs API/SDK specification is stable, making it ripe for broader adoption. This enables unified observability because logs are indispensable for troubleshooting apps, monitoring infrastructure, auditing or investigating security incidents, tracking business events, and many other use cases.
Without such a holistic view of system behavior and performance, organizations typically need to invest in separate instrumentation and integration efforts for each telemetry type, which brings additional overhead, costs, and complexity.
Unify OpenTelemetry logs, traces, and metrics in Dynatrace
Dynatrace now includes full support for OpenTelemetry logs, which provides unified observability for organizations with vendor-neutral and open-source tech stacks. Our commitment to this open standard allows you to cover all three pillars of observability with minimal configuration effort because OpenTelemetry traces, metrics, and logs can be exported to Dynatrace using the same OTLP exporter.
By ingesting OTLP logs into Dynatrace, you can utilize the Grail™ data lakehouse and its massively-parallel processing analytics engine. This allows you to eliminate log forwarding and collection solutions, which not only add maintenance overhead and complexity but can also become bottlenecks in performance and log volume throughput.
With the added support of logs to OpenTelemetry traces and metrics, Dynatrace now gives you a unified and holistic overview of observability signals, with integrated linking of traces and logs. This enables you to connect the traces in your stack directly with root-cause information in logs. One customer recently shared why working with all telemetry signals together really makes sense for them.
Native support for OpenTelemetry (OTLP) logs also supports enterprises that have highly diverse technical architectures. While Dynatrace OneAgent® is often the preferred way of discovering and ingesting logs from traditional hosts or Kubernetes environments, there are certain environments for which OneAgent is not a viable option. As an alternative, OpenTelemetry lets you extend Dynatrace technology coverage with log data.
Generic ingest of log data now works with OTLP
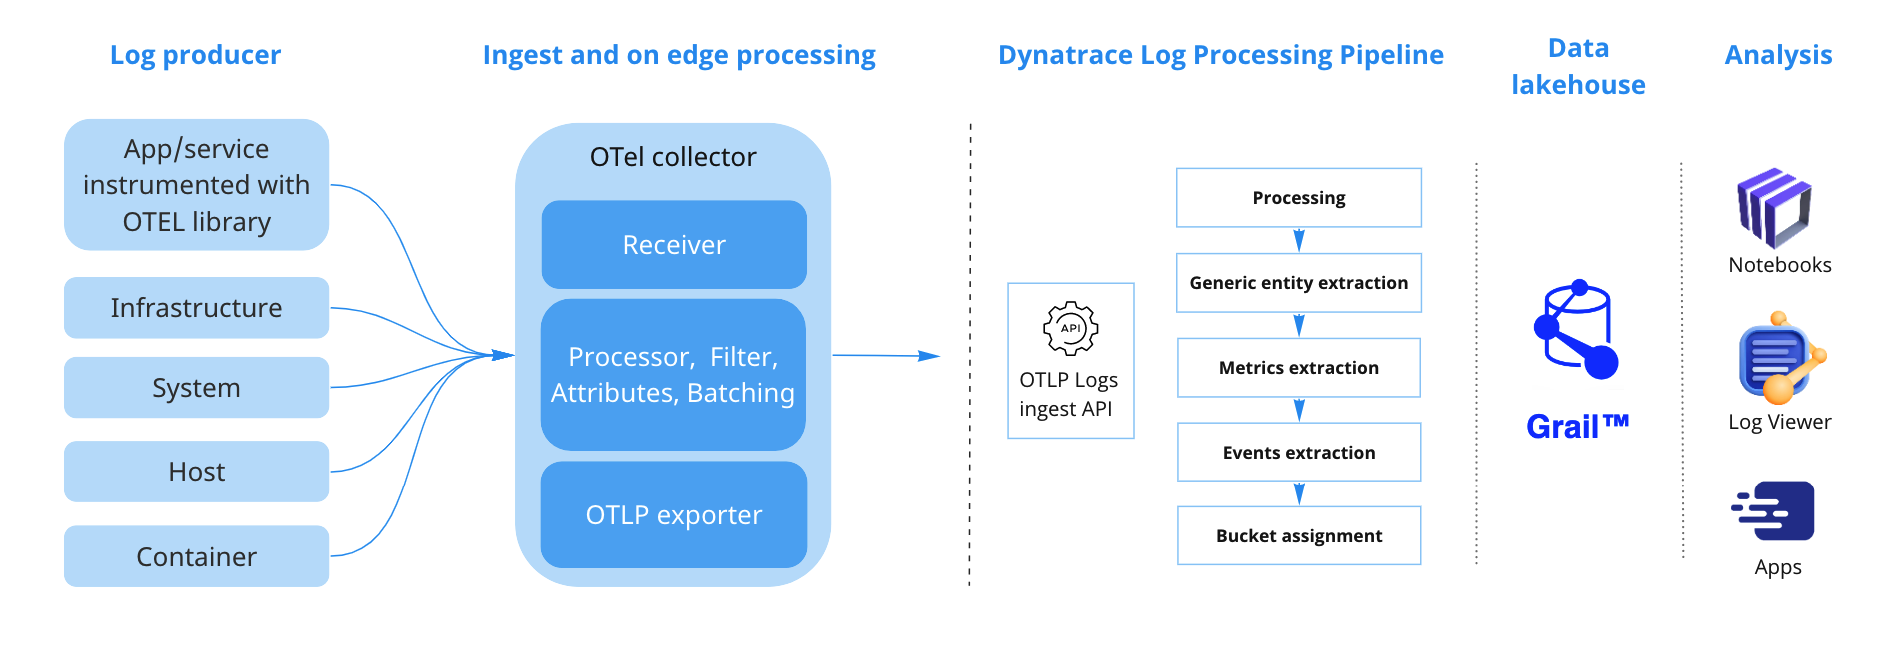
Ingesting OTLP logs is now supported via the OpenTelemetry Logs Ingest API. In SaaS deployments, you can use this approach to ingest log data into Grail and analyze it via Log Management & Analytics in your environment. The same API is also available for Log Monitoring Classic for Dynatrace Managed deployments (via an Environment ActiveGate).
All you need to do is configure your OpenTelemetry collector or any other OTLP log source to send logs to the OpenTelemetry Logs Ingest API endpoint.
Start using the full OpenTelemetry set today
- OpenTelemetry log ingest is supported in Dynatrace version 1.270 and Environment ActiveGate version 1.269
- Read more about OpenTelemetry logs in Dynatrace, ingest transformations and start ingesting logs over the API


Looking for answers?
Start a new discussion or ask for help in our Q&A forum.
Go to forum