
As applications transform to be more distributed across multiple cloud environments, it becomes more important—and more difficult—to make them observable. OpenTelemetry, the open source observability tool, has become the go-to standard for instrumenting custom applications to help software developers and operations teams understand what their software is doing and where it’s running into snags.
In the first part of this three-part series, The road to observability with OpenTelemetry demo part 1: Identifying metrics and traces with OpenTelemetry, we talked about observability and how OpenTelemetry works to instrument applications across different languages and platforms. We also introduced our demo app and explained how to define the metrics and traces it uses.
In this second part of our OpenTelemetry demo series, we’ll cover the details of OpenTelemetry configuration to set up our demo application. We’ll also cover how to instrument the services using OpenTelemetry, and some best practices for how to define spans and traces manually.
OpenTelemetry configuration: Setting up OpenTelemetry in our application
In part 1 of our series, we introduced the demo application: A web app that performs a distributed host/URL availability check and is made up of two parts:
- a PHP frontend
- a JavaScript agent running on Node.js
We also defined the metrics and traces for our demo application using OpenTelemetry.
This gives us two individual applications (PHP and JavaScript), each of which is responsible for its own OpenTelemetry reporting. Now, in part 2, we need to configure both separately to work with OpenTelemetry.
Let’s start with PHP first.
OpenTelemetry configuration for PHP
For PHP, we’ll be using Composer, the PHP dependency manager, to install two packages, open-telemetry/opentelemetry and its dependency php-http/guzzle7-adapter. These packages install OpenTelemetry and the libraries it needs.
Let’s run the following two commands from within the application’s main directory:
composer require php-http/guzzle7-adapter
composer require open-telemetry/opentelemetry
Now we’ll add the file otel.php to our application’s main directory and save the following content. This code essentially initializes OpenTelemetry and provides us with access to an OpenTelemetry tracer and meter instance.
<?php
declare(strict_types=1);
require __DIR__ . '/vendor/autoload.php';

use Monolog\Handler\StreamHandler;
use Monolog\Logger;
use OpenTelemetry\Contrib\Otlp\OtlpHttpTransportFactory;
use OpenTelemetry\Contrib\Otlp\SpanExporter;
use OpenTelemetry\SDK\Trace\SpanProcessor\SimpleSpanProcessor;
use OpenTelemetry\SDK\Trace\TracerProvider;
use OpenTelemetry\SDK\Resource\ResourceInfoFactory;
use OpenTelemetry\SDK\Resource\ResourceInfo;
use OpenTelemetry\SDK\Common\Attribute\Attributes;
use OpenTelemetry\API\Trace\Propagation\TraceContextPropagator;
use OpenTelemetry\SemConv\ResourceAttributes;

use OpenTelemetry\SDK\Metrics\MeterProvider;
use OpenTelemetry\Contrib\Otlp\MetricExporter;
use OpenTelemetry\SDK\Common\Time\ClockFactory;
use OpenTelemetry\SDK\Metrics\MetricReader\ExportingReader;

$baseURL = 'https://[ENVIRONMENT_ID].live.dynatrace.com';
$traceURL = $baseURL . '/api/v2/otlp/v1/traces';
$metricsURL = $baseURL . '/api/v2/otlp/v1/metrics';
$apiKey = '[API_KEY]';


// Set up trace environment

$transport = (new OtlpHttpTransportFactory())->create($traceURL, 'application/x-protobuf', [ 'Authorization' => 'Api-Token ' . $apiKey ]);

$exporter = new SpanExporter($transport);

$resource = ResourceInfoFactory::merge(
ResourceInfo::create(Attributes::create([ResourceAttributes::SERVICE_NAME => 'php-backend']), ResourceAttributes::SCHEMA_URL),
ResourceInfoFactory::defaultResource()
);

$tracerProvider =  new TracerProvider(new SimpleSpanProcessor($exporter), null, $resource);
$tracer = $tracerProvider->getTracer('io.opentelemetry.contrib.php');

$tracePropagator = TraceContextPropagator::getInstance();


// Set up metrics environment

$reader = new ExportingReader(
new MetricExporter((new OtlpHttpTransportFactory())->create($metricsURL, 'application/x-protobuf', [ 'Authorization' => 'Api-Token ' . $apiKey ])),
ClockFactory::getDefault()
);

$meterProvider = MeterProvider::builder()->setResource($resource)->addReader($reader)->build();

$meter = $meterProvider->getMeter('io.opentelemetry.contrib.php');
For $baseURL and $apiKey, enter the values for the Dynatrace trial instance we set up in Part 1, which will receive the telemetry data from our application.
The last thing to do is to include (or “require”) otel.php in the application so it starts gathering and sending the instrumentation data to our application:
require('otel.php');
Let’s continue with the OpenTelemetry configuration for Node.js next.
OpenTelemetry configuration for JavaScript / Node.js
Similar to our previous example with PHP, we’ll use the Node.js package manager “npm” to get the necessary dependencies.
npm install \
  @opentelemetry/api \
  @opentelemetry/exporter-metrics-otlp-proto \
  @opentelemetry/exporter-trace-otlp-proto \
  @opentelemetry/instrumentation \
  @opentelemetry/instrumentation-http \
  @opentelemetry/instrumentation-net \
  @opentelemetry/resources \
  @opentelemetry/sdk-metrics \
  @opentelemetry/sdk-trace-node \
  @opentelemetry/semantic-conventions
With that, all the necessary libraries should be available to our application, and we can initialize them for later use.
Next, we need to add the following lines to `otel.js` to configure OpenTelemetry to gather the telemetry data and send it to our Dynatrace back end.
const opentelemetry = require("@opentelemetry/api");
const { Resource } = require("@opentelemetry/resources");
const { SemanticResourceAttributes } = require("@opentelemetry/semantic-conventions");
const { NodeTracerProvider } = require("@opentelemetry/sdk-trace-node");
const { registerInstrumentations } = require("@opentelemetry/instrumentation");
const { ConsoleSpanExporter, BatchSpanProcessor } = require("@opentelemetry/sdk-trace-base");
const { OTLPTraceExporter } = require("@opentelemetry/exporter-trace-otlp-proto");
const { OTLPMetricExporter } = require("@opentelemetry/exporter-metrics-otlp-proto");
const { MeterProvider, PeriodicExportingMetricReader, ConsoleMetricExporter, AggregationTemporality } = require('@opentelemetry/sdk-metrics');
const { HttpInstrumentation } = require('@opentelemetry/instrumentation-http');
const { NetInstrumentation } = require('@opentelemetry/instrumentation-net');


registerInstrumentations({
  instrumentations: [new HttpInstrumentation(), new NetInstrumentation()],
});

const resource =
  Resource.default().merge(
    new Resource({
      [SemanticResourceAttributes.SERVICE_NAME]: "js-agent",
      [SemanticResourceAttributes.SERVICE_VERSION]: "0.1.0",
    })
  );


// Set up trace provider
const provider = new NodeTracerProvider({
    resource: resource,
});

const exporter = new OTLPTraceExporter({
    url: "https://[ENVIRONMENT_ID].live.dynatrace.com/api/v2/otlp/v1/traces",
    headers: { Authorization: 'Api-Token [API_KEY]' }
});

const processor = new BatchSpanProcessor(exporter);
provider.addSpanProcessor(processor);

provider.register();


// Set up metric provider
const metricExporter = new OTLPMetricExporter({
    url: "https://[ENVIRONMENT_ID].live.dynatrace.com/api/v2/otlp/v1/metrics",
    headers: { Authorization: 'Api-Token [API_KEY]' },
    temporalityPreference: AggregationTemporality.DELTA
});

const metricReader = new PeriodicExportingMetricReader({
    exporter: metricExporter,
    exportIntervalMillis: 3000
});
const meterProvider = new MeterProvider({ resource: resource });
meterProvider.addMetricReader(metricReader);

// Set this MeterProvider to be global to the app being instrumented.
opentelemetry.metrics.setGlobalMeterProvider(meterProvider);
The initialization is pretty similar to what we did earlier with PHP, and with OpenTelemetry configuration now set up we can easily get a reference with require("@opentelemetry/api"). With that reference, we can then use .trace.getTracer() and .metrics.getMeter() to get anywhere in our application a tracer and a meter object, respectively.
Lastly, we need to preload otel.js when we start our application. Fortunately, Node.js comes with a handy --require command-line parameter (https://nodejs.org/api/cli.html#-r---require-module), which will do exactly that.
./node --require ./otel.js ./app-main.js
With this call, Node.js will start our application in the usual way but also preload the indicated file (otel.js), which ensures our OpenTelemetry initialization runs first.
Now that we have successfully configured and initialized the OpenTelemetry libraries let’s have a look at how we can actually use them.
OpenTelemetry configuration: Instrumenting the applications
Before we delve into the nitty-gritty of instrumentation, a quick overview of what it is.
By *instrumenting* a system (for example, an application), you enhance its capabilities to be able to send the desired telemetry data. This can happen either automatically (automatic instrumentation)—if supported by the underlying runtime—or manually (manual instrumentation) with you extending your code base and defining which parts need to provide telemetry data.
Automatic instrumentation is the easiest way to introduce observability, as OpenTelemetry should automatically take care of everything. Unfortunately, that is when IT reality kicks in, because automatic instrumentation not only needs to be supported by the runtime backing your application (here, native code is notoriously difficult) but, to get full insight, the libraries used by the application need to be supported as well. For that reason, it is often necessary to employ manual instrumentation in addition to automatic instrumentation.
More on that coming up right now with PHP.
Instrumenting PHP
In general, OpenTelemetry does support automatic instrumentation on PHP. That being said, this part of the OpenTelemetry configuration is a bit tricky to set up and requires that you manually compile the instrumentation library for PHP. On top of that, it currently only supports a few out of the box. Anything else, and you have to resort to instrumenting your application manually. And that’s precisely what was necessary in our case.
But even though we couldn’t go fully automatic, the manual approach was still relatively simple. As mentioned during the setup, including `otel.php` gives us access to the $tracer and $meter variables. With that, it will be easy to instrument our application.
For spans, we simply create a new span with spanBuilder() and start it with startSpan(). Additionally, and optionally, we can make it the parent span for all future spans with activate().
For example, the following code block is responsible for resolving the IP address (if so necessary), and we wrapped it into a dns_lookup span and attached two attributes to the span.
$span = $tracer->spanBuilder('dns_lookup')->startSpan();

$isIP = ip2long($url['host']);
if (!$isIP)
{
    // HERE WE RESOLVE THE DNS NAME
}

$sp->setAttribute('lookup_required', !$isIP);
$sp->setAttribute('hosts', $hosts);
$sp->end();
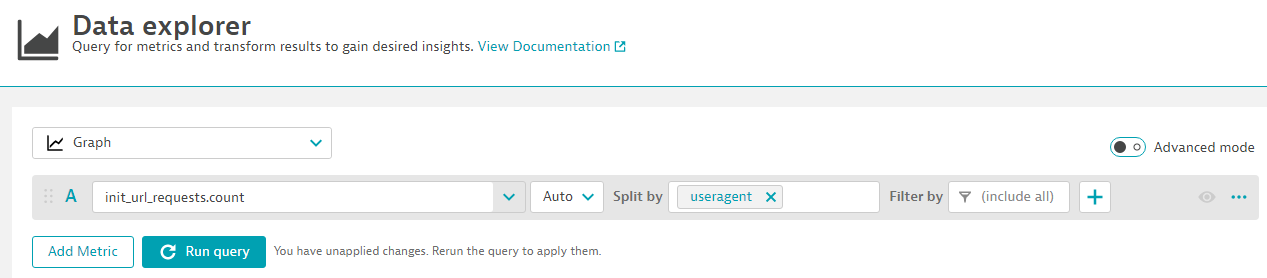
The same goes for $meter, which we use to create meter objects. In the following code, we created a counter object for incoming requests and added a user agent dimension, which will later allow us to split and group by user agents.
$counter = $meter->createCounter('init_url_requests');
$counter->add(1, [ 'useragent' => $_SERVER['HTTP_USER_AGENT'] ]);

$reader->collect();
That all worked pretty smoothly, and by identifying the code parts, which were relevant for traces and metrics, we were able to instrument our PHP frontend properly.
But hold on a second. The idea of observability is to be distributed and work across application boundaries, right? Absolutely right; this is where context propagation comes in.
Context propagation
The idea behind context propagation is to pass information about the current trace context (the trace and its currently active span) on to the third party we’re calling.
Typically, this is done as part of our actual request to that third party. In the case of HTTP (for example, a REST call), this usually means we add an additional HTTP header that contains the context information.
If we used automatic instrumentation, the library would actually do this out of the box, but as we’re doing it manually, we have to take care of this as well. Fortunately, it’s rather easy, and the $tracePropagator object we initialized in otel.php will help us with that.
// Add OpenTelemetry header
$traceContext = []; $contextData = [];
$tracePropagator->inject($traceContext);
foreach ($traceContext as $name => $value) $contextData[] = "$name: $value";
At this point, $contextData is a string array with all required HTTP headers, which we can simply pass under CURLOPT_HTTPHEADER to curl_setopt().
Once the third party receives the request (our JavaScript agent in this case), it will initialize its own context with the provided trace data. If your HTTP library is automatically instrumented, this should happen transparently. Otherwise, you’ll have to pass the header manually to the library.
Instrumenting JavaScript / Node.js
Fortunately, our JavaScript application was a bit easier to instrument, as we were able to use automatic instrumentation for a fair share of its functionality.
By passing instances of HttpInstrumentation and NetInstrumentation to registerInstrumentations during the setup, we already covered the parsing of the incoming context data (propagation), as well as basic trace data for the HTTP request itself and all subsequent network calls to the Net library.
All that’s left is to add traces and metrics to the parts which are not already automatically instrumented. For that, we first import the OpenTelemetry API into our application.
javascript
const OTAPI = require("@opentelemetry/api");


which will then allow us to easily get trace and meter providers.


const tracer = OTAPI.trace.getTracer('my-service-tracer');
const meter = OTAPI.metrics.getMeter('my-service-meter');
With those, we can then create spans. For example, here we took an excerpt from our header parser.
const parse_span = tracer.startSpan('parsing_header');

// HERE WE PARSE OUR HTTP HEADER
// const response_code = .....
// const headers = .....

parse_span.setAttribute('status_code', response_code);
parse_span.setAttribute('headers', JSON.stringify(headers));

parse_span.end();
For metrics, one of the values we are monitoring with a gauging instrument is the memory usage via process.memoryUsage().heapUsed.
const gauge = meter.createObservableGauge('app.memory');
gauger.addCallBack((res) => {
    res.observe(process.memoryUsage().heapUsed);
});
What to trace? Best practices for defining traces and spans manually
When you’re using automatic instrumentation, the platform and the libraries will already cover a fair share of tracing. But whenever you want or have to go down the manual road, you’ll need to decide where spans make the most sense for your use case.
Common examples of traces and spans include:
- Network requests
- RPC calls (for example, REST, SOAP)
- Database queries
Especially for RPC calls, you’ll also want to take into consideration context propagation to allow the other service to continue your trace and provide its own telemetry data, as part of the trace, to the back end. That is, of course, if that service has also been instrumented and configured for the same back end as yours.
In addition to the examples mentioned, you may also find it interesting to wrap any distinct parts of your business logic with (active) spans to have clear time markers and an accurate call hierarchy. Also, pay attention to span attributes, as they can be extremely useful in your backend whenever you analyze and debug a trace.
Tip: Span attributes
Span attributes provide an extremely helpful mechanism to annotate spans with task-specific information.
So, what have we learned so far?
When we started out, neither of our applications knew anything about telemetry. While our JavaScript agents had a fair amount of classic logging, it was really just the usual log messages containing the current state at a certain point in the code. To tie these lines together, we originally introduced a unique request identifier, which was part of each log line.
On the other hand, the front end being a “typical” PHP application, did not have extensive logging to begin with but mostly relied on status codes sent back to the client.
All of that actually worked pretty well, but if there were issues, it often required extensive familiarity with the system to know where and what to debug. Introducing OpenTelemetry opened a whole new world in this regard.
By making our system observable, we immediately had detailed insight into what was going on at any given moment. With traces, we’re able to fully follow the client experience from start to finish. We opted for one global span, which encompasses the whole request and then subsequent child spans for major tasks, such as duplicate checks, setting up response objects, the REST calls to the agents, as well as for the individual steps within the agent logic. The distributed and dynamic nature of context propagation ensured that all spans (across systems) were properly linked together. Metrics, on the other hand, allow us to visualize key figures, such as the number of concurrent requests, traffic generated by the agents, the statistical distribution of error codes, and the number of possibly failed agent requests.
All of these things would have been either impossible or a lot more difficult with a traditional logging approach – or it would have required a custom reporting engine. With observability, these features all come out of the box.
Enabling your systems to support telemetry will significantly enhance your ability to support and troubleshoot performance and code issues.
With OpenTelemetry, you have a rich and open ecosystem of telemetry data and a platform with standardized interfaces and tools to adopt and implement telemetry in an interoperable and vendor-agnostic fashion.
But wait, there’s more
There is one way to make the deal even sweeter, and that is integrating OpenTelemetry with Dynatrace OneAgent and the software intelligence platform powered by Davis AI. With such a setup, you’ll have a no-config deployment, and your OpenTelemetry instances will “automagically” report to Dynatrace without you having to configure exporters. OneAgent will do the work for you—automatically and transparently.
That’s exactly what we’re going to have a look at in the third and final part of our series, The road to observability demo part 3: Collect, instrument, and analyze telemetry data automatically with Dynatrace.
Observability Clinic, OpenObservabilty without boundaries with Dynatrace
To learn more about how Dynatrace connects all of your observability data from any source, join us for the on-demand Observability Clinic with Dynatrace observability expert, Henrik Rexed.


Looking for answers?
Start a new discussion or ask for help in our Q&A forum.
Go to forum