
The freedom to choose your observability stack matters. Whether you're standardizing on OpenTelemetry (OTel) for maximum flexibility and team autonomy, future-proofing your architecture, or simply gaining control over your telemetry pipeline, the choice is yours to make. But here's the reality check every engineering team faces: collecting telemetry data is just the beginning. The real question is, what happens next?
OpenTelemetry excels at capturing data from any environment and service: traces flowing from microservices, metrics streaming from containers and infrastructure hosts, and logs capturing the application and service lifecycles. OTel does exactly what it was designed to do: standardize telemetry collection. But here’s what OpenTelemetry doesn’t do by design: unified observability that analyzes that data, correlates it across services, or turns it into actionable, intelligent insights.
This is where most organizations hit a wall and require lots of expert knowledge. Organizations today have more observability data than ever before, but somehow less visibility into what’s actually happening in their systems. Raw telemetry data becomes a burden rather than an asset. Engineers spend more time hunting through dashboards than solving actual problems.
This is the “analytics gap” that Dynatrace was built to solve, transforming your telemetry data from scattered signals into unified, AI-powered intelligence.
Why OpenTelemetry + Dynatrace changes everything
Here’s what makes this combination powerful: OpenTelemetry gives you standardized data collection. Dynatrace gives you intelligent analysis that goes far beyond the static dashboards and manual correlation work that other platforms require.
While many observability solutions leave it to you to build custom dashboards and manually connect the dots between your telemetry signals, Dynatrace transforms your OpenTelemetry data into insights that actually drive decisions. Your traces, metrics, and logs aren’t just stored; they’re automatically correlated, analyzed, and contextualized as they flow through Dynatrace OpenPipeline®.
When a trace shows latency spikes, you immediately see related log entries and metric anomalies automatically contextualized and correlated. Lightning-fast queries via Dynatrace Grail® data lakehouse process millions of spans at the speed of thought, making observability accessible to your entire team, not just the experts who know how to build complex queries and visualizations.
The result? Your OpenTelemetry investment becomes a competitive advantage, not just another data collection project that requires a team of dashboard architects to maintain.
Complete OpenTelemetry coverage
Here’s how Dynatrace helps you to get the most out of your telemetry data, without requiring additional agents or complex configurations:
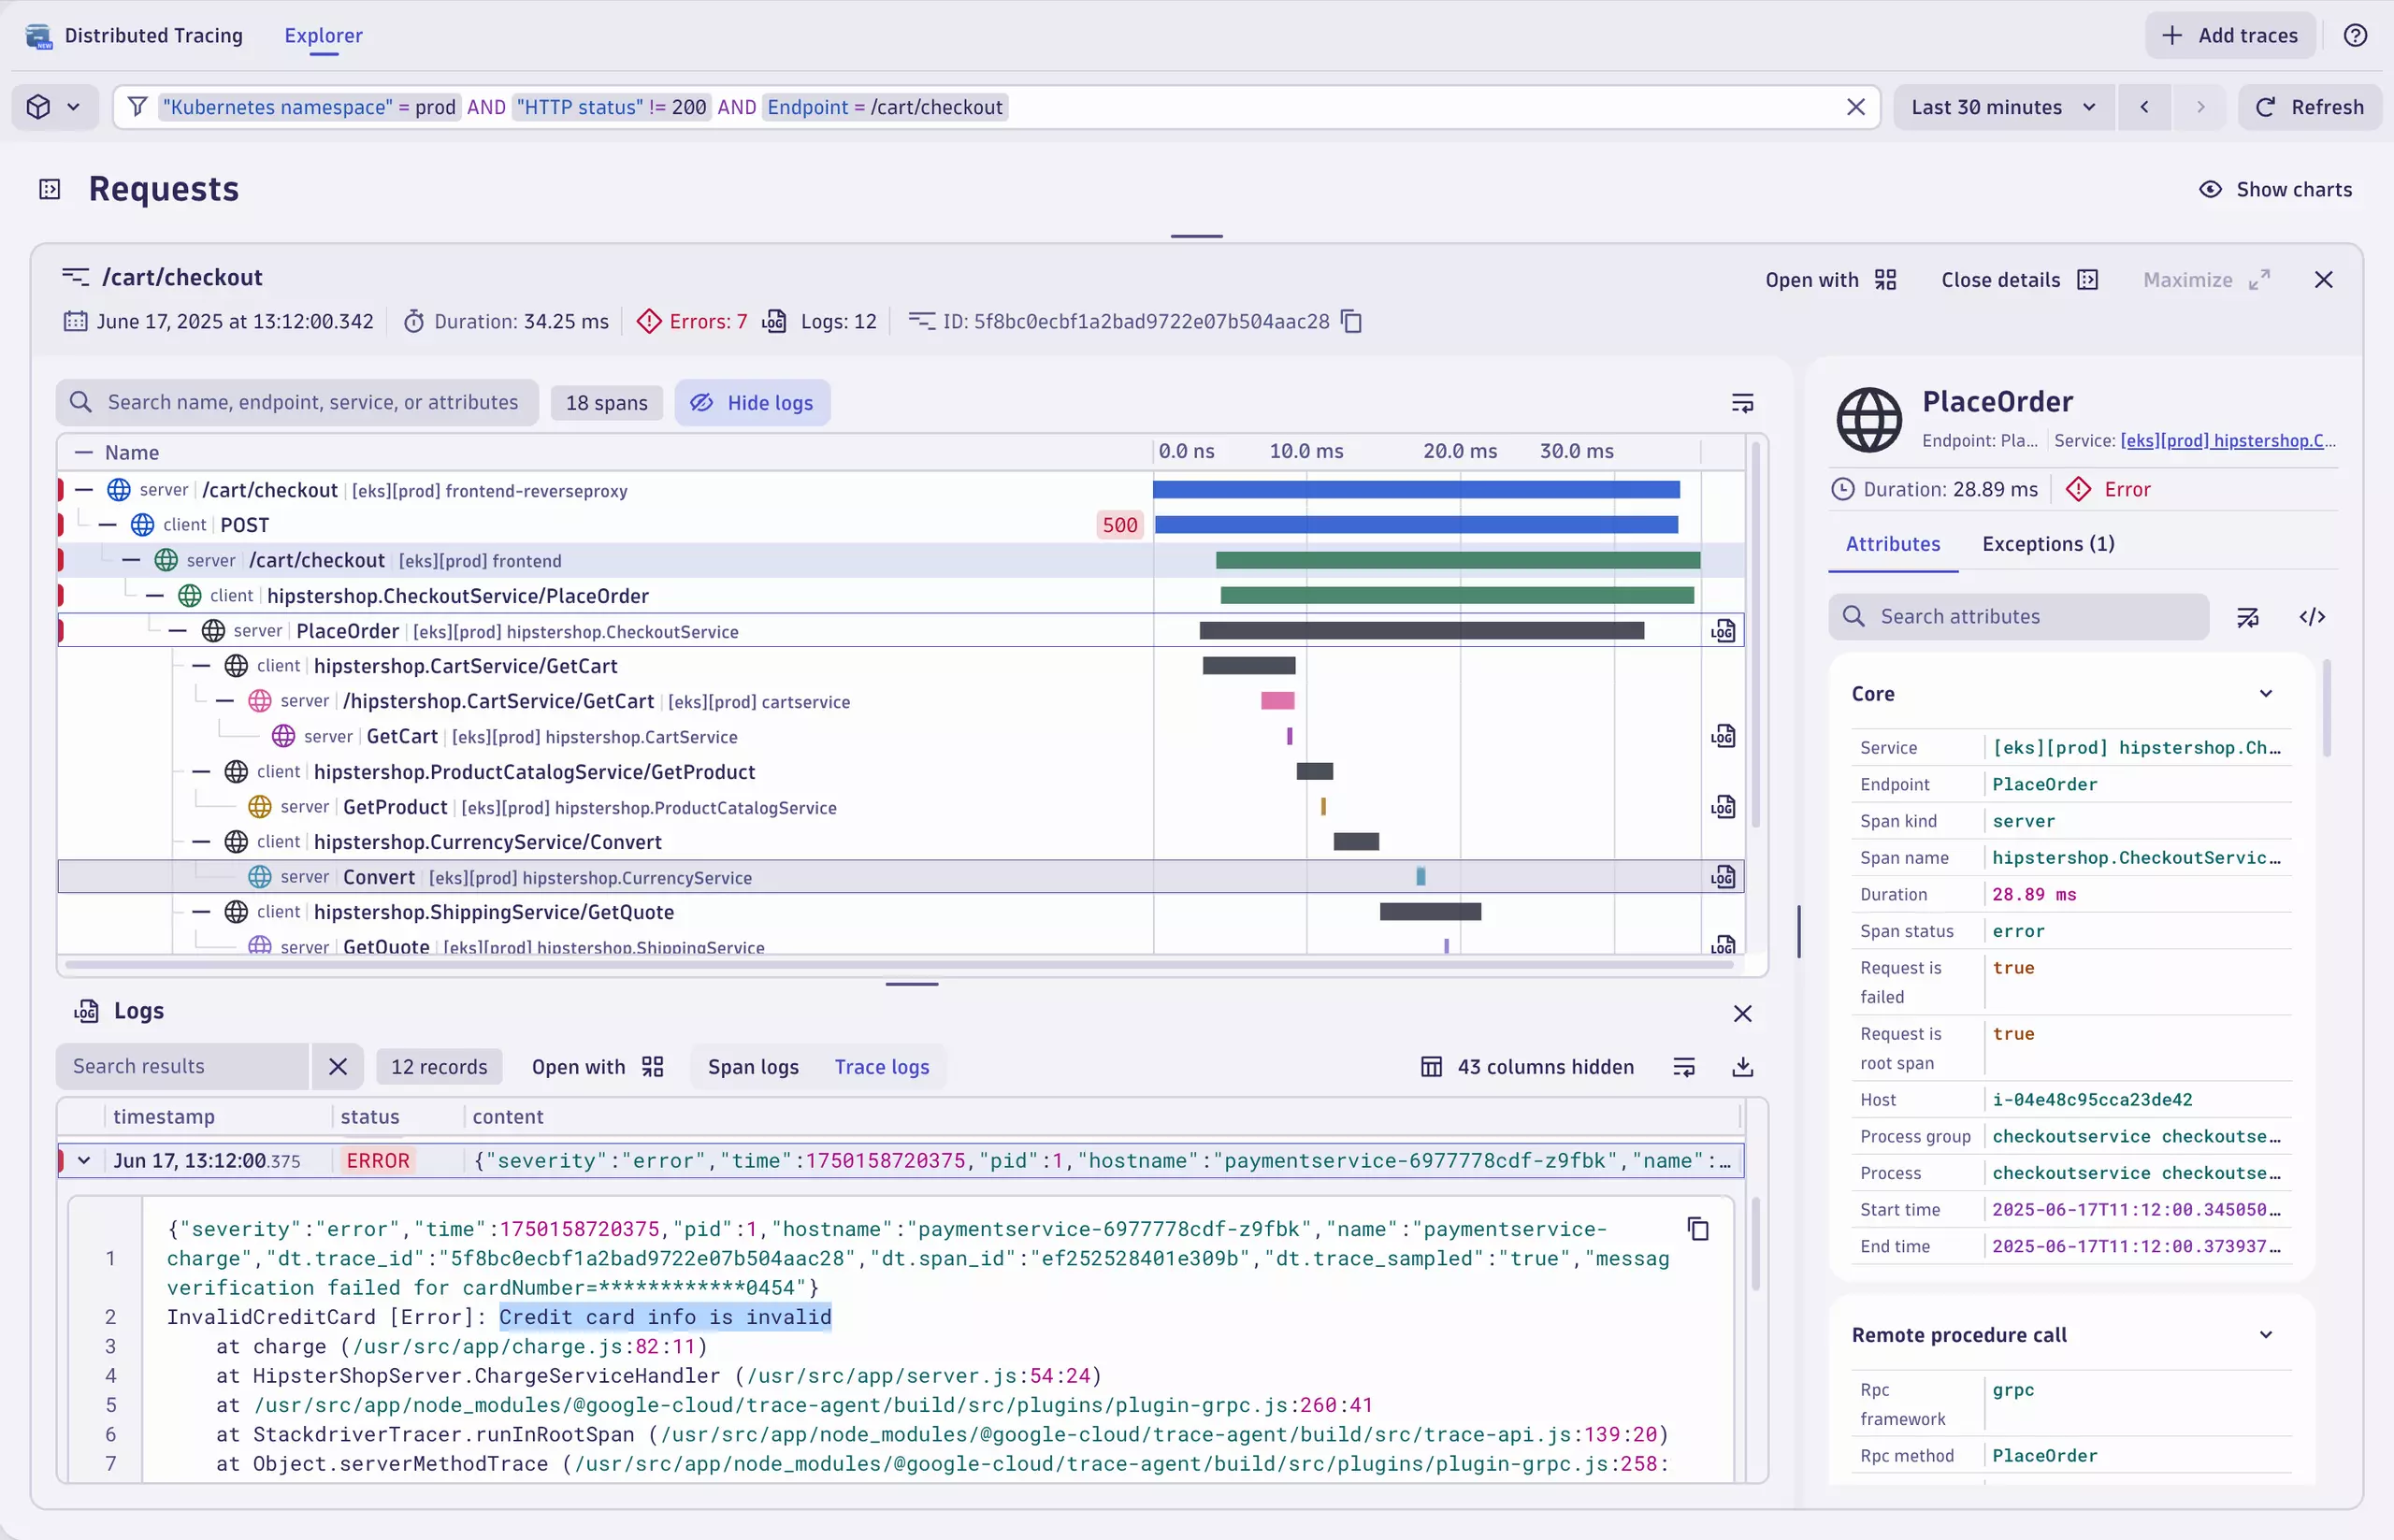
Distributed tracing excellence
Native OpenTelemetry tracing delivers superior span and trace processing with dynamic visualization tools that transform complex distributed architectures into complete end-to-end visibility. But it doesn’t stop there; all your telemetry signals (logs, traces, and metrics) correlate seamlessly, giving you clear, actionable insights within the full context of your traces and services. Get simple answers to advanced questions by expanding your investigations with DQL for powerful analytics, including correlation of logs and traces.
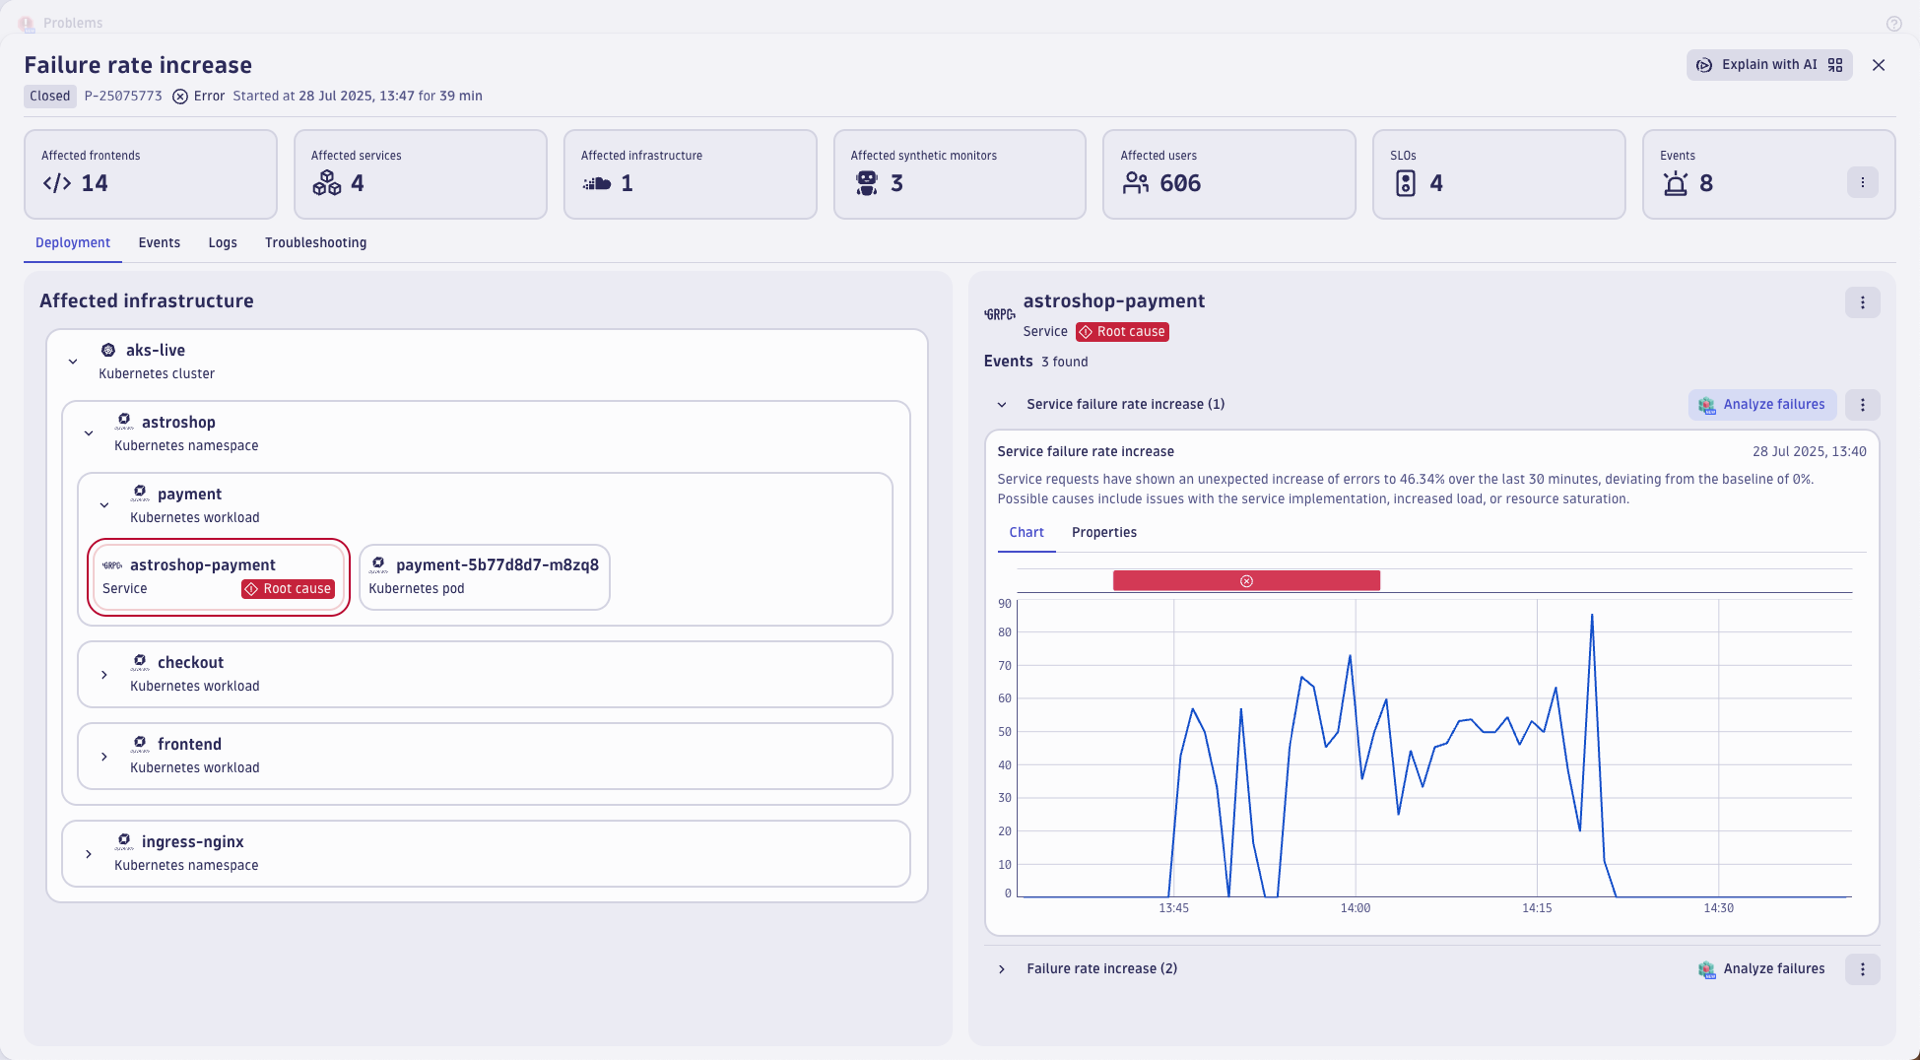
Service monitoring that understands your Architecture
Comprehensive service health monitoring built on OpenTelemetry standards. Dynatrace provides intelligent service analysis, anomaly detection, and visualization that work seamlessly with your OpenTelemetry-instrumented applications. Our service monitoring goes beyond simple health checks.
When issues arise, you see exactly which services are affected and how problems cascade through your architecture, all without manual tagging, configuration, or service discovery setup with YAML files.
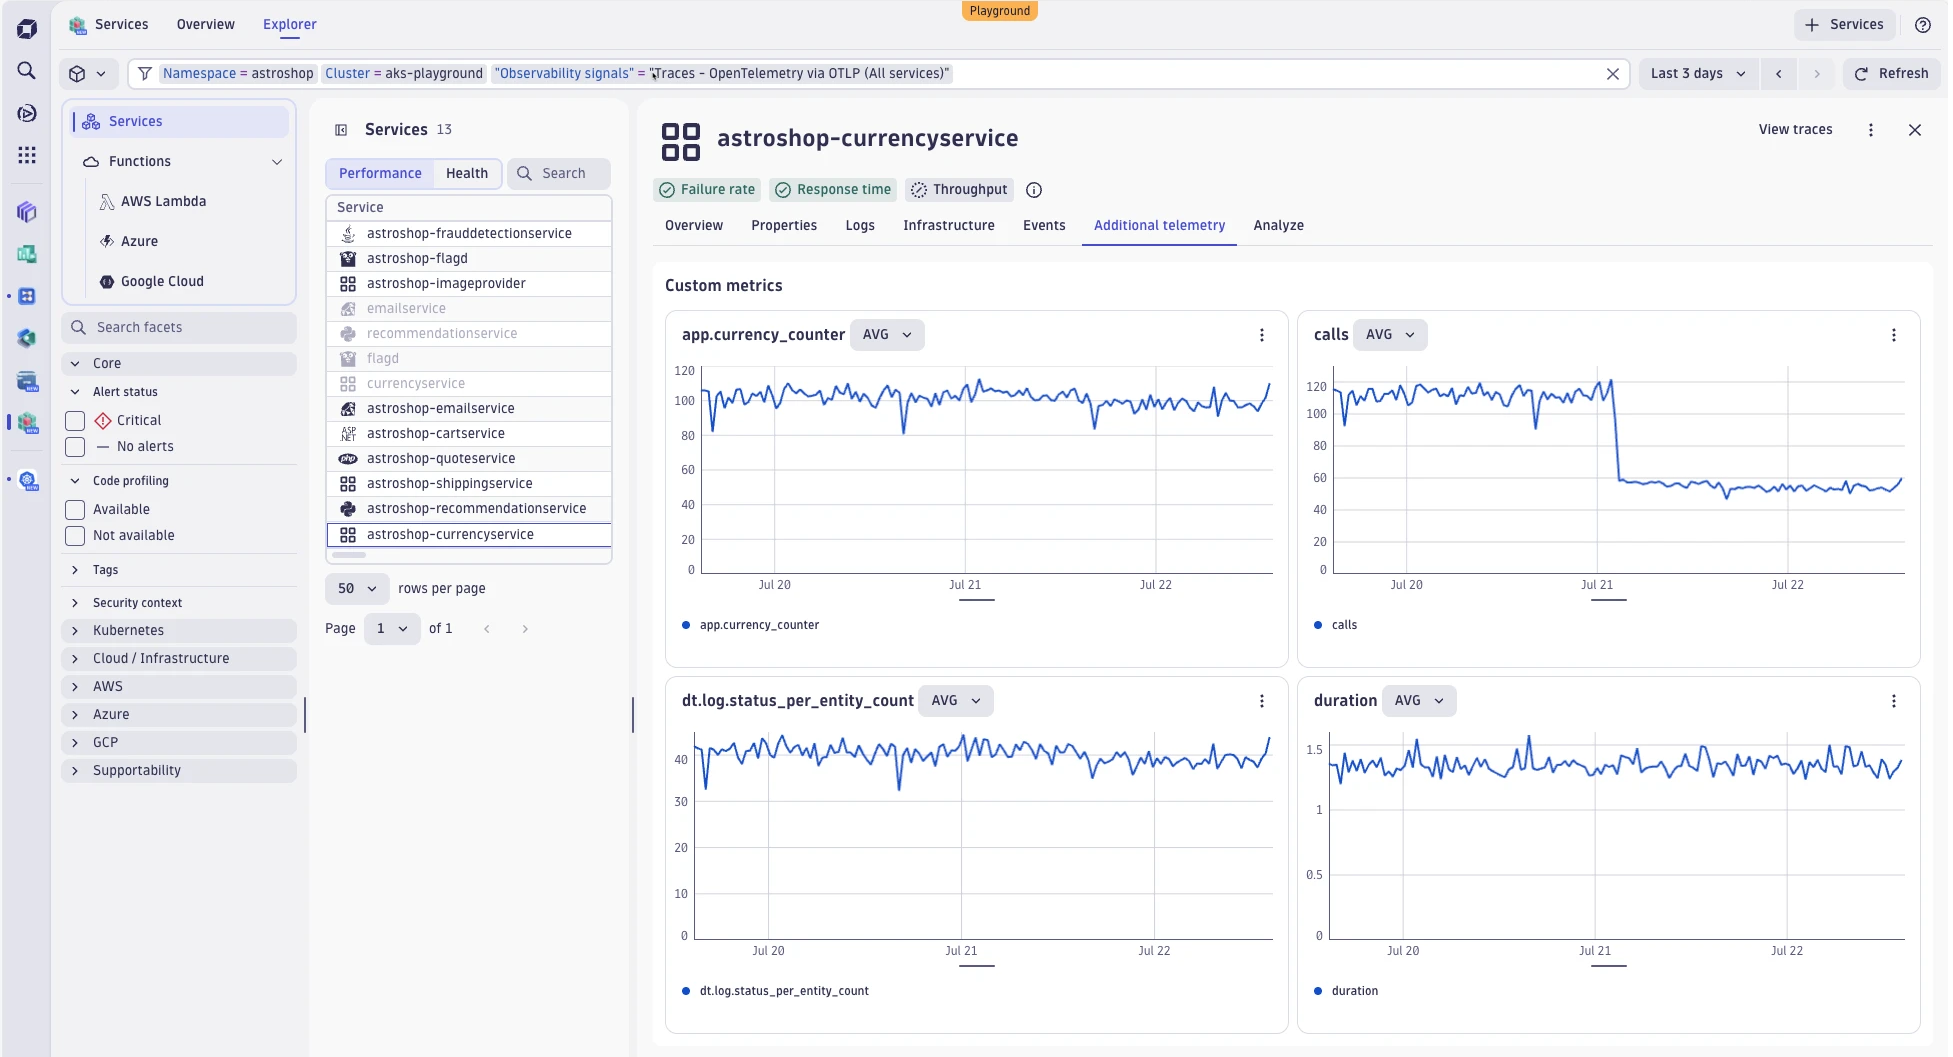
Intelligent metrics with full context
You get flexible metric ingestion for custom business metrics and standard application performance indicators. Your metrics connect directly to the services and traces that generated them. But here’s where Dynatrace takes it further: we allow you to unify all your OpenTelemetry signals into comprehensive service intelligence. Instead of analyzing metrics in isolation, you see how they connect to actual service behavior, request flows, and application logs. Every metric becomes part of a complete service story.
Complete log processing
Your OpenTelemetry logs are transformed from noise to narrative. Instead of searching through endless log streams and manually created dashboards, Dynatrace supports a comprehensive log ingestion and analysis pipeline, allowing you to go big with Dynatrace.
Every log event becomes part of a larger story about user journeys, interactions, services, and app behavior, all focused on your desired business outcomes and incident investigations.
Here’s where it gets powerful: you automatically get additional contextual enrichment when you direct all your telemetry signals to Dynatrace. By creating bi-directional relationships between logs and traces, where logs provide context to traces and traces illuminate relevant logs, Dynatrace evolves troubleshooting from detective power-user work into AI-driven, streamlined, and intuitive investigations.

Video: See the full story behind every trace with correlated logs.
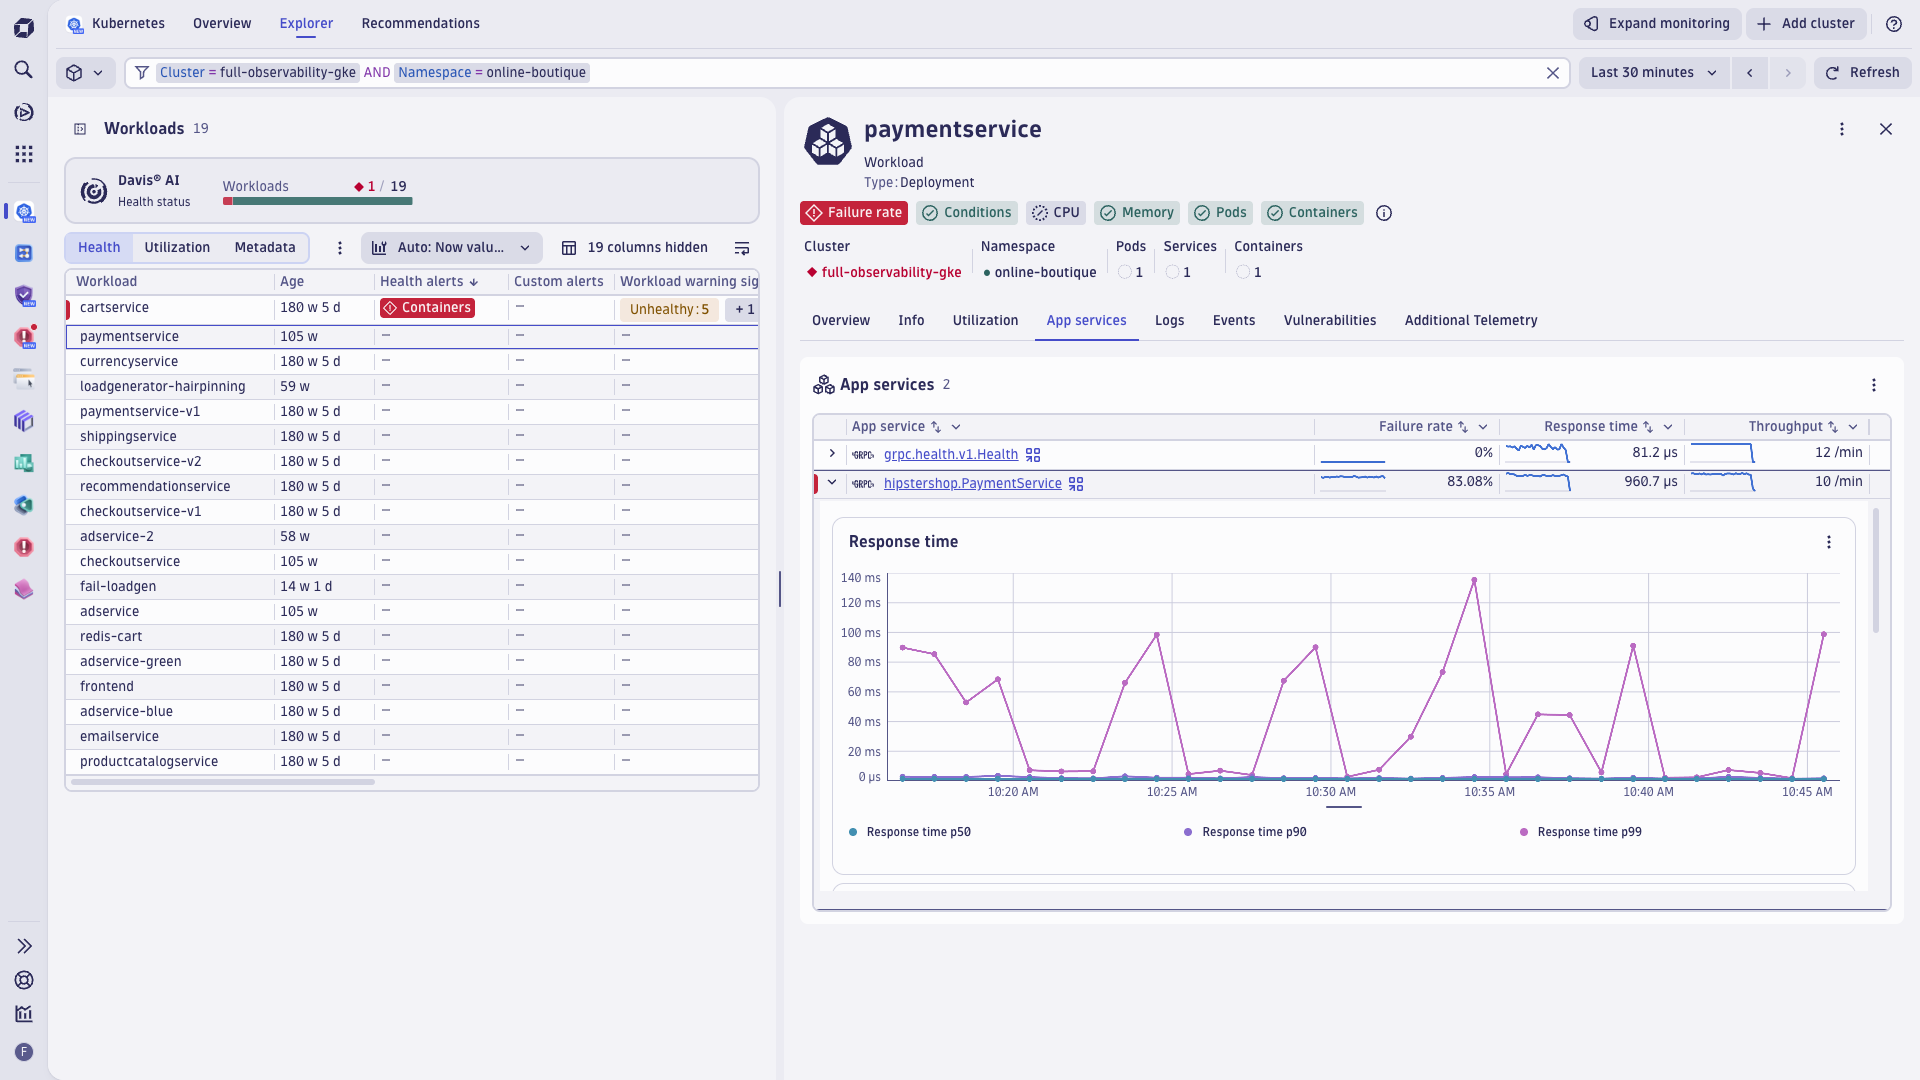
Kubernetes native support
For teams running OpenTelemetry in Kubernetes, Dynatrace delivers enterprise-grade support that scales with your cloud native operations. Native Kubernetes handling of spans, metrics, and logs from your Kubernetes OpenTelemetry deployments automatically collects Kubernetes context for automated enrichment: namespace, cluster, and workload relationships, all without any additional instrumentation. Your existing Kubernetes labels, AWS tags, and Azure tags become first-class filtering dimensions for all OpenTelemetry data, enabling automatic cost attribution and comprehensive data permissions using your existing RBAC patterns.
The result is that your OpenTelemetry observability inherits the same operational patterns, security boundaries, and cost structures as your Kubernetes infrastructure.
Why this matters for your team
Every organization adopting OpenTelemetry faces the same challenge: turning data collection into intelligent insights. The engineering teams that succeed are those that choose analytics platforms built specifically for OpenTelemetry data.
Dynatrace transforms your OpenTelemetry investment from a data collection project into a competitive advantage. We meet you where you are. We respect your choice to standardize OpenTelemetry by simplifying its operational complexity and enhancing it with analytics that actually deliver value.
Ready to transform your OpenTelemetry data?
Open standards have clear benefits. Industry standardization makes it easier to make sense of data coming from multiple different sources, whether it’s traces, metrics, logs, or telemetry from third-party tools. Your analytics platform can deliver intelligent insights across your entire technology stack. Your OpenTelemetry investment deserves analytics that reveal its full potential.
- Want to explore specific OpenTelemetry capabilities with Dynatrace? Try them out on the Dynatrace Playground
- Boost your productivity with these quick video guides for service owners working with OpenTelemetry:
Video: Easy access to your OTel Logs and Traces

Video: Analyze Service Failure from OTel Data
Video: Easy access to your OTel & Prometheus Service Metrics

Join us at OpenSource Summit. We’ll be in Amsterdam August 25-27. Stop by our booth to see the magic in action!


Looking for answers?
Start a new discussion or ask for help in our Q&A forum.
Go to forum