
Organizations are depending more on distributed architectures to provide application services. This trend is prompting advances in both observability and monitoring. But exactly what are the differences between observability vs. monitoring?
Understanding when something goes wrong along the application delivery chain is essential so you can identify the root cause and correct it before it impacts your business. Monitoring and observability provide a two-pronged approach. Monitoring supplies situational awareness, and observability helps pinpoint what’s happening and what to do about it.
To better understand of observability vs. monitoring, we’ll explore the differences between the two. Then we’ll look at how you can best utilize both to improve business outcomes.
Monitoring vs. observability
First, let’s define what we mean by observability and monitoring.
What is meant by monitoring?
By textbook definition, monitoring is the process of collecting, analyzing, and using information to track a program’s progress toward reaching its objectives and to guide management decisions. Monitoring focuses on watching specific metrics. Logging provides additional data but is typically viewed in isolation of a broader system context.
What is meant by observability?
Observability is the ability to understand a system’s internal state by analyzing the data it generates, such as logs, metrics, and traces. Observability helps teams analyze what’s happening in context across multicloud environments so you can detect and resolve the underlying causes of issues.
What is the difference between observability and monitoring?
Monitoring is capturing and displaying data, whereas observability can discern system health by analyzing its inputs and outputs. For example, we can actively watch a single metric for changes that indicate a problem — this is monitoring. A system is observable if it emits useful data about its internal state, which is crucial for determining the root cause.
What are the similarities between observability and monitoring?
Observability and monitoring are closely related concepts in systems and software engineering. Both aim to provide insights into the health, performance, and behavior of a system. They utilize data collection, analysis, and visualization techniques to enable proactive detection and troubleshooting of issues. Ultimately, they empower engineers to ensure system reliability, performance optimization, and efficient resource utilization.
Between observability and monitoring, which is better?
So how do you know which model is best for your environments?
Monitoring typically provides a limited view of system data focused on individual metrics. This approach is sufficient when systems failure modes are well understood. Because monitoring tends to focus on key indicators such as utilization rates and throughput, monitoring indicates overall system performance. For example, when monitoring a database, you’ll want to know about any latency when writing data to a disk or average query response time. Experienced database administrators learn to spot patterns that can lead to common problems. Examples include a spike in memory utilization, a decrease in cache hit ratio, or an increase in CPU utilization. These issues may indicate a poorly written query that needs to be terminated and investigated.
Conventional database performance analysis is simple compared to diagnosing microservice architectures with multiple components and an array of dependencies. Monitoring is helpful when we understand how systems fail, but as applications become more complex, so do their failure modes. It is often not possible to predict how distributed applications will fail. By making a system observable, you can understand the internal state of the system and from that, you can determine what is not working correctly and why.
However, correlations between a few metrics often do not diagnose incidents in modern applications. Instead, these modern, complex applications require more visibility into the state of systems, and you can accomplish this using a combination of observability and more powerful monitoring tools.
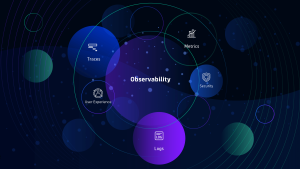
The “three pillars” of observability and beyond
As mentioned earlier, traditionally, observability is understanding what’s happening inside a system from its logs, metrics, and traces. Modern observability includes these three original pillars along with user experience and security. Systems are observable when they generate and readily expose the type of data that enables you to evaluate the state of the system. Here’s a closer look at logs, metrics, distributed traces, user experience, and security.
- Logs include application- and system-specific data that details the operations and flow of control within a system. Log entries describe events, such as starting a process, handling an error, or simply completing some part of a workload. Logging complements metrics by providing context for the state of an application when metrics are captured. For example, log messages might indicate a large percentage of errors in a particular API function. At the same time, metrics on a dashboard are showing resource exhaustion issues, such as a lack of available memory. Metrics may be the first sign of a problem, but logs can provide details about what is contributing to the problem and how it impacts operations.
- Metrics in this context are sets of measurements taken over time, and there are a few types:
- Gauge metrics measure a value at a specific point in time, such as the CPU utilization rate at the time of measurement.
- Delta metrics capture differences between previous and current measurements, such as a change in throughput since the last measurement.
- Cumulative metrics capture changes over time — for example, the number of errors returned by an API function call in the last hour.
- Distributed tracing is the third pillar of observability and provides insights into the performance of operations across microservices. An application may depend on multiple services, each with its own set of metrics and logs. Distributed tracing is observing requests as they move through distributed cloud environments. In these complex systems, traces highlight any problems that can happen with the relationships among services.
- User experience considers how users interact with the front end; understanding where time is spent and which actions are critical helps prioritize and identify users’ needs. This is essential when the goal is to deliver an exceptional customer experience. This important piece of the puzzle takes into consideration things like revenue, conversions, and customer engagement. All of these are important inputs to get a full understanding of the application landscape.
- Security is an essential component in understanding the internal state of a system. Organizations are shifting away from siloed security teams and taking a DevSecOps approach. This includes security at each stage of the SDLC. So should it be in observability, where security is one element that affects the health, performance, and customer experience of an application.
True observability, however, relies on more data than just key indicators.
Why monitoring and observability need a next-gen approach
When trying to effectively monitor, manage, and improve complex microservices-based applications, observability and monitoring are both vital. Monitoring and observability represent a continuum from basic telemetry of single servers to profound insights about complete applications and dependencies.
Many organizations start with monitoring and realize these tools lack contextual insights. Context is critical to understanding why problems exist and how they impact the business. Organizations look to observability to provide the data they need for contextual analysis. Understanding the problem means they can understand the root cause and its effects.
DevOps practitioners need help to maintain highly available and scalable applications. That’s because these complex, interdependent systems behave in unpredictable ways and issues originate from sources that are often not apparent. Practices and tools that worked when we built monolithic applications simply can’t handle the level of data distributed environments generate. They don’t ingest enough data or provide enough insight into the state of applications to understand how to correct problems quickly. Luckily, some tools and practices address these challenges.
An automatic and intelligent approach to monitoring and observability
An advanced software intelligence solution like Dynatrace automatically collects and analyzes highly scalable data to make sense of these sprawling multicloud environments. Dynatrace’s causal AI engine, Davis, sifts through massive volumes of disparate, high-velocity data streams, and analyzes them through a unified interface. This single source of truth tears down information silos that traditionally separate teams that perform different functions on many application components. This centralized, automatic approach eliminates the need for manual diagnostics. It also provides paths to remediation to keep the technology users rely on functioning smoothly.
Learn more about observability vs. monitoring
Check out this Dynatrace eBook!
Explore Dynatrace OpenTelemetry observability
Register now for the on-demand power demo!


Looking for answers?
Start a new discussion or ask for help in our Q&A forum.
Go to forum