
The latest Dynatrace Real User Monitoring enhancements enable you to dig deep into your user actions and perform analysis across numerous dimensions. Multi-dimensional User action analysis pages can be accessed from many entry points throughout Dynatrace. Depending on where you begin your analysis, pre-selected filters can be applied and carried forward as your analysis progresses.
Following are the main entry scenarios for making use of the latest multi-dimensional User action analysis views.
Scenario #1: Analysis based on user action type
Dynatrace differentiates between Load actions, XHR actions, and Custom actions (see below), enabling you to apply the ideal performance metrics for each action type. This provides for focused, in-context analysis of each user action type.
To access multi-dimensional analysis based on user action type
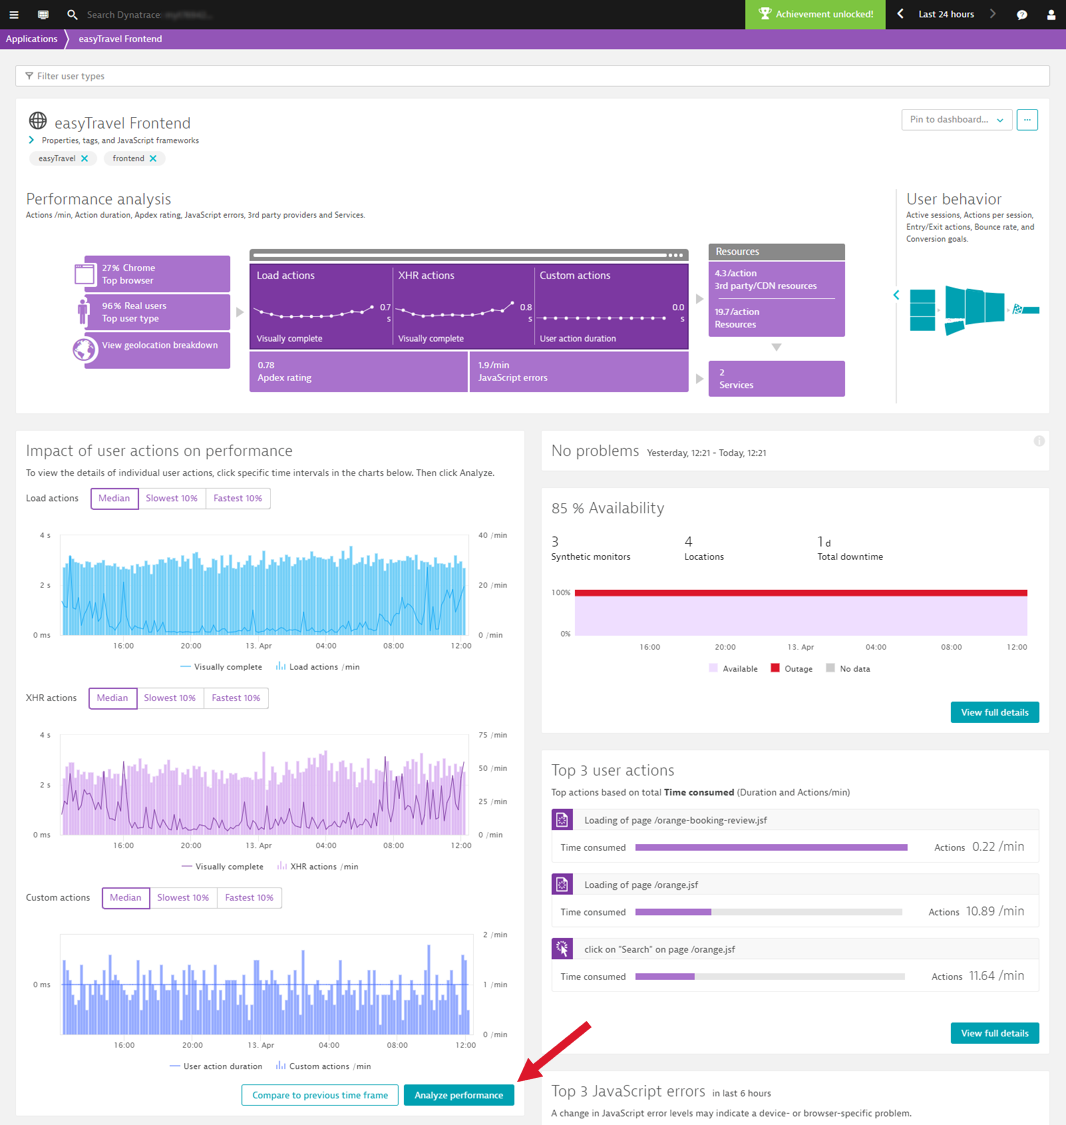
- Select Applications from the navigation menu.
- Select the application you want to analyze.
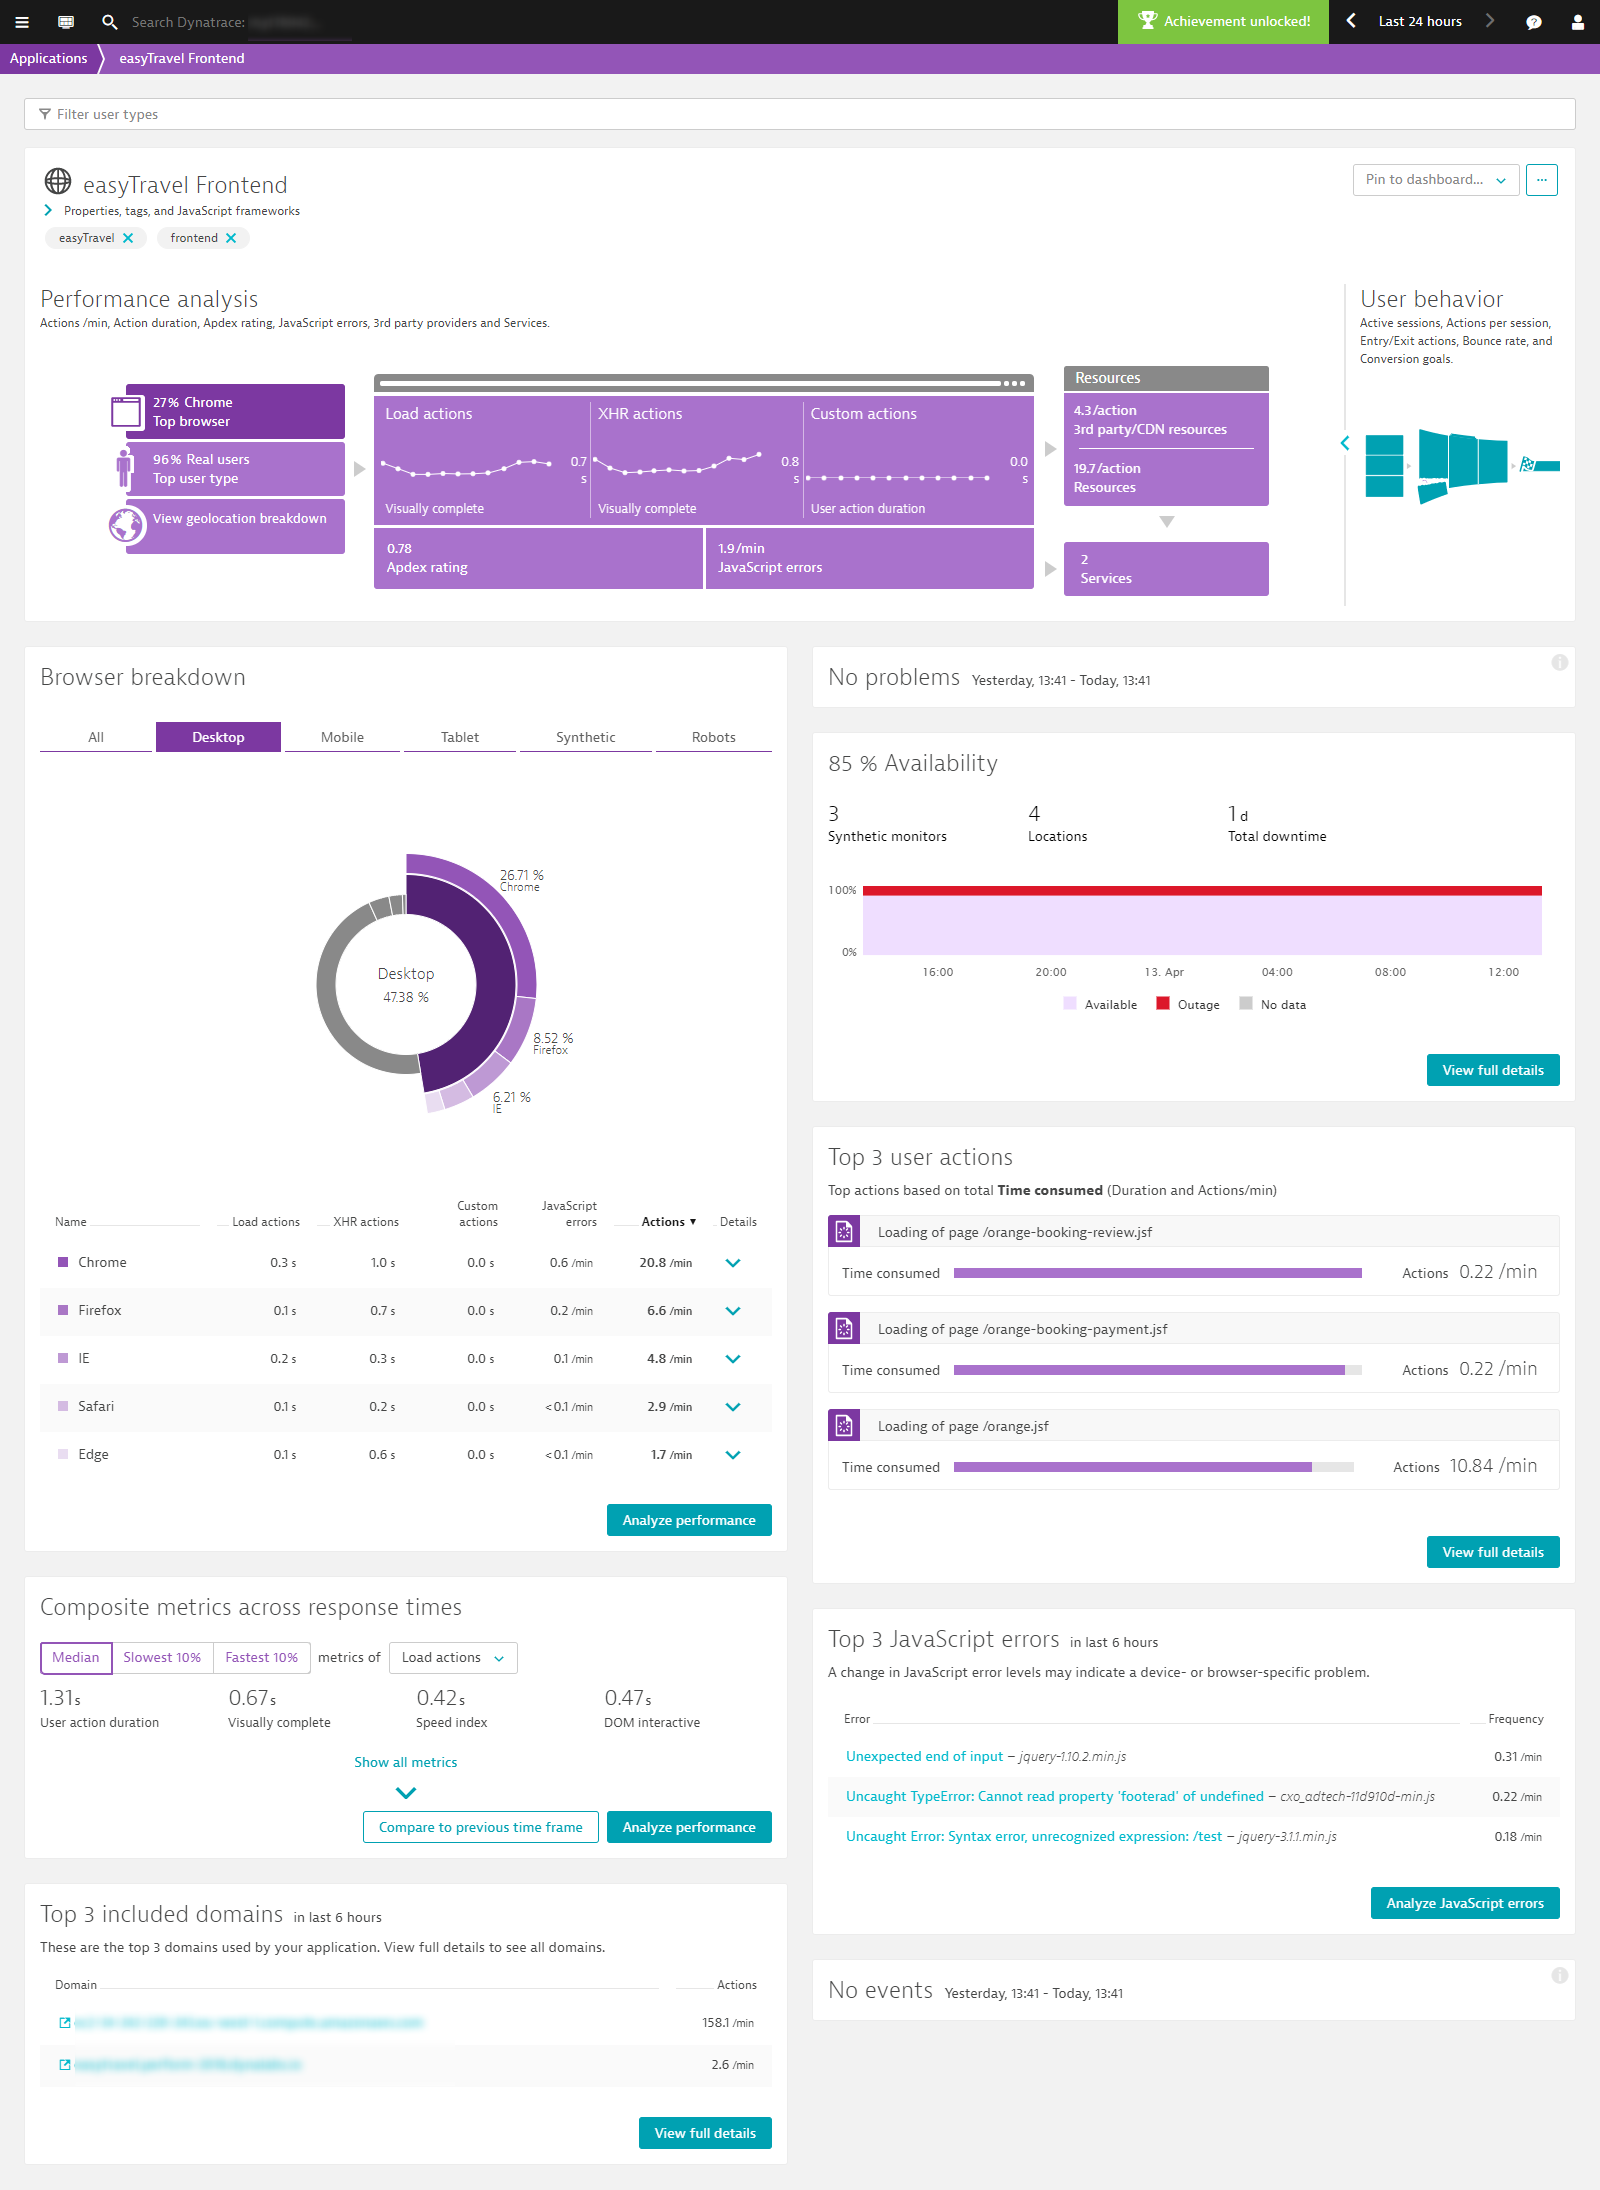
- In the Impact of user actions on performance section of the page, click the Analyze Performance button to open User action analysis view.
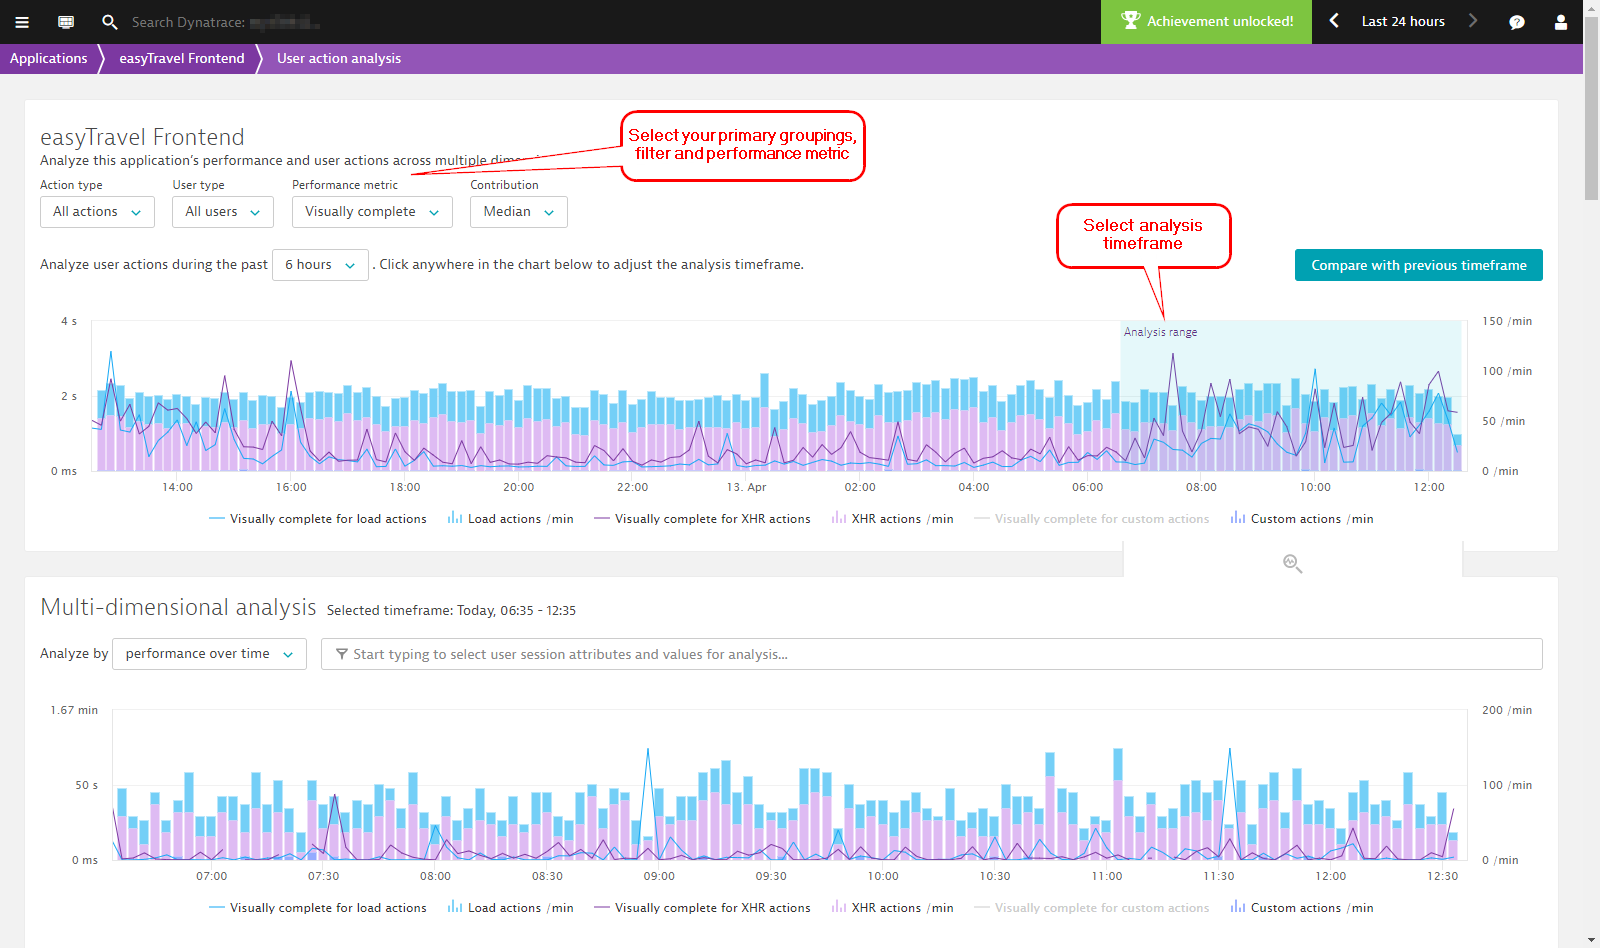
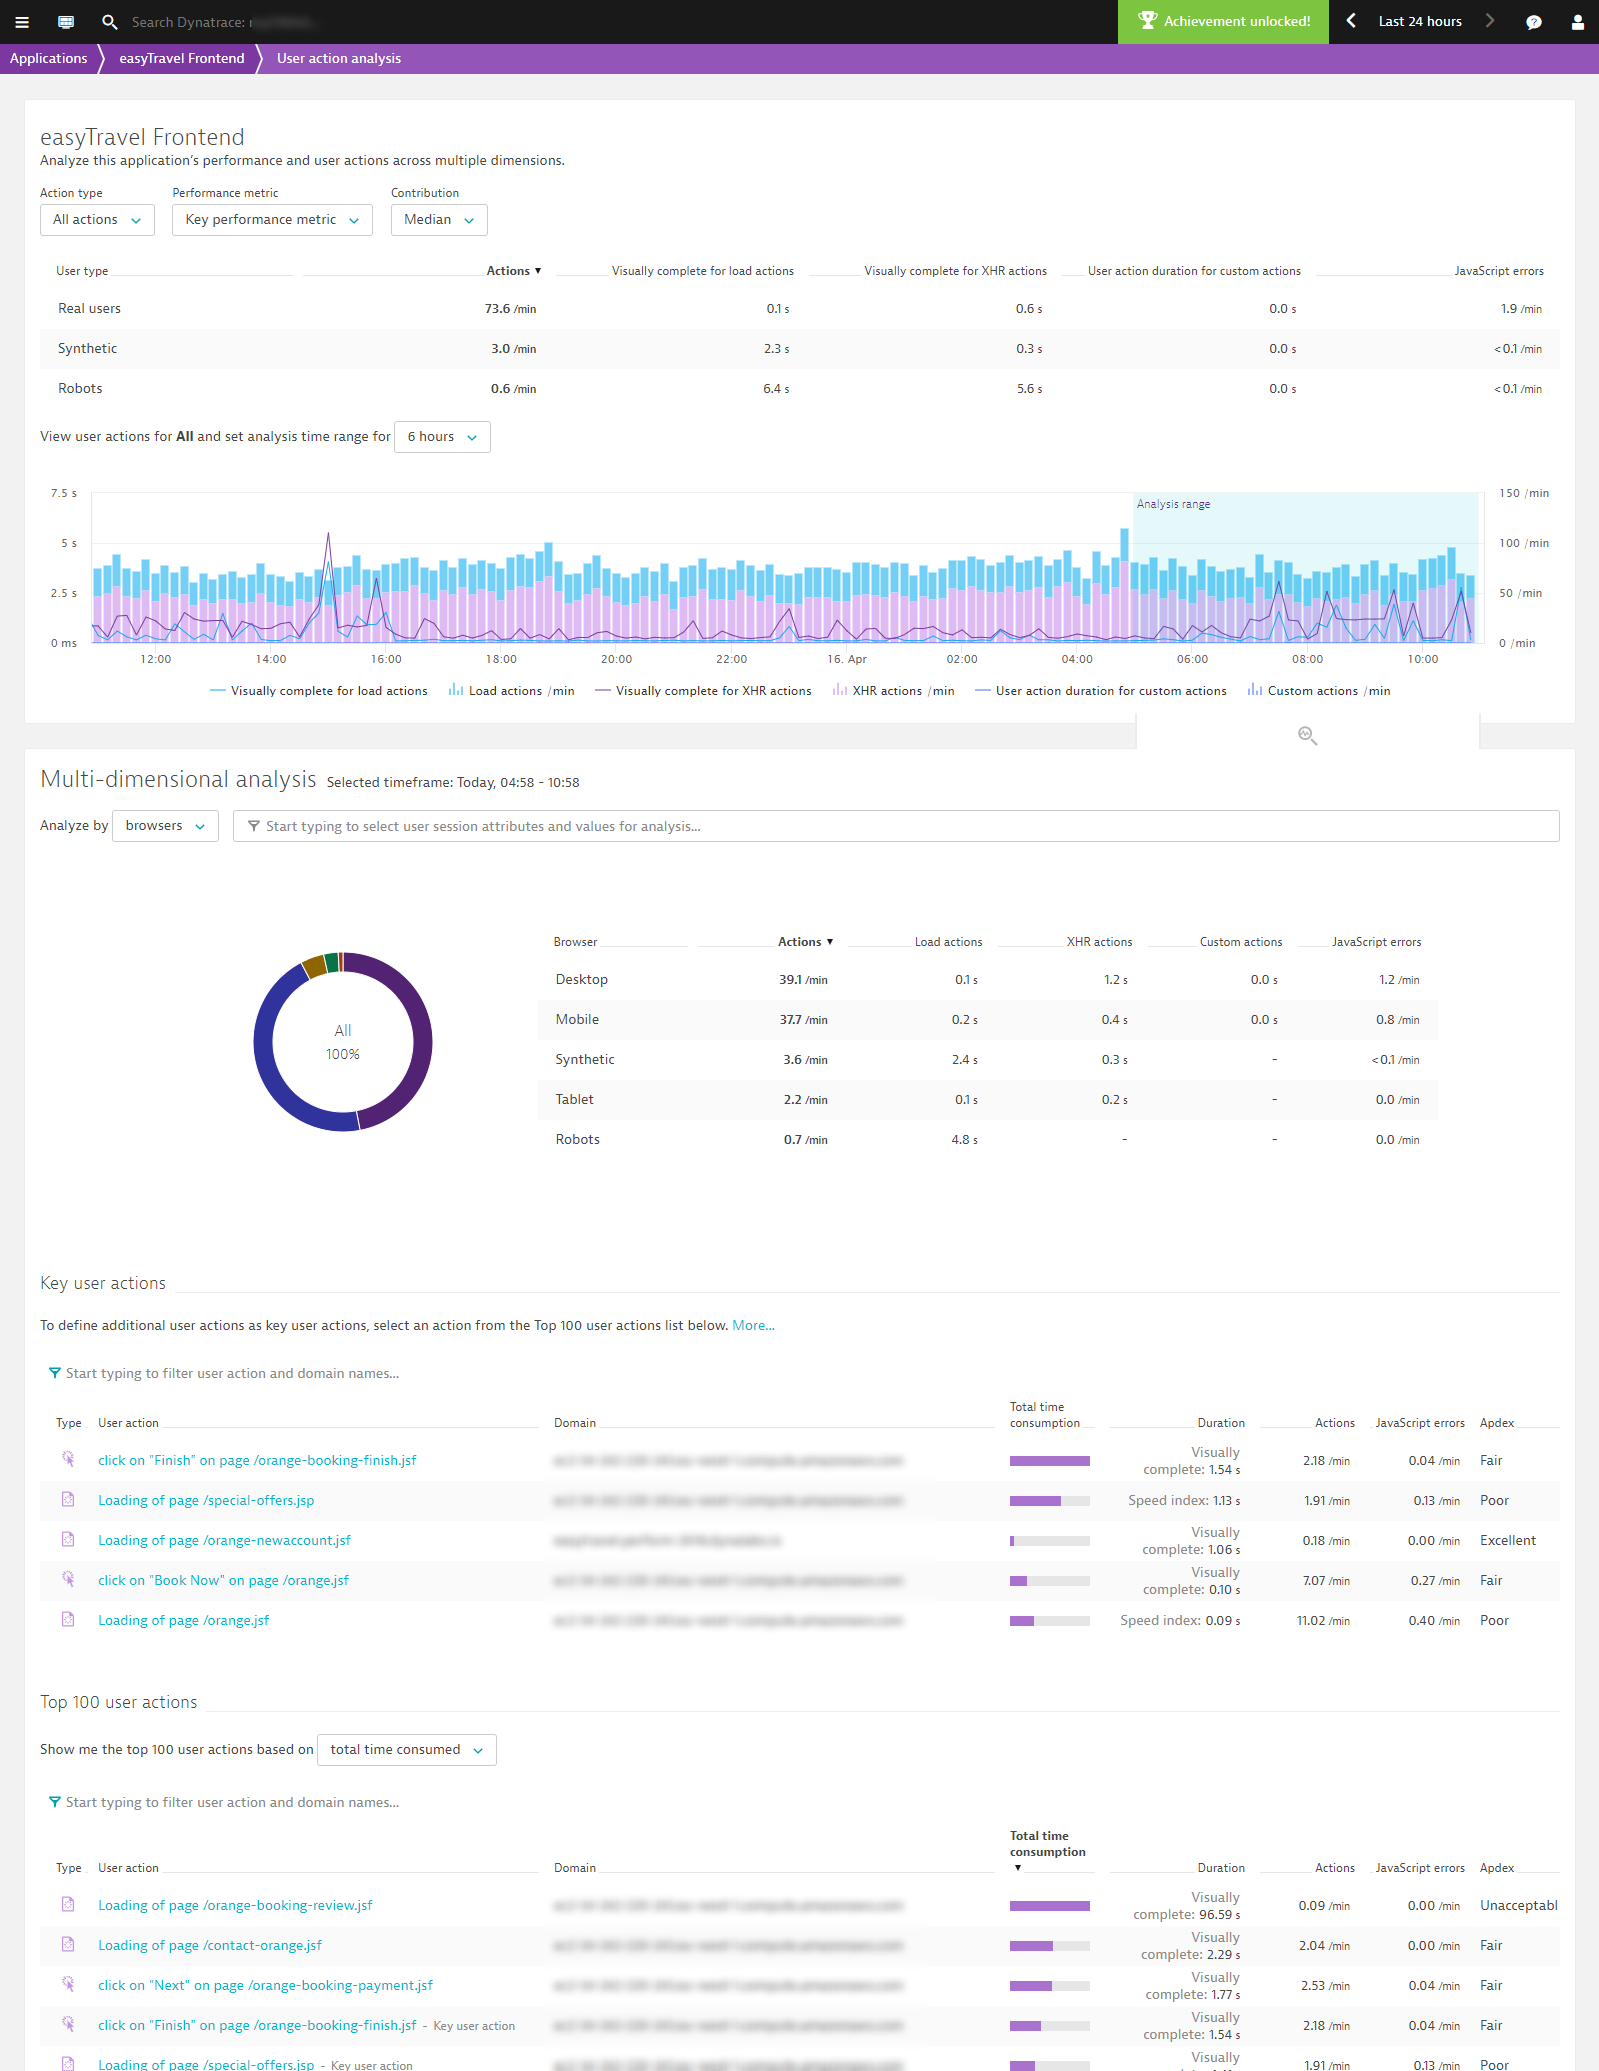
 The upper section of the multi-dimensional User action analysis page provides primary filtering options you can use to focus analysis on specific user action types.
 - From the filter droplists at the top of the page, select relevant values for filtering based on Action type, User type, Performance metric, and Contribution (see image below).
- Select a duration for the analysis timeframe from the Analyze user actions during the past… drop list.
- Click in the timeline chart to select the timeframe you want to analyze.
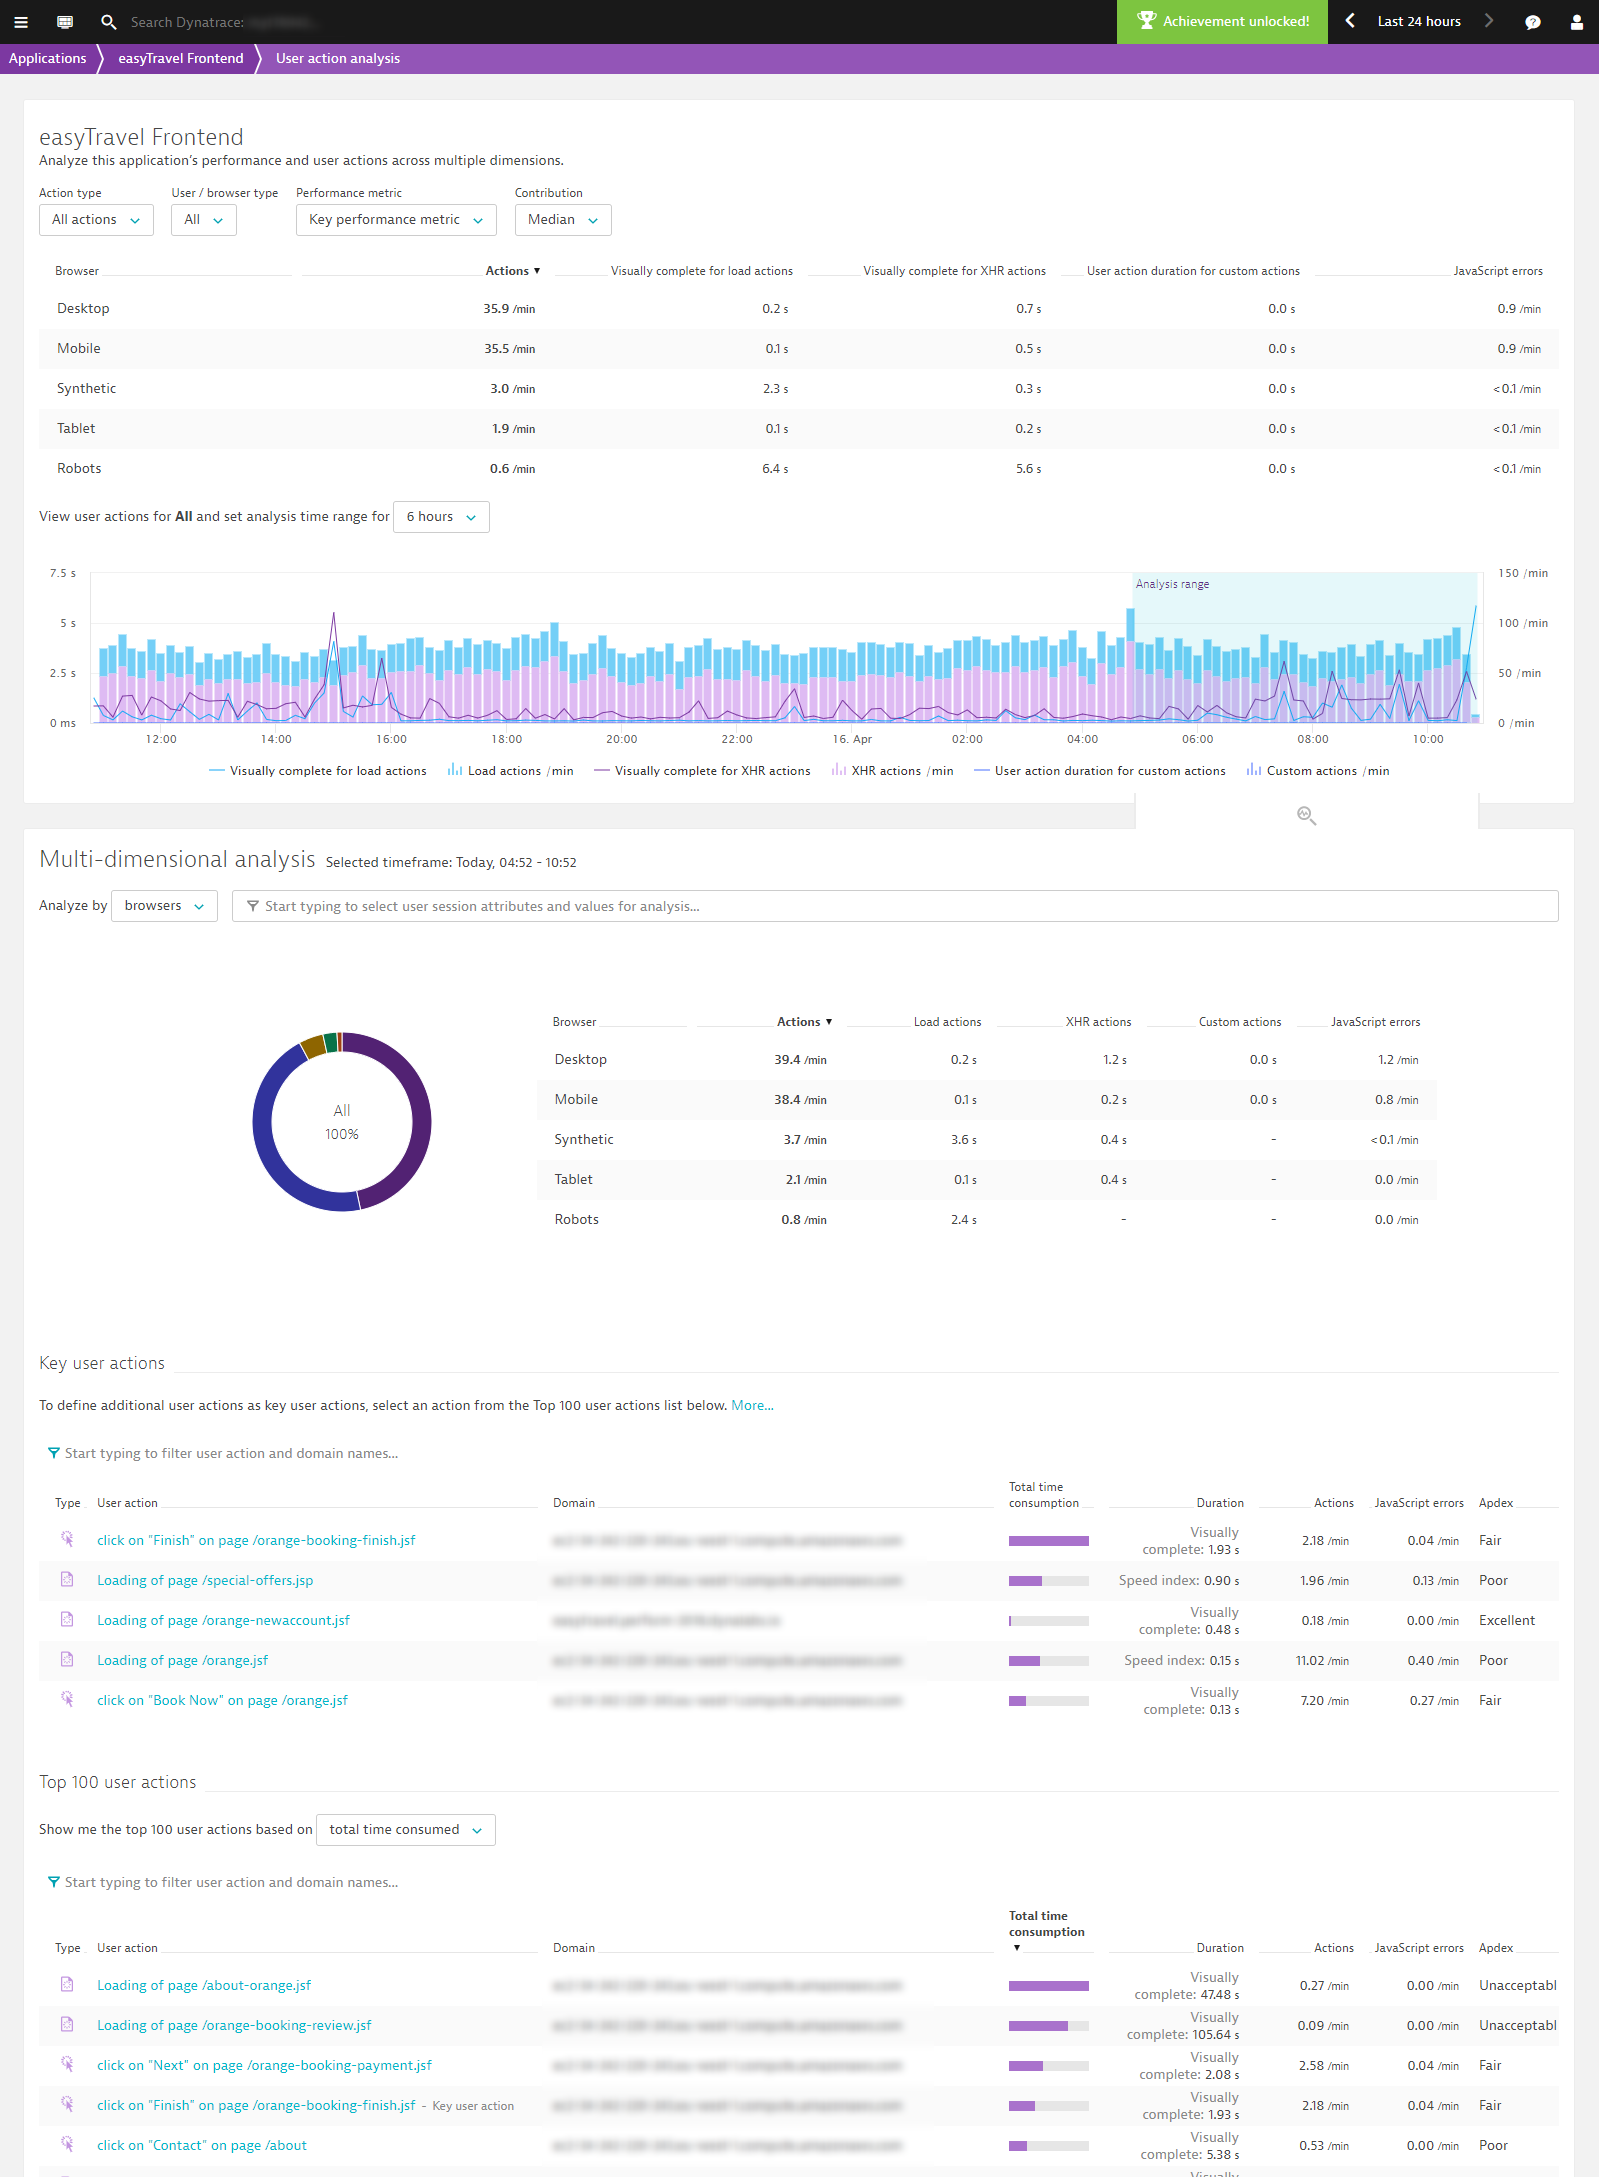
 The lower section of the view shows the more detailed, multi-dimensional user action analytics view with all the primary filters applied (see below). Now you can further hone in on just those user actions you want to analyze.
 - Optionally click in the Filtered by field to add additional filters. Filters are available for action duration, Apdex, JavaScript errors, user type, browser, and location).
Further down you’ll see a list of all the Key user actions that meet your filter criteria, along with the Top 100 user actions (this list which is initially based on total time consumed, but you can also filter based on JavaScript errors, action count, or duration.
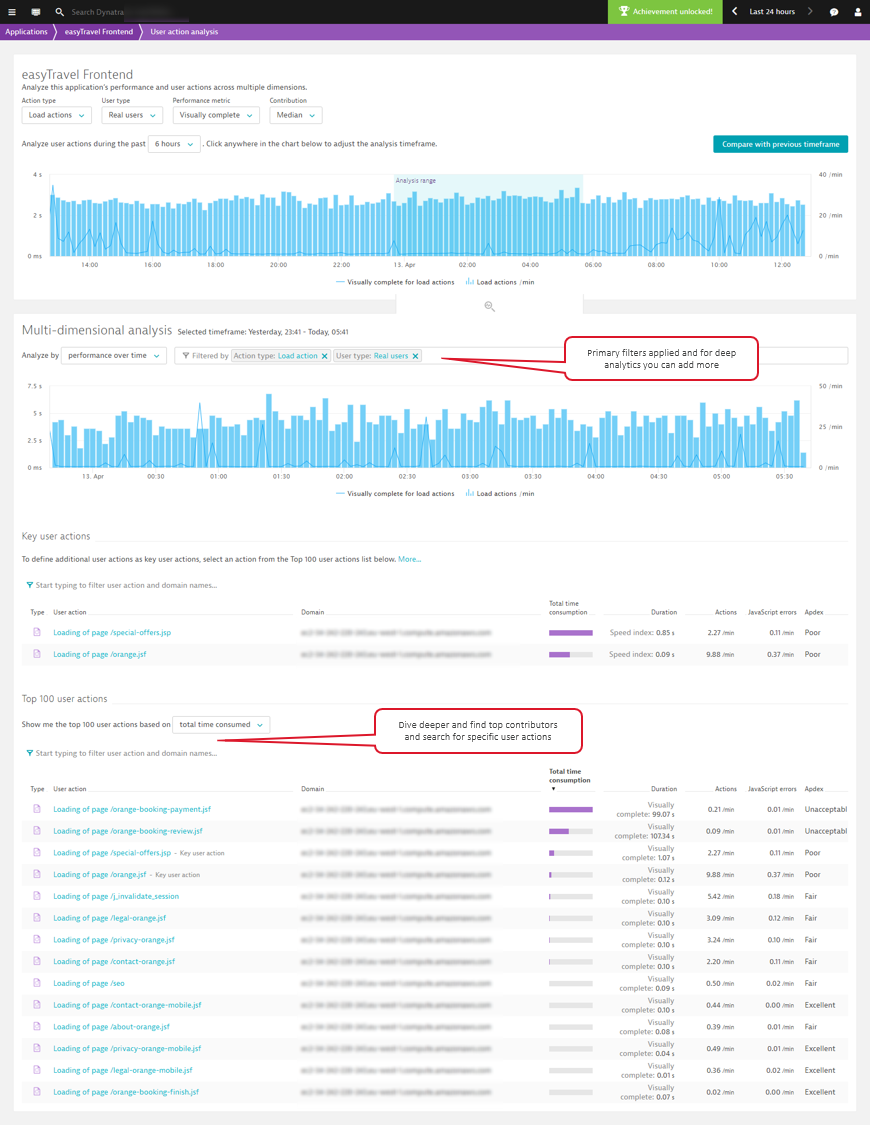
- Select the user action you want to investigate deeper. This takes you to the User actions view of the selected user action (Loading of page /special-offers.jsp in the example below). As you can see, the defined filters and analysis time frame are applied to the analysis on this page.
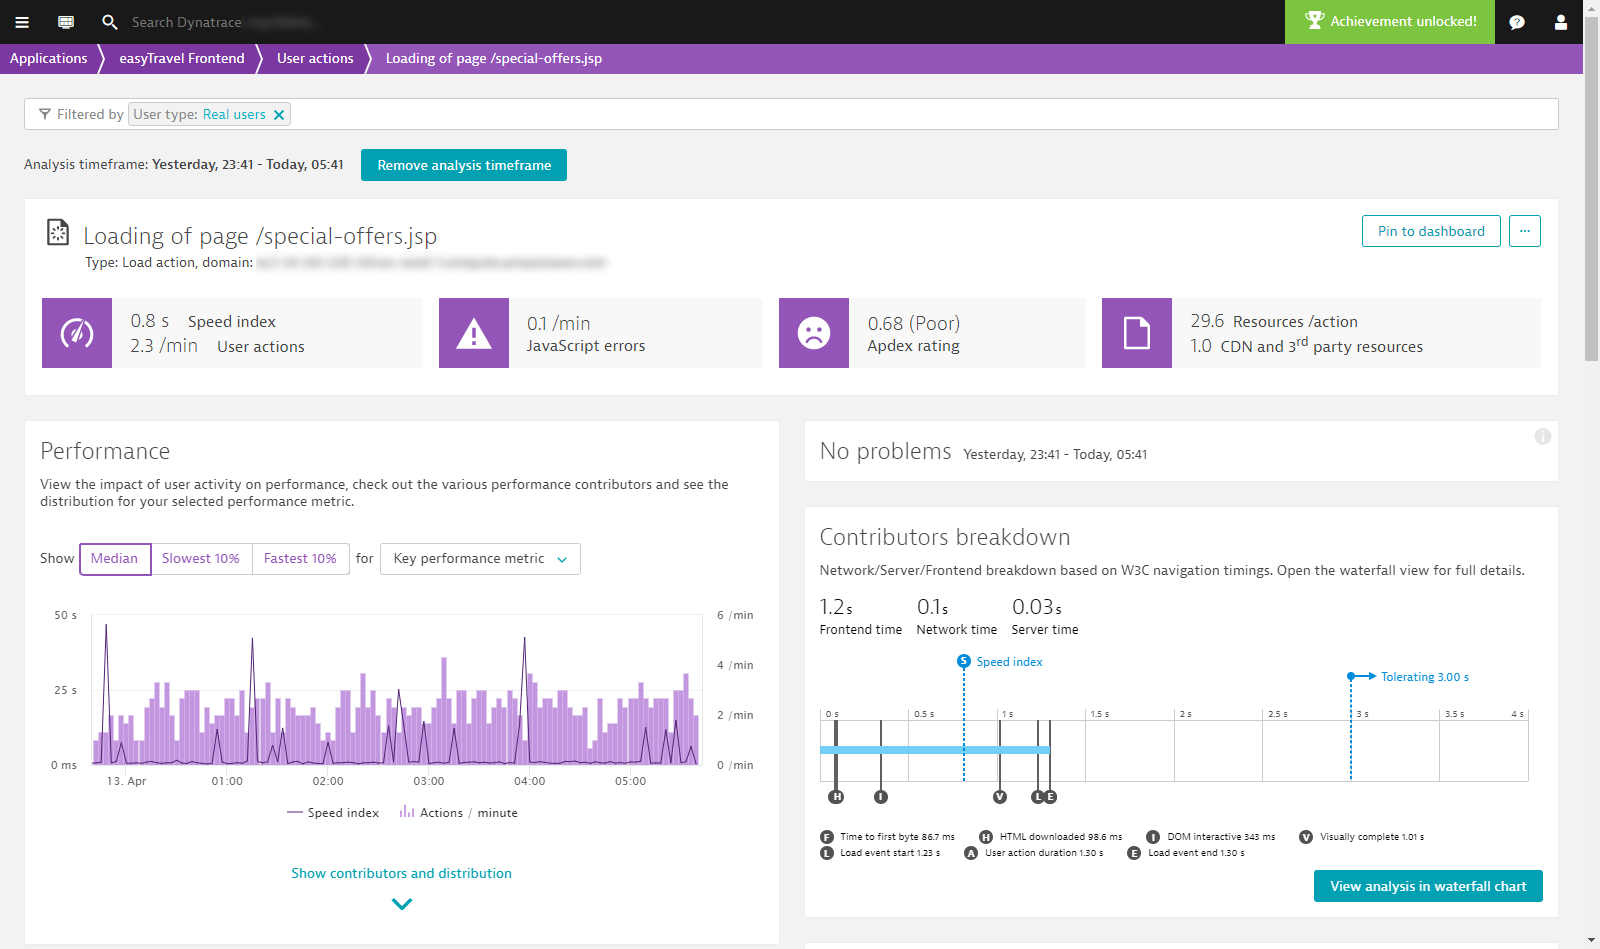 The applied filters and analysis timeframe even carry over to Waterfall analysis view (see below).
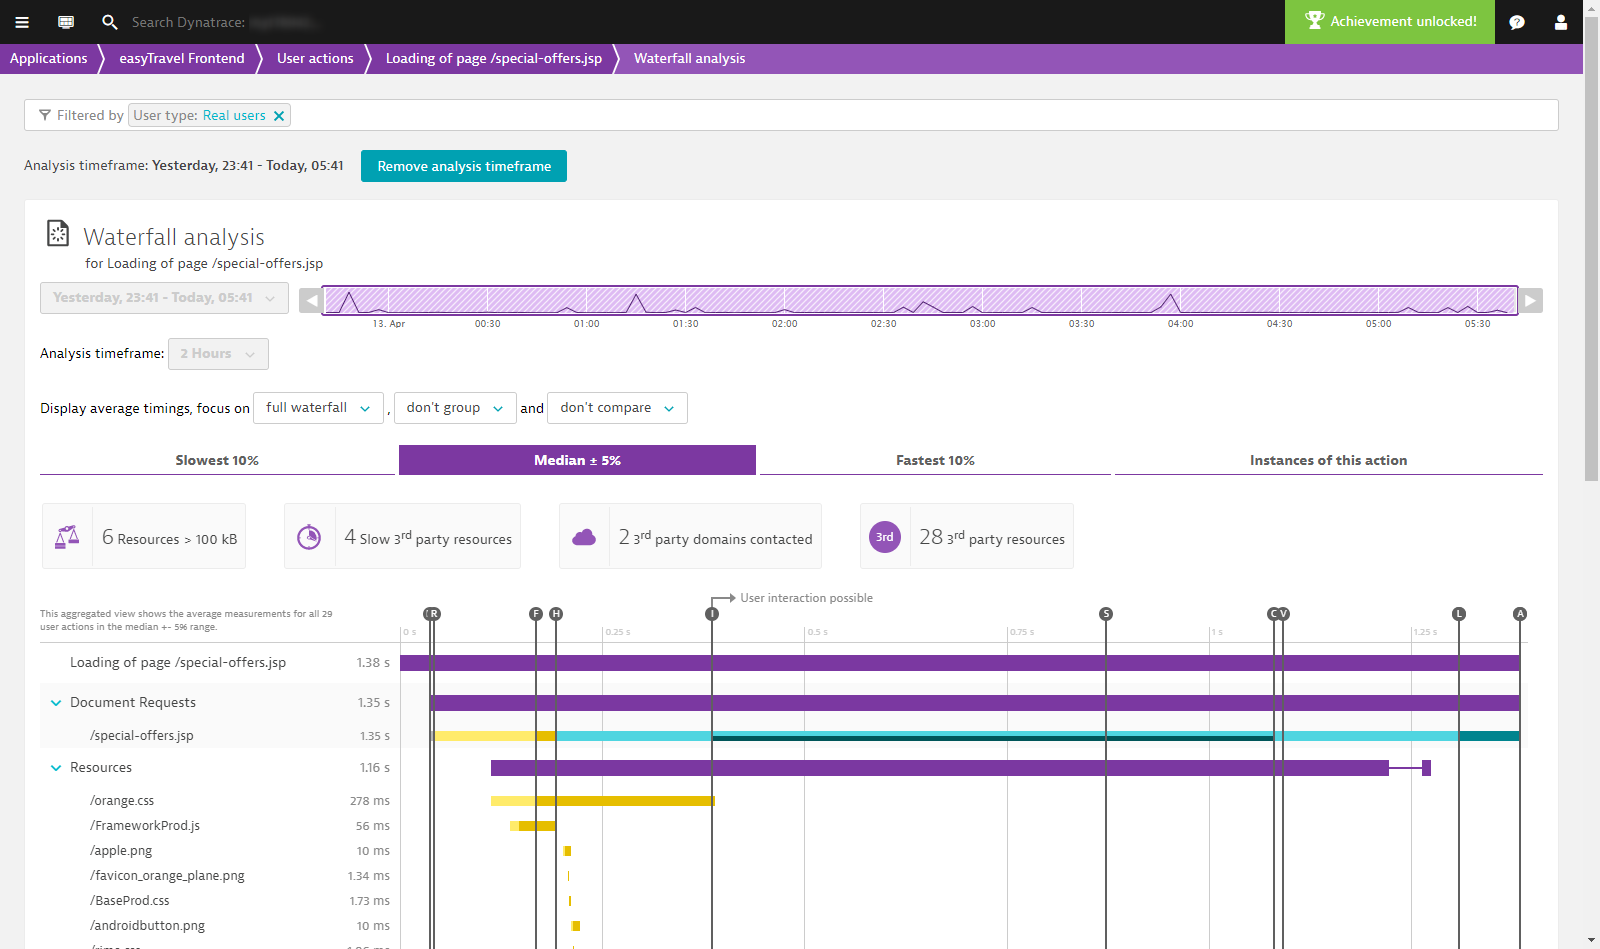
Scenario #2: Analysis based on browser type
Sometimes you need to figure out if users that share the same browser type are facing the same performance issues.
To access multi-dimensional analysis based on browser type
- Select Applications from the navigation menu.
- Select the application you want to analyze.
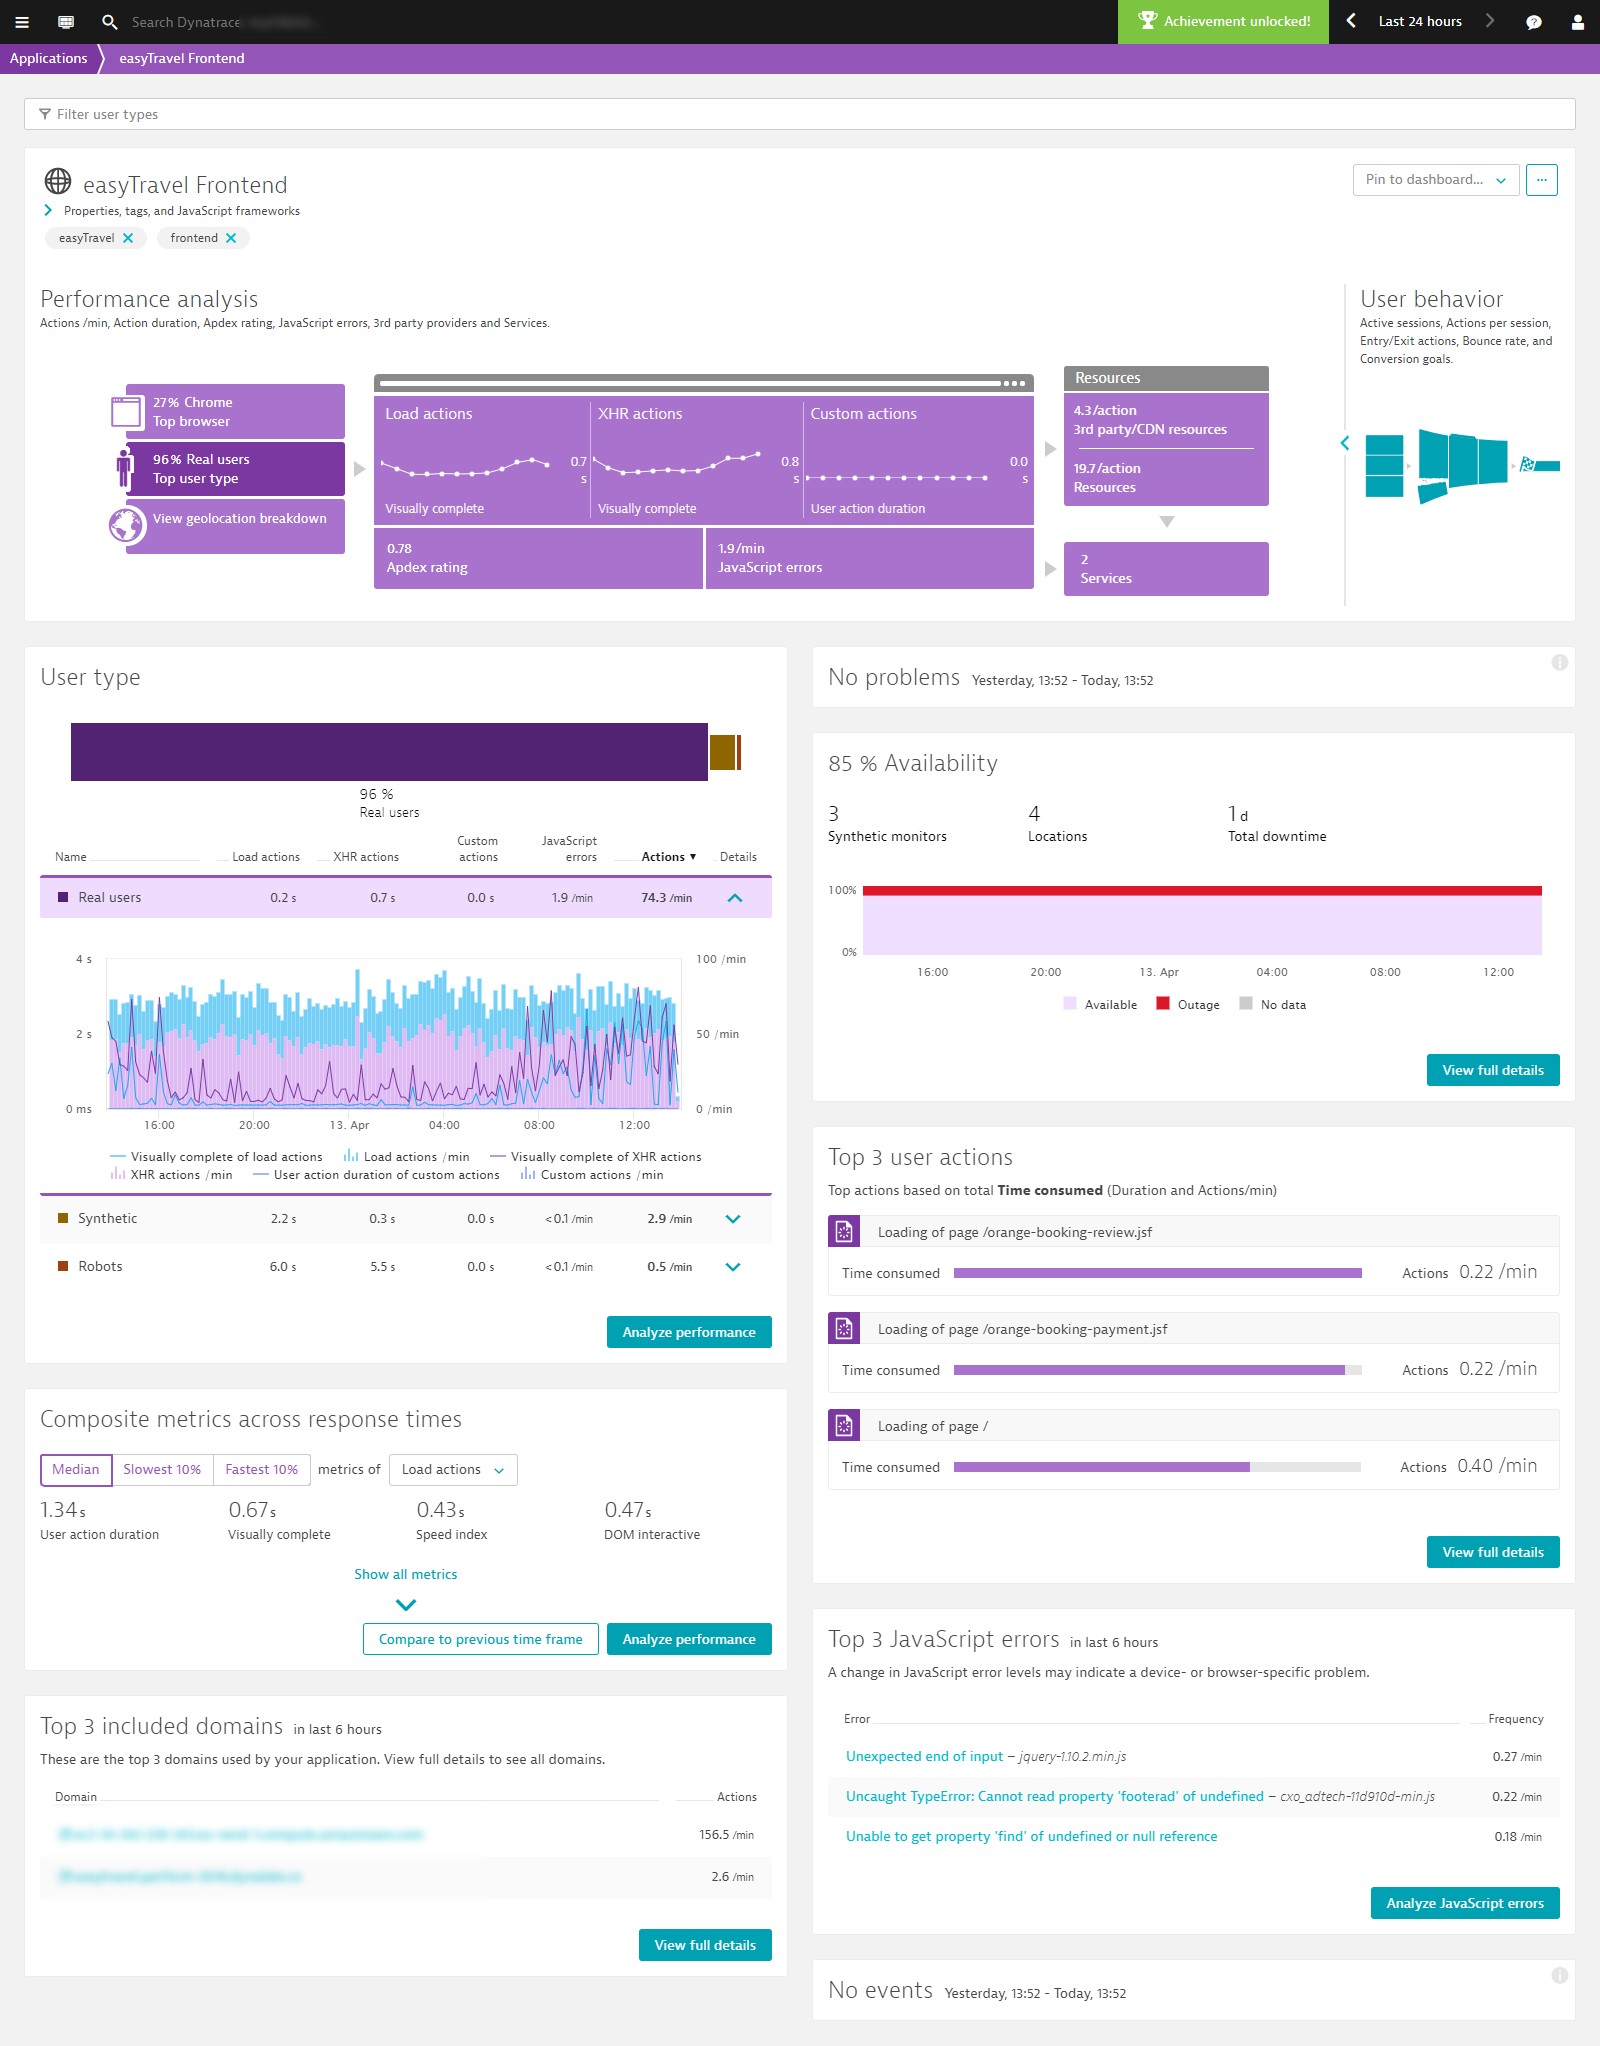
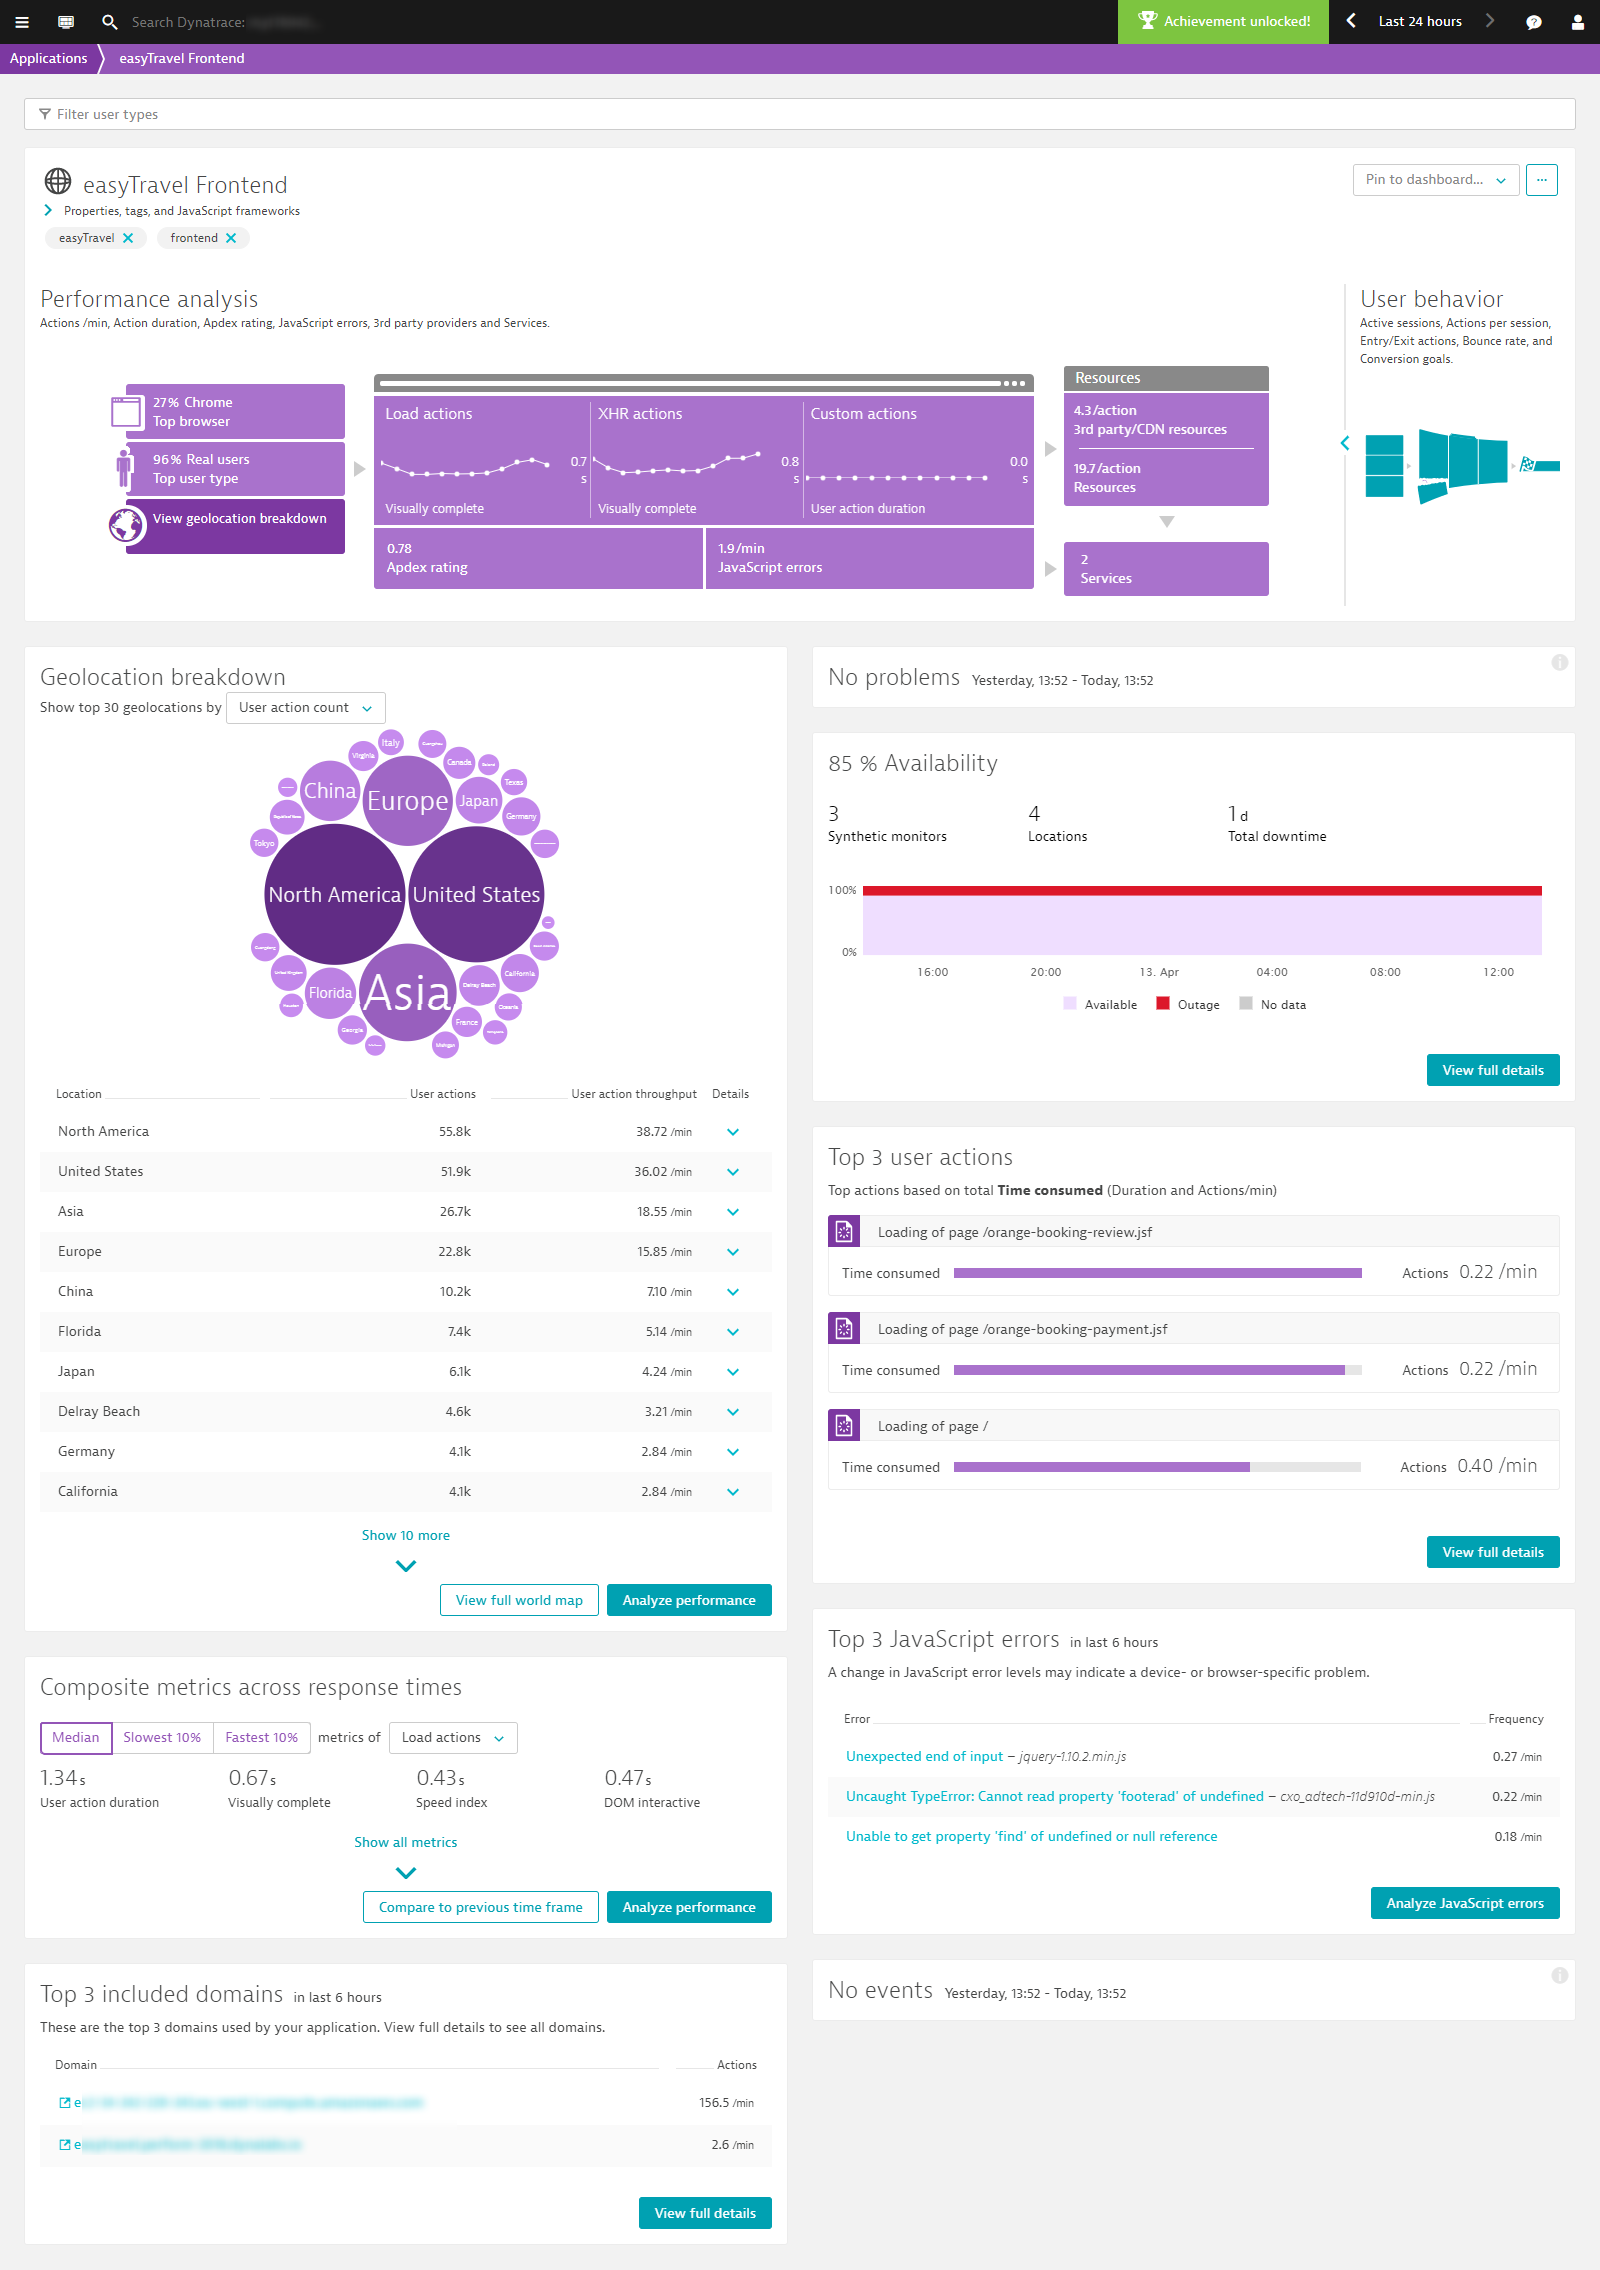
- Within the Performance analysis infographic, click the Top browser tile in the upper-left corner to display the Browser breakdown section.
- Click the Analyze performance button at the bottom of the section.
 This takes you to Multi-dimensional analysis view, where the analysis mode is set to Browsers (see below).
 - From the filter droplists at the top of the page, select relevant values for filtering based on Action type, User / browser type, Performance metric, and Contribution.
- Select a duration for the analysis timeframe from the set analysis time frame drop list.
- Click in the timeline chart to select the timeframe you want to analyze.
From here, you can pinpoint and analyze only those user actions you are relevant to your analysis.
Scenario #3: Analysis based on user type
Sometimes you want to learn more about the bots that crawl your website, perhaps because your company is working toward Search Engine Optimization (SEO), or you just want to see a “clean room request” made via Synthetic monitoring.
To access multi-dimensional analysis based on user type
- Select Applications from the navigation menu.
- Select the application you want to analyze.
- Within the Performance analysis infographic, click the Top user type tile in the upper-left corner to display the User type section.
- Click the Analyze performance button at the bottom of the section.
 This takes you to multi-dimensional User action analysis view, which highlights the different user types that have performed the user actions under analysis. The Analyze by droplist in the Multi-dimensional analysis section is preset to Browsers.
 - From the filter droplists at the top of the page, select relevant values for filtering based on Action type, Performance metric, and Contribution.
- Select a duration for the analysis timeframe from the set analysis time frame drop list.
- Click in the timeline chart to select the timeframe you want to analyze.
 From here, you can pinpoint and analyze only those user actions that you’re most interested in.
Scenario #4: Analysis based on Geolocation
In this scenario, the focus is on finding user actions from a specific geographic region. Let’s say you’ve added a Content Delivery Network (CDN) for a certain region and want insights into how well the new CDN is working.
To access multi-dimensional analysis based on geolocation
- Select Applications from the navigation menu.
- Select the application you want to analyze.
- Within the Performance analysis infographic, click the View geolocation breakdown tile in the lower-left corner to display the Geolocation breakdown section.
- Click the Analyze performance button at the bottom of the section.
 This takes you to multi-dimensional User action analysis view, which now shows the top geolocations where your user actions originate.
 - From the filter droplists at the top of the page, select relevant values for filtering based on Action type, User type, Performance metric, and Contribution.
- Select a duration for the analysis timeframe from the set analysis time frame drop list.
- Click in the timeline chart to select the timeframe you want to analyze.
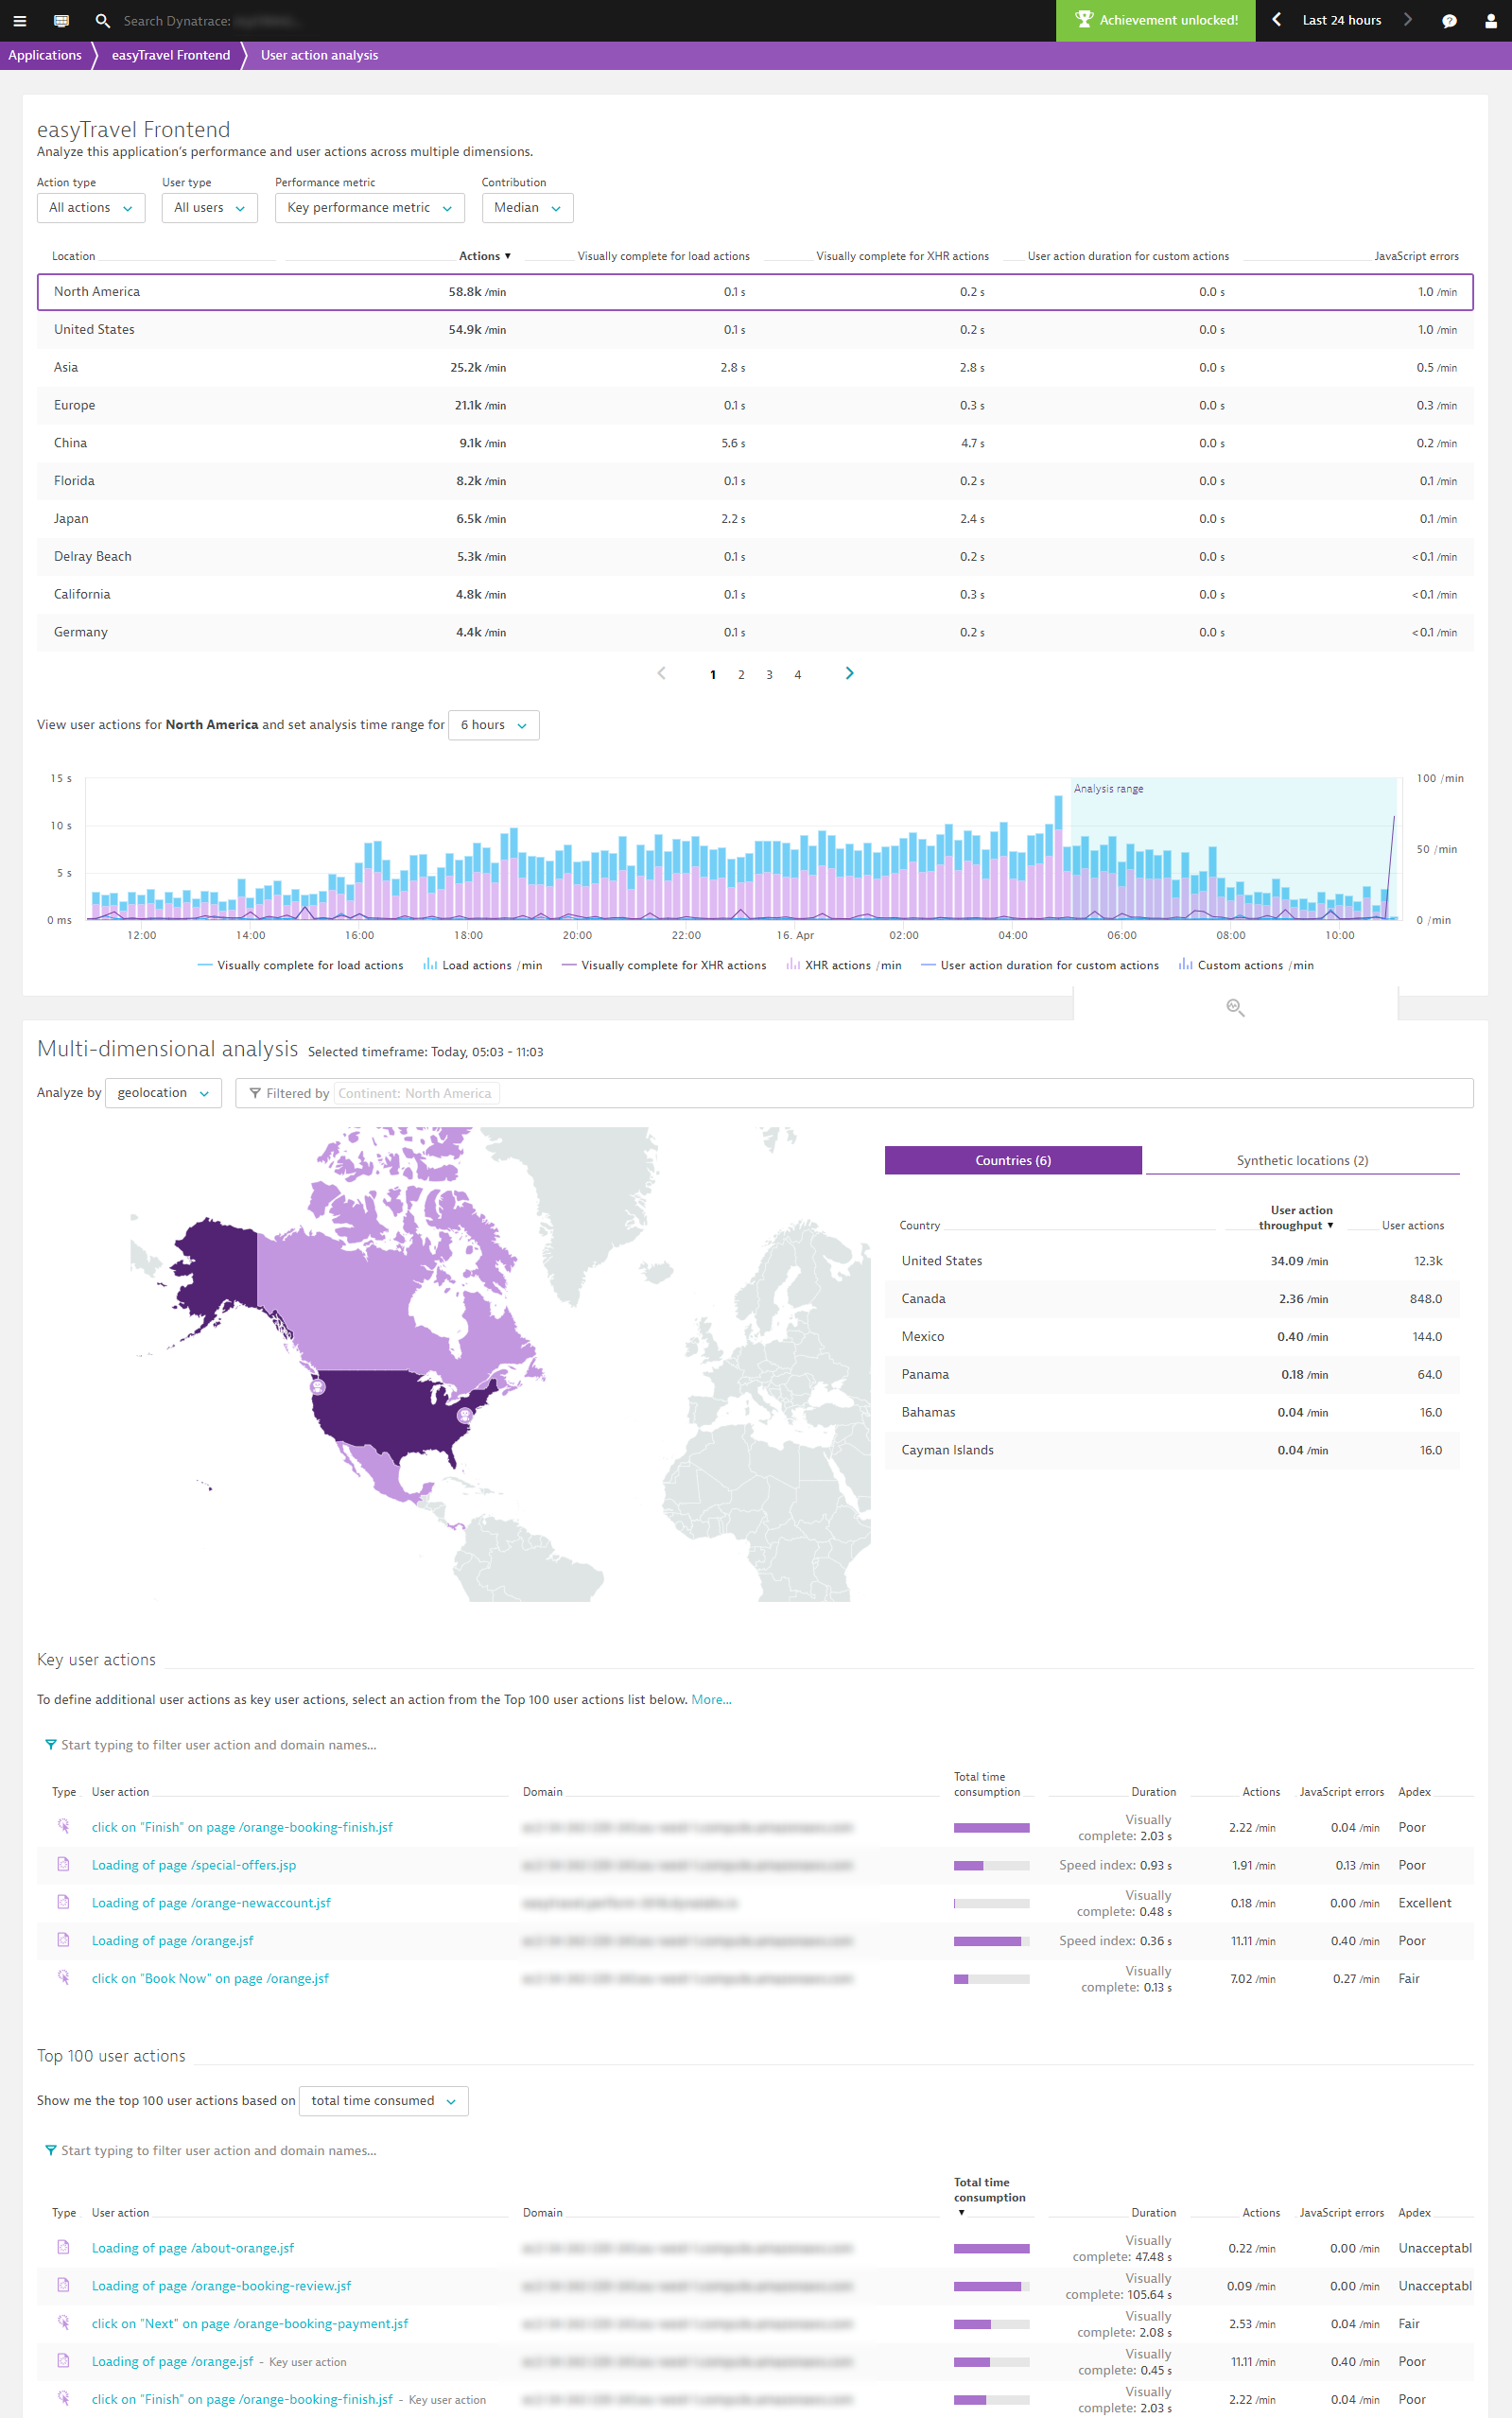
- From here, you can pinpoint and analyze only those user actions that are relevant to your analysis.
Conclusion
Note that, for all of the above scenarios, your defined filters are automatically carried over to the dimension-specific user-action analysis view you’ve selected. Filters remain persistent all the way down to Waterfall analysis view for deep-dive analysis.
Have fun querying your Dynatrace Real User Monitoring data, and don’t forget to share your success stories with us at Dynatrace Community!


Looking for answers?
Start a new discussion or ask for help in our Q&A forum.
Go to forum