
Our new and transparent means of licensing Dynatrace monitoring capabilities provides you with a better monitoring-consumption overview and more flexibility in consuming metrics on the Dynatrace platform.
Metrics are an essential functionality provided by the Dynatrace Software Intelligence Platform. Dynatrace OneAgent and ActiveGate extensions provide you with a multitude of metrics. We also empower you with the ability to ingest your own custom metrics and leverage those metrics using a variety of Dynatrace features.
Dynatrace wants to fulfill all your requirements for infrastructure and application monitoring with a single platform to save you from the hassle of maintaining additional products and services. With this in mind, we’ve been looking for a new way of measuring the usage of custom metrics.
Starting with Dynatrace version 1.198, we’re introducing the concept of Davis data units (DDUs).
Easily predict the usage of custom metrics in large, dynamic environments
DDUs provide you with a more direct, flexible, and transparent means of managing your metric consumption.
Simple and transparent licensing
- With DDUs, you’re better able to predict the usage of custom metrics and act accordingly, especially in growing and dynamic environments.
- Actual metric consumption can be traced back to specific individual data points that are reported to the Dynatrace platform.
- DDUs replace the existing custom metrics licensing. For details on converting your existing quota of custom metrics, see custom metric conversion to DDUs.
Focus on metrics use cases
- With the release of Dynatrace version 1.198, DDUs are used for metrics only, as a first step. In future releases, we’ll also enable DDUs for log monitoring and events.
- Built-in metrics provided by OneAgent don’t consume DDUs.
Free tier of DDUs enables frictionless start
- Every new SaaS environment and each Managed license receives 200,000 DDUs free of charge (equivalent to 381 custom metrics)
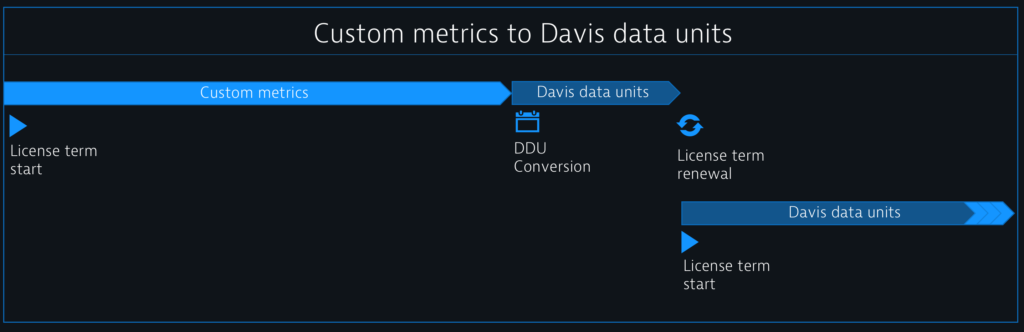
- This free tier automatically renews annually at the beginning of each new license term for each account, giving you the opportunity to evaluate and test features without worrying about associated costs.
Automatic transition to DDUs
- There is no action needed from your end as existing licensed custom metrics volumes will be converted to DDUs automatically.
- You will receive a notification in the Dynatrace web UI as soon DDUs are available for your environment.
- Easily keep track of your DDU consumption with the new DDUs overview page (Settings > Accounting > Davis data units overview).
Understand Davis data units
Up to now, the baseline we used for measuring custom metrics was the actual concurrent usage with a sliding time window of 24 hours. Especially in situations with extended load or during busy ramp-up phases we weren’t able to provide the required flexibility and predictability using that measurement concept.
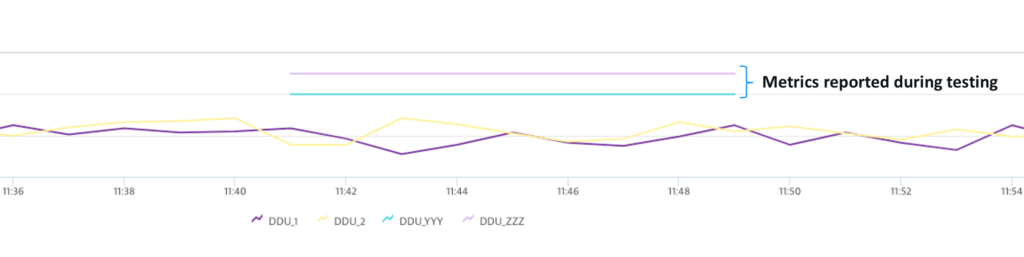
For example, assume you have 2 hosts (without OneAgent installed) that report the temperature of their CPU every minute. With custom metrics licensing, this would ended up consuming 2 custom metrics from your total available volume.
During some testing, you receive additional CPU temperature values from 2 new hosts DDU_YYY and DDU_ZZZ. The test hosts only reported the CPU temperature for a couple of minutes during the testing phase but still cause your custom metric consumption to increase from 2 to 4 custom metrics within a 24 hour window.
Another example, based on the custom metrics model of consumption, is the scale-out of application server resources that report custom metrics during a holiday season. While this may only happen during certain events, licensing would have required a permanent demand of custom metrics to cover the additional consumption.
With DDUs, you gain predictable usage for your periodic reported metrics as well as flexibility for metric data that is reported only during test phases or during special business circumstances.
How DDUs are consumed
DDUs are a kind of currency for the Dynatrace platform, which is leveraged by existing and new features. The same consumption model is already applied for Digital Experience Management (DEM). In case of metrics, the baseline for DDUs are metric data points that are ingested to the platform, independent of how they are consumed.
Each metric data point has a weight of 0.001 DDUs and is summed up in your actual consumption. So, if you continuously send a metric at a 1-minute frequency, this translates to 1 data point x 60 minutes x 24 hours x 365 days x 0.001 DDU weight = 525.6 DDUs for a 1-year consumption. If the frequency is only every 10 minutes, only 52.56 DDUs per year will be deducted.
Examples:
- Reporting a simple metric active_users from your custom application every minute will consume 525.6 DDUs per year
(1 x 60 mins x 24 hours x 365 days x 0.001) - Reporting the same metric active_users but splitting it by 2 regions (for example, East/West) results in 2 data points per minute and therefore consumes 1,051 DDUs per year
(2 regions x 60 mins x 24 hours x 365 days x 0.001) - Reporting a metric total_successful_contracts from your insurance application every 60 minutes will consume 8.76 DDUs per year
(1 x 24 hours x 365 days x 0.001) - Reporting the same metric total_successful_contracts but splitting it by 2 regions (East/West) and 3 different insurance types (Life, Car, Property) will consume 52.56 DDUs per year
(2 regions x 3 types x 24 hours x 365 days x 0.001) - Reporting a metric cpu_fan_speed every minute from 250 different hosts will consume 131,400 DDUs per year
(250 x 60 mins x 24 hours x 365 days x 0.001) - Reporting a metric cpu_temperature every 10 seconds from 1 host will consume 3,153.6 DDUs per year
(6 per min x 60 mins x 24 hours x 365 days x 0.001)
Which metrics consume Davis data units – built-in vs. custom metrics
Built-in metrics from OneAgent and Cloud overview metrics
Metrics reported by OneAgent (for example, CPU and memory) are always included and don’t consume DDUs. This includes the overview metrics for Cloud integrations (AWS, Azure) and Cloud Foundry as well as Kubernetes cluster metrics. Kubernetes Node/Pod metrics on OneAgent monitored hosts also considered to be built-in metrics.
Metrics reported via extensions
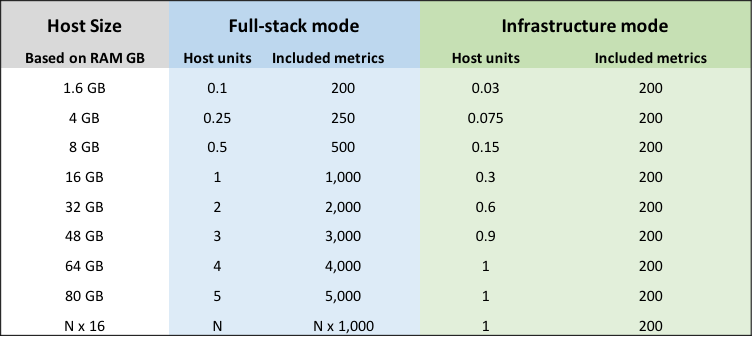
Metrics reported by OneAgent/ActiveGate extensions first consume an included pool of metrics per host unit before they consume DDUs. The number of included metrics depends on whether or not the OneAgent is licensed in Full-stack or Infrastructure mode. For Full stack, we provide a total of 1,000 included metrics per host unit. For Infrastructure mode, we provide 200 metrics for each host. See details in the table below:
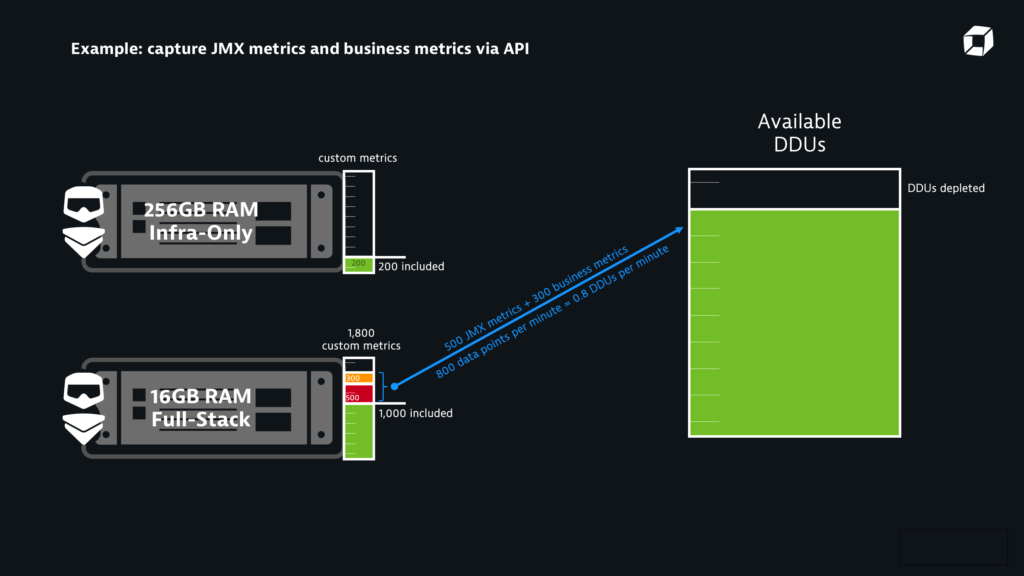
Metrics that are reported via extensions and exceed the limit of included metrics per host unit will consume DDUs (see example below). In a future release, a new Metric API will enable you to book metrics on a host and thereby allow you to take advantage of included metrics on these hosts.
Cloud services monitored by AWS and Azure integration are provided free of charge for the GA release but will consume billable DDUs in a future release.
Custom metrics not bound to a specific host
All custom metrics that are not directly booked on a host consume DDUs. Custom metrics represent business-specific metrics reported via REST API, OneAgent, or ActiveGate custom extensions (JMX, …). Examples are monitoring metrics of a custom device where no OneAgent or ActiveGate is installed, business metrics such as revenue numbers ingested via Dynatrace APIs, or a custom developed extension that ingests metrics.
Calculated service metrics, log metrics, and custom metrics from Digital Experience Management (DEM) also consume DDUs.
Examples
| Mode | Host units / Included metrics | Reported metrics from Extensions | Available included metrics | Reported custom metrics | Billable metrics | Deducted DDUs (per minute) |
| Full-stack | 0.5 / 500 | 300 | 200 | 0 | 0 | 0 |
| Full-stack | 1 / 1,000 | 1,500 | 0 | 0 | 500 | 0.5 |
| Full-stack | 1 / 1,000 | 1,500 | 0 | 300 | 800 | 0.8 |
| Full-stack | 4 / 4,000 | 5,000 | 0 | 700 | 1,700 | 1.7 |
| Infrastructure | 0.6 / 200 | 150 | 50 | 0 | 0 | 0 |
| Infrastructure | 1 / 200 | 1,000 | 0 | 0 | 800 | 0,8 |
All values listed in the table above are based on metrics reported at a 1-minute frequency.
Keep track of your Davis data units consumption
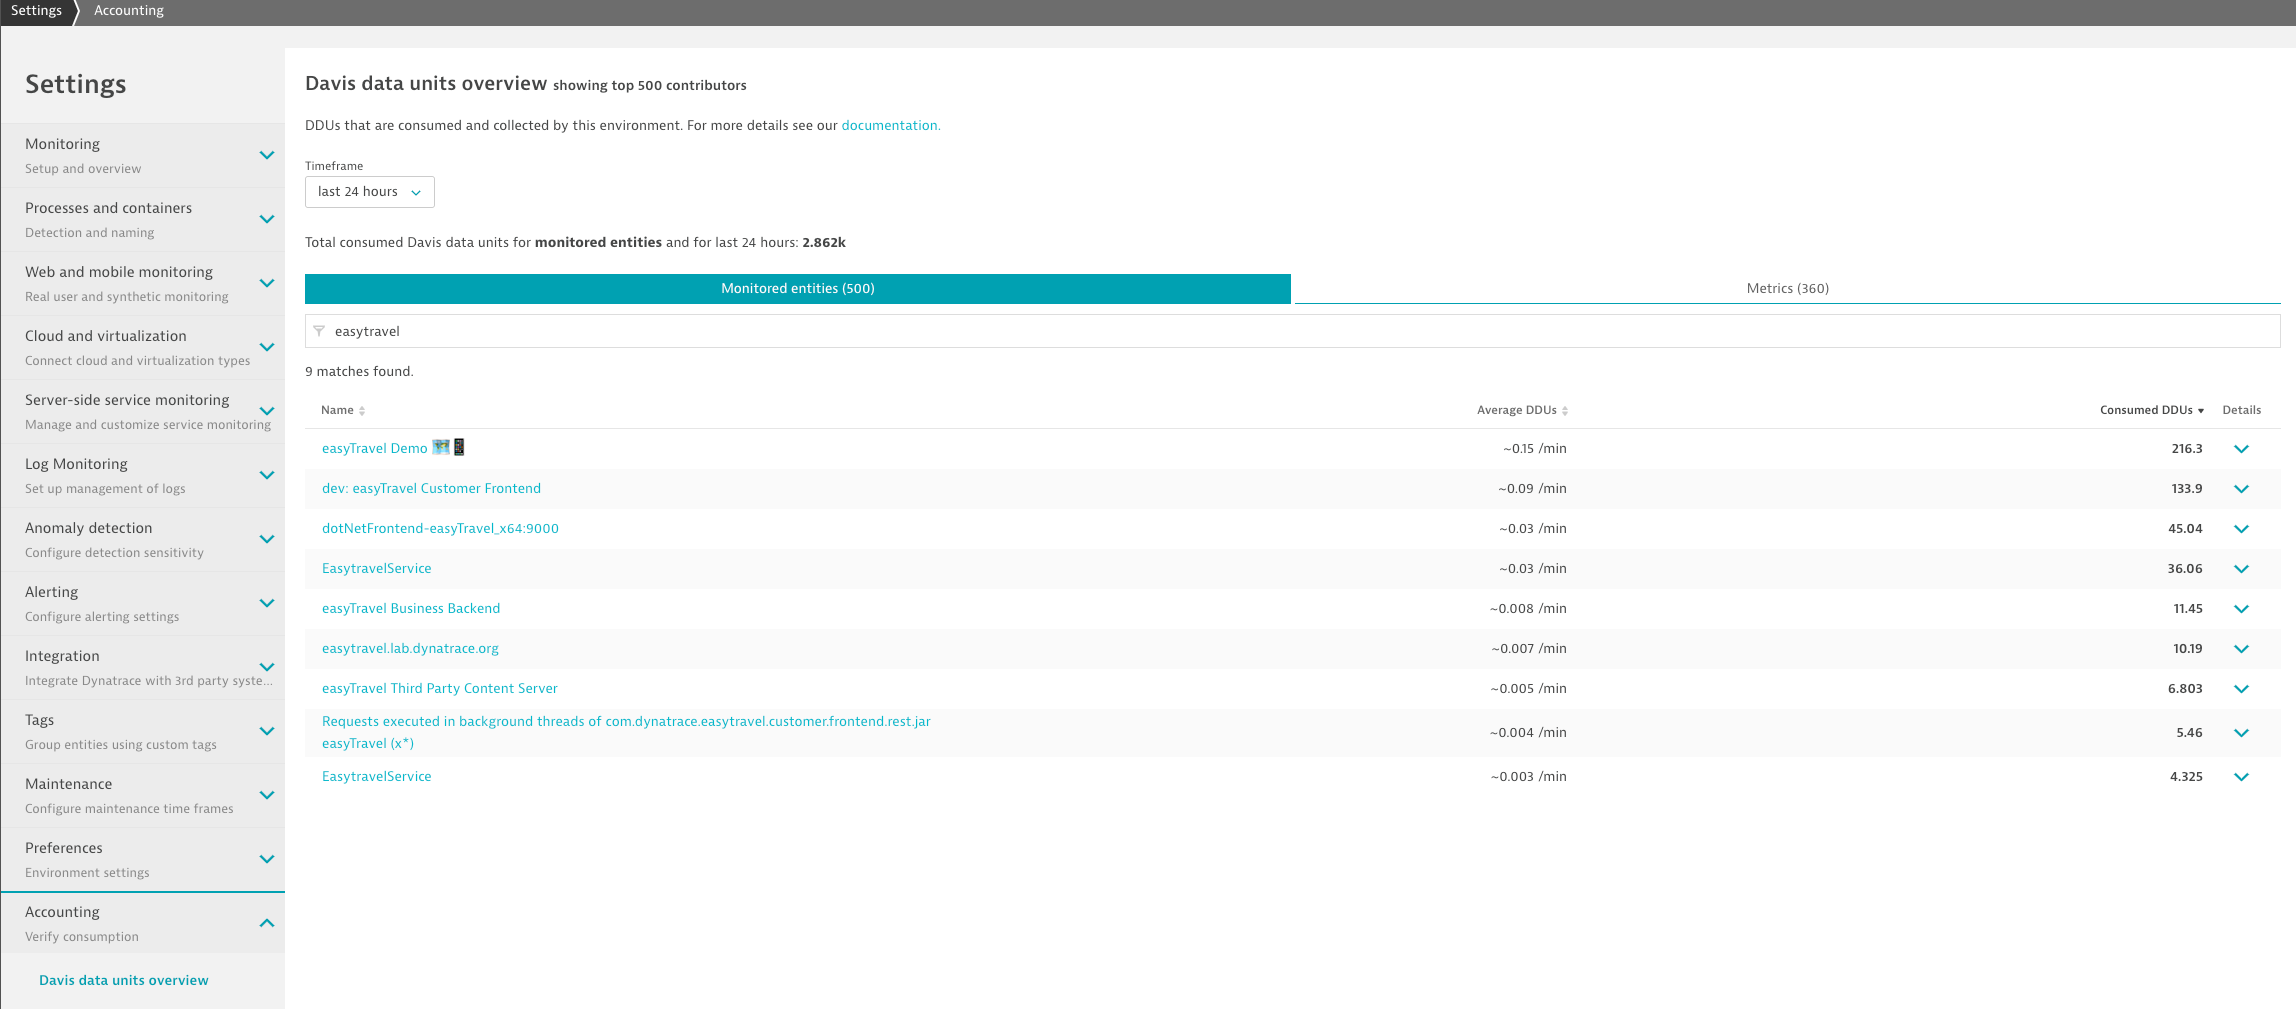
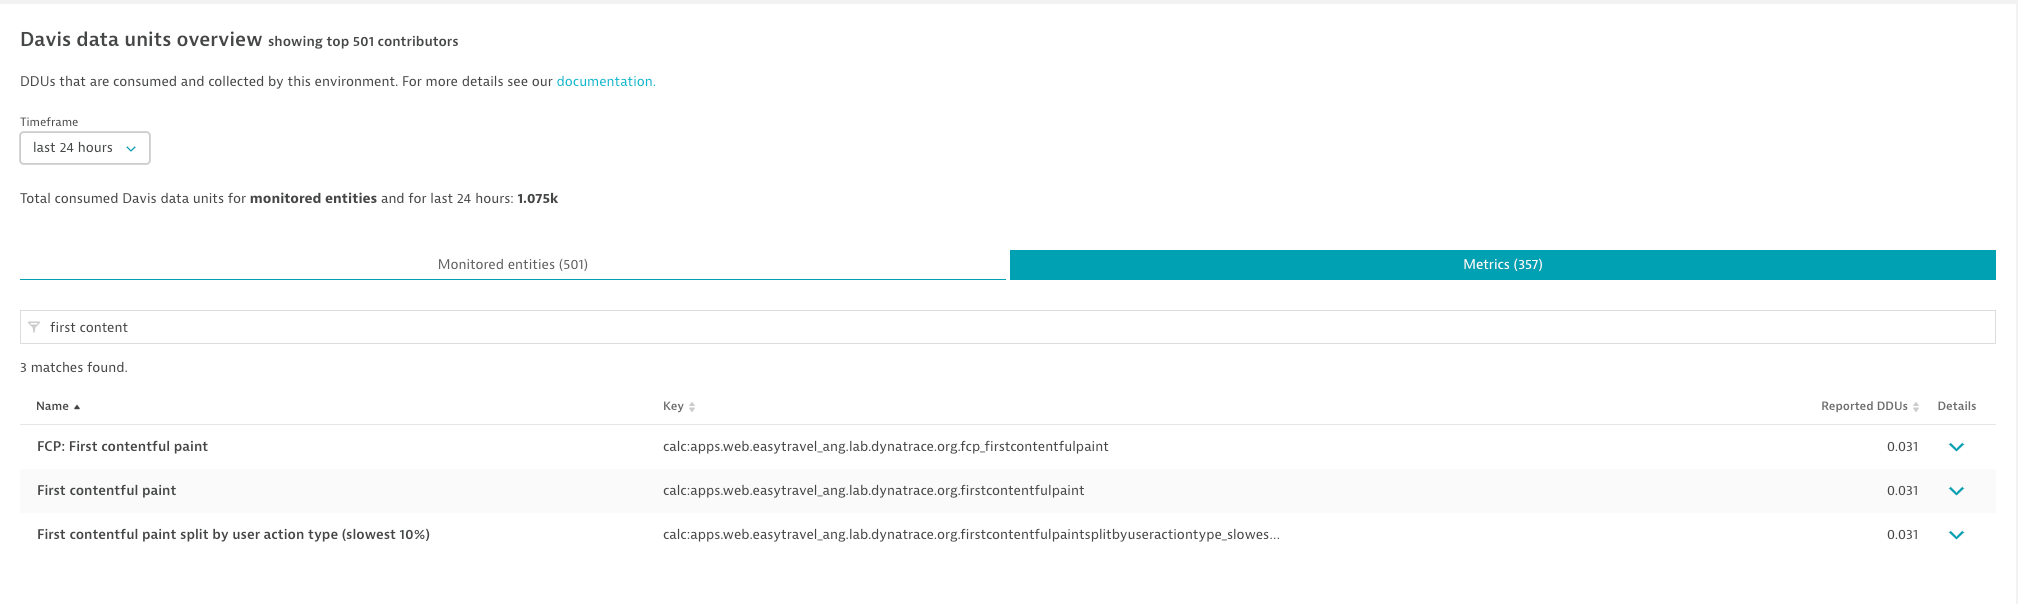
With the introduction of DDUs, we’ve updated our consumption overview to give you full transparency into how many DDUs each metric consumes. The consumption overview page can be found at Settings > Accounting > Davis data unit overview (access requires the Change monitoring settings permission). The page is divided into 3 areas:
- An overview of the Total consumed DDUs for monitored entities within the last x minutes/hours/days (based on selected Timeframe value).
- The Monitored entities tab lists hosts, services, and applications that consume DDUs, in addition to Average DDUs consumed per minute and total Consumed DDUs of top contributors within the selected timeframe. The list items are either linked to the individual monitored entity overview pages or directly to the metrics settings page of the specific entity. The number of consumed DDUs shown in the list is the aggregate of the selected timeframe and reflects any included metrics based on host units (i.e., only billable DDUs consumed by the monitored entity are shown).
- The Metrics tab lists all available metrics and their reported DDUs within the selected timeframe. Note that every dimension of the metric acts as multiplier for DDUs (the same metric on 5 hosts will consume 5 x 0.001 DDUs). Reported DDUs on this tab shows you the total consumption including all dimensions. Be aware that the Reported DDUs column only lists DDUs that are part of the included metrics from host units.
If you run out of DDUs before your contract renewal, you can always purchase more. Reach out to your sales representative for details. Dynatrace provides in-product notifications to inform your users when your consumption of DDUs reaches 90% and 100% of your available DDUs allotment.
In addition to the consumption overview page, we also offer you access to your current DDU consumption via our Environment API v2. We provide the following metrics to query DDU related consumption details:
builtin:billing.ddubuiltin:billing.ddu.metrics.byEntitybuiltin:billing.ddu.metrics.byMetric
In a future release, we will enable you to query DDU-related metrics by management zone.
What happens to my existing custom metric volumes?
With the introduction of DDUs, we will convert your purchased custom metrics volumes into DDUs. For the conversion, 1 custom metric will be converted to 525.6 DDUs (1 data point x 60 minutes x 24 hours x 365 days x 0.001 DDU weight).
>Once introduced, the conversion to DDUs is triggered automatically. We consider the start/end date of your existing licensing term for the conversion of licensed custom metrics. This means that if you are, for example, in the middle of a license term, you will receive an aliquot of 50%. If only 1/4 of your license term remains before renewal, we’ll convert 25%.
The free tier of 200,000 DDUs is added to your account at 100%, independent of the start date.
Examples
Assuming a conversion date of June 30, 2020:
| Term start | Days left in licensing period | Free-tier DDUs | Licensed custom metrics | Converted licensed DDUs | Total available DDUs after conversion |
| Jul 1, 2019 | 1 | 200,000 | 500 | 720 | 200,720 |
| Oct 1, 2019 | 93 | 200,000 | 500 | 66,960 | 266,960 |
| Jan 1, 2020 | 185 | 200,000 | 500 | 133,200 | 333,200 |
| Apr 1, 2020 | 276 | 200,000 | 500 | 198,720 | 398,720 |
For detailed information and more examples about the conversion to DDUs, see Davis data units in Dynatrace Help.
Timeline and action items
DDUs are introduced with Dynatrace version 1.198 (SaaS and Managed). There is no action required on your end to start using DDUs. Once available, we’ll convert your existing license and roll it over to the new DDU model. After the conversion, you’ll receive a notification in the Dynatrace web UI (see notification below).
![]()
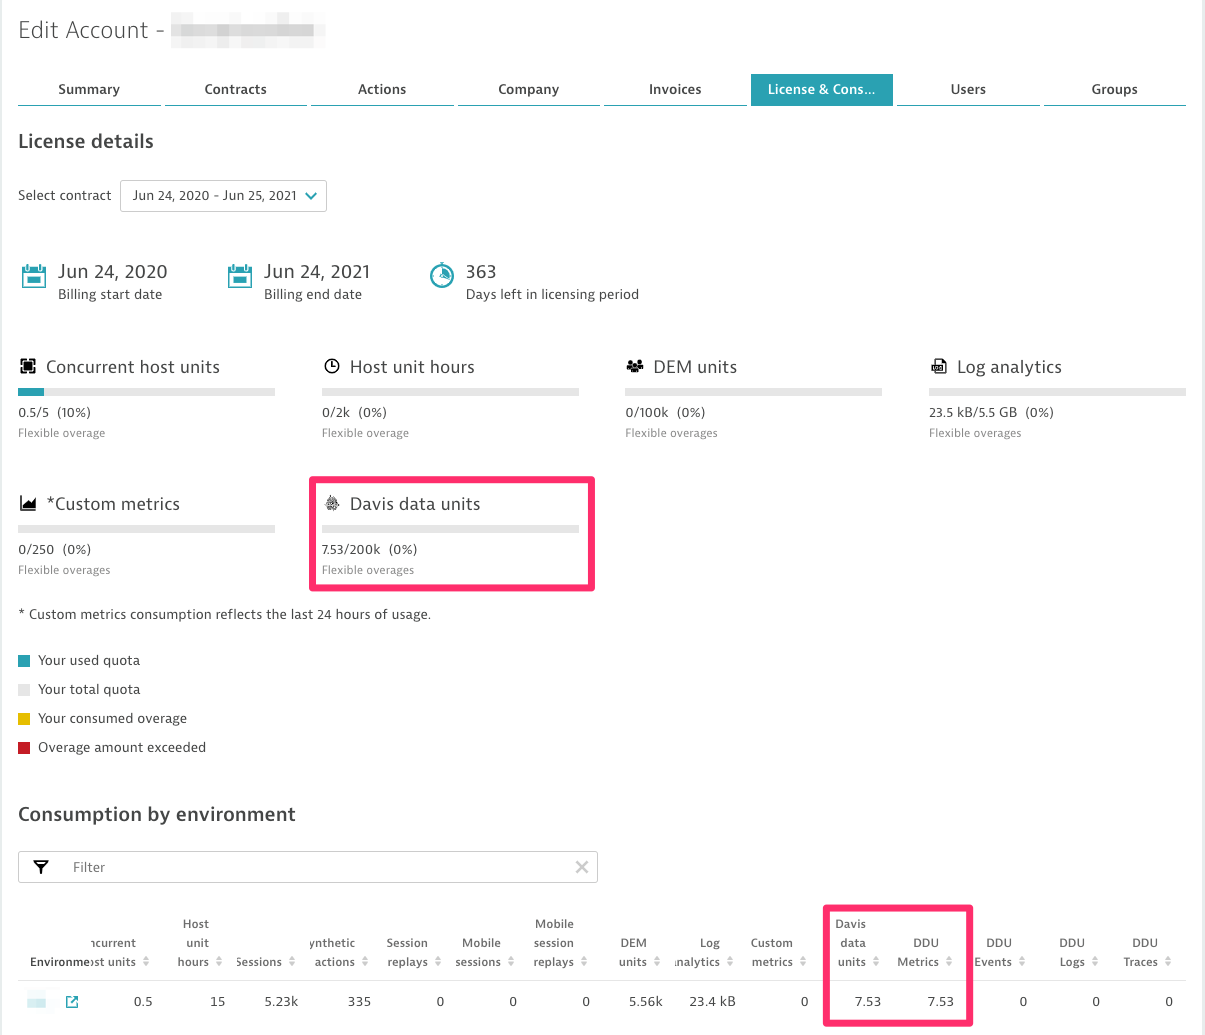
Administrators for Dynatrace SaaS can find the total available DDUs by switching to Account settings > Account > License & Consumption as soon as the conversion is finished:
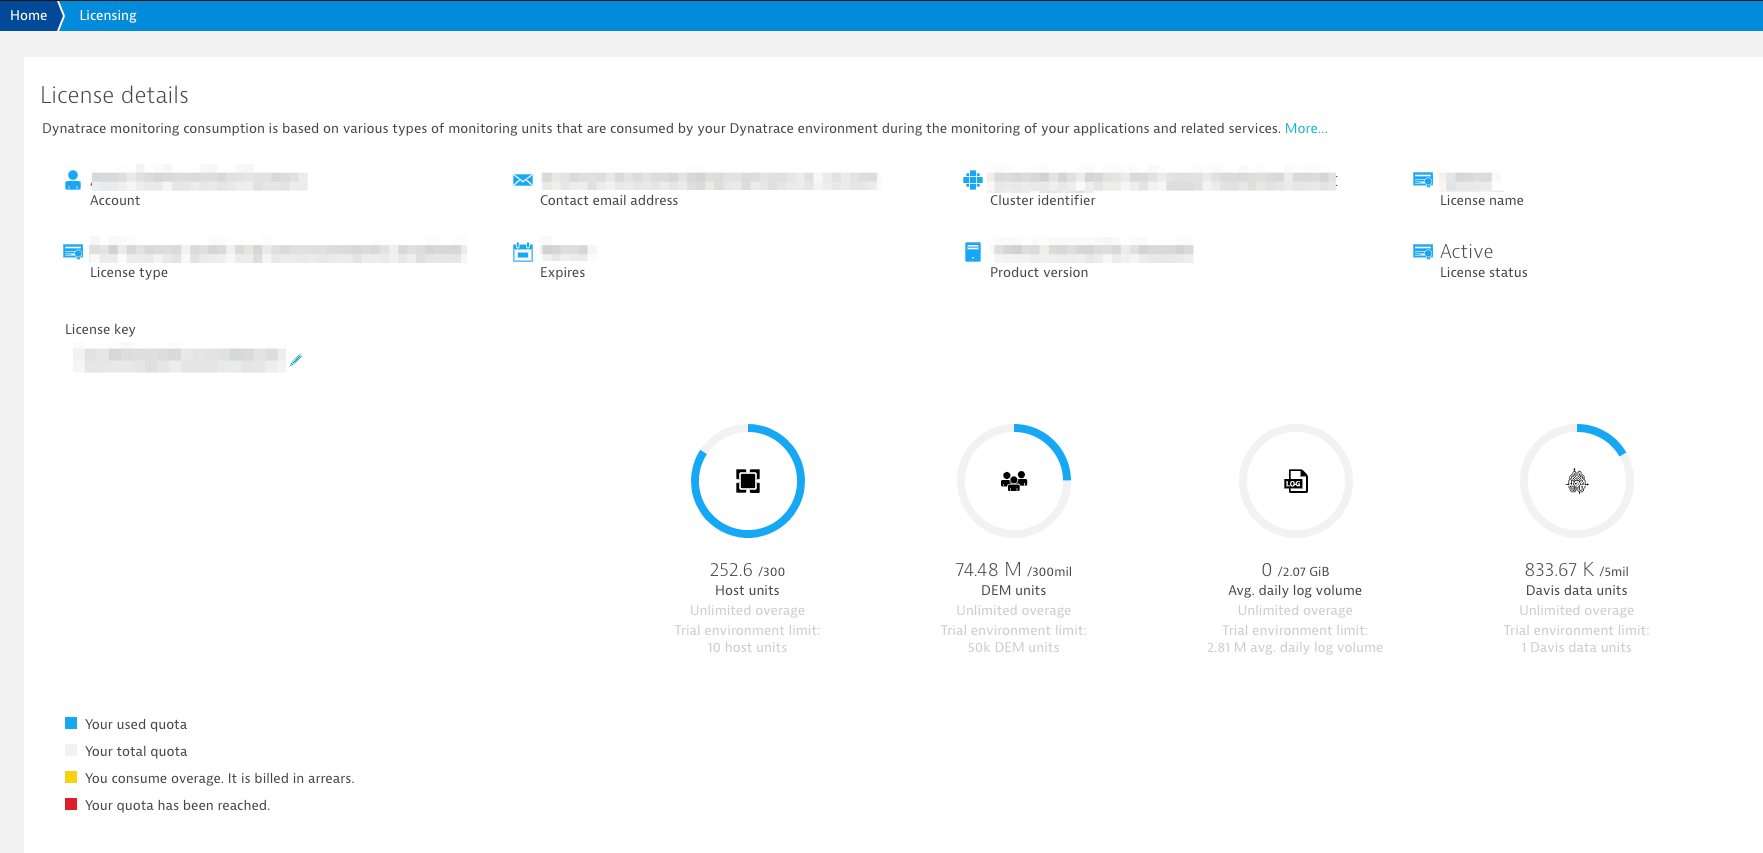
For Dynatrace Managed, Administrators need to access the Cluster Management Console (CMC) and navigate to the Licensing overview.
Charge Davis data units across departments with Management zones
In case you want to perform an internal billing to cross-charge between departments, you can utilize Management zones to divide your organisation. Our comprehensive APIs are exposing this data and therefore, we also created a snippet for you. You can find it here.
What’s next
In a future Dynatrace release we’ll adapt the existing licensing and pricing model for Log Monitoring so that it also uses the new DDU concept. We’ll do the same for events. Other enhancements like quota overage splitting, better time-based visualization will also be made available.
As always, we’d love to hear what you think about the new DDU consumption-based licencing model. Be sure to share your feedback with us at Dynatrace Community.
Webinar about Davis data units
Check out the detailed Webinar about Davis data units.


Looking for answers?
Start a new discussion or ask for help in our Q&A forum.
Go to forum