
As a full stack monitoring platform, Dynatrace collects a huge number of metrics for each OneAgent monitored host in your environment. Depending on the types of technologies you’re running on your individual hosts, the average number of metrics is about 500 per computational node.
Besides all the metrics that originate from your hosts, Dynatrace also collects all the important key performance metrics for services and real-user monitored applications, as well as cloud platform metrics from AWS, Azure, and Cloud Foundry.
All told, there are thousands of metric types that can be charted and that Davis® automatically analyzes and alerts on within your Dynatrace environment. With the introduction of our new metric API version it gets even easier to fetch an API report of all the abnormal metric behavior that Davis AI detects.
Our API-first design promotes automation
Many use cases within your software development and delivery pipelines depend on the real-time metrics that your Dynatrace environment collects. One example is the automatic check of monthly load-test results for performance reporting based on Dynatrace synthetic tests.
The Dynatrace REST API endpoint /api/v1/timeseries has long enabled API consumers to ingest individual metrics for the implementation of external use-cases. With Dynatrace version 1.172, an updated of our metrics API endpoint (version 2) is now available. The latest version is based on our improved metrics framework, which provides:
- A logical tree structure for all available metric types
- Globally unique metric keys that better integrate over multiple Dynatrace environments
- Flexibility to extend Dynatrace and better fit it to your specific business cases
Discover the new features and enhancements of the Metrics API
Following is an overview of the new enhancements, along with some practical examples for each.
New metric identifiers and structure
One of the most important aspects of the newly introduced metrics API endpoint is the logical structure for all Dynatrace metrics. All existing metrics have received new metric identifiers that can be fetched using the metric descriptor endpoint. The previous metric identifiers can still be used in version 1 of the timeseries API, but the identifiers aren’t valid with version 2 of the Metrics API.
Split of metric descriptor from series endpoints
In the previous version of the Timeseries API endpoint, metric descriptors and timeseries data were mixed into a single endpoint, which led to some confusion.
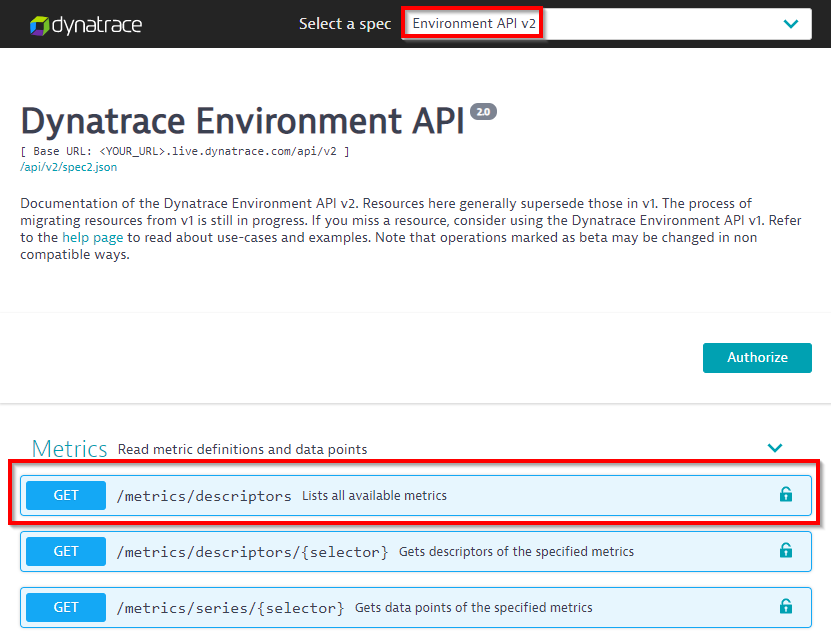
The new version of the Metrics API splits metric descriptors and timeseries data endpoints into separate endpoints:
/api/v2/metrics/series/api/v2/metrics/descriptors
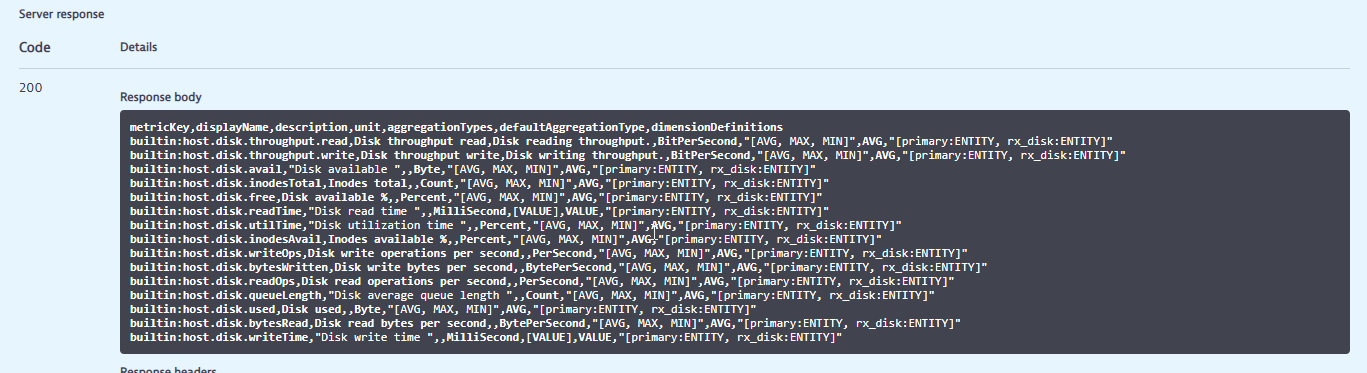
To query all available metric descriptors, call HTTP GET /api/v2/metrics/descriptors to receive the list of all defined metric types within your monitoring environment. For convenience purposes, you can also receive the information as a CSV list or as JSON payload. See an example below:
The complete list of Dynatrace metrics has been rearchitected based on a logical tree structure that helps you query related metrics.
Use an asterisk (*) as a wildcard character to query for all host and disk related metric definitions, as shown below:
Efficient query strings for selecting one or more metrics
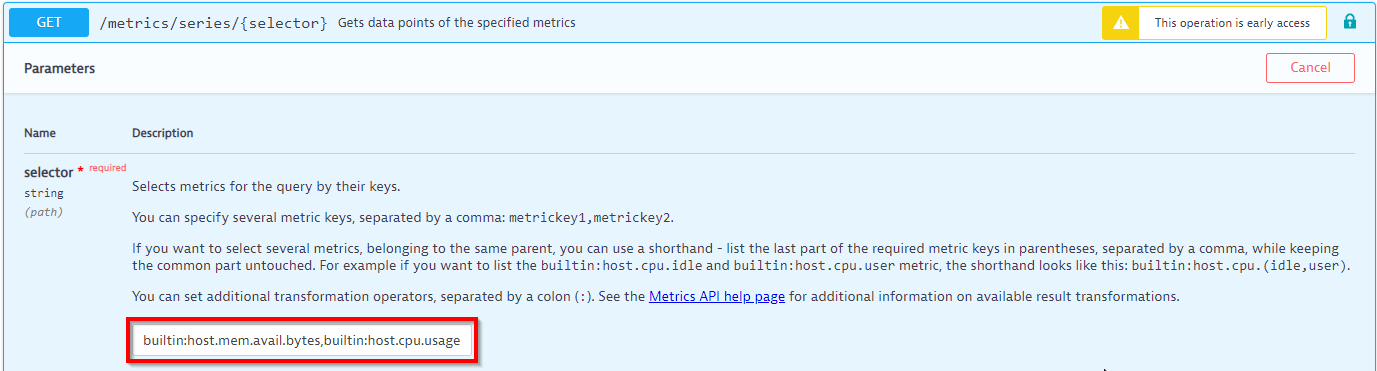
One of the most requested features for the Metrics API was the ability to fetch more than one type of metric within a single API request. Version 2 of the metric series endpoint allows you to query multiple metric types across a set of entities using convenient query strings.
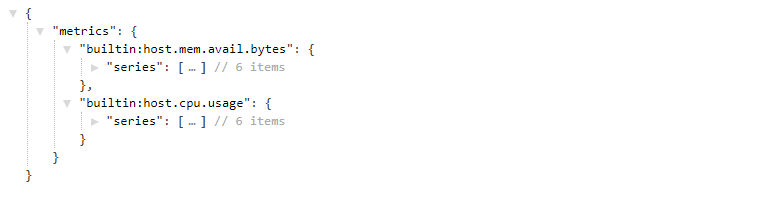
The example below shows a typical API call to request a CPU metric as well as a memory metric for all hosts within an environment:
The resulting timeseries is split into the memory and CPU measurements:
Use query strings to select metric percentiles
The newly introduced query selector string provides a lot more power than just the ability to select metrics. The query string also allows you to transform results by applying an aggregation function (for example, to get a percentile, as shown in the example below).

Other useful aggregation functions are sum, avg, min, and max.
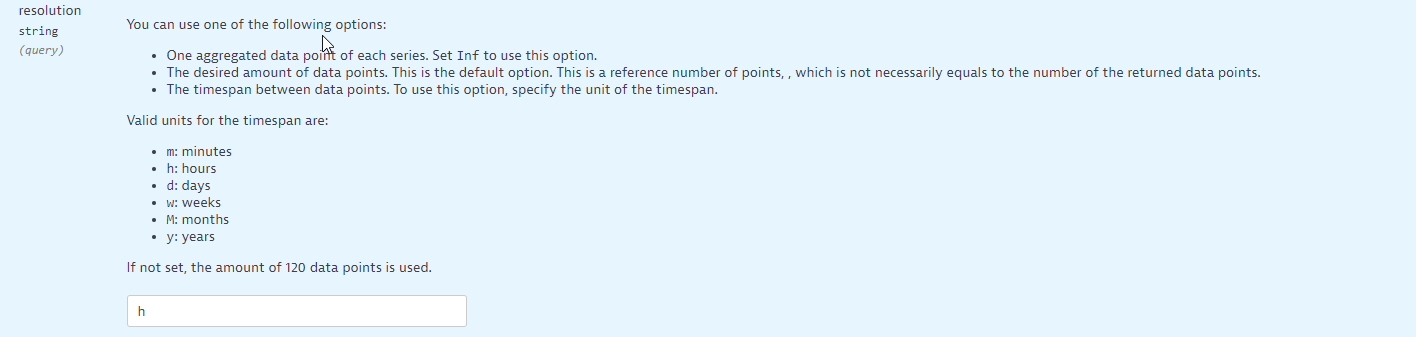
Select the resolution of your metrics
Many use cases demand a specific resolution for fetched timeseries, such as hourly resolution, minute resolution, or even the total value during a given time period.
The example below shows how to fetch a CPU metric at hourly resolution:
Need a metric in CSV format?
While automation use cases often require programmatically processable results in JSON format, there is also often a requirement for the direct import of Dynatrace data into Tableau or Excel.
The new API endpoint supports JSON as well as CSV format by specifying the HTTP header Content-Type’ : ‘application/csv.
This convenient feature allows for immediate and seamless import of data into Excel and third-party reporting tools.
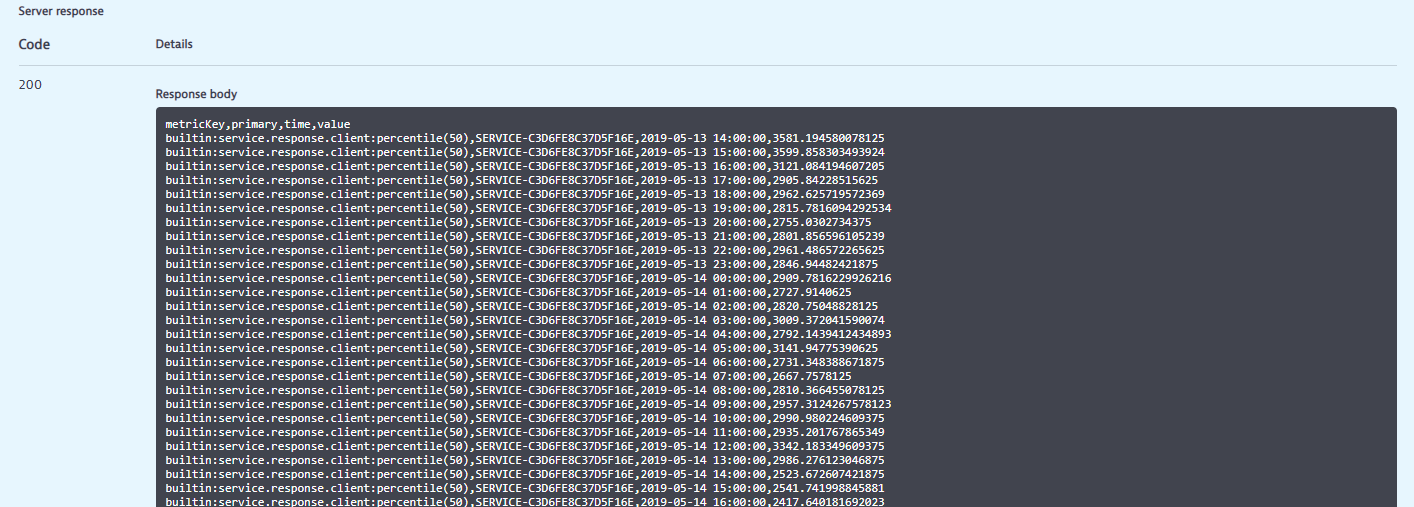
The option to export CSV format through the Dynatrace API allows you to directly create an Excel data source that can be updated whenever required by performing a simple refresh. In this way, your Excel charts can remain up to date based on the latest Dynatrace delivered KPIs, as shown below:
curl -X GET "https://<YOUR_URL>/api/v2/metrics/series/builtin:service.response.client:percentile(50)?resolution=h&from=now-2w&to=now" -H "accept: text/csv; header=present; charset=utf-8" -H "Authorization: Api-Token <YOUR_TOKEN>"Here’s an example set of results in a CSV export that can easily be processed by Excel:
Convenient date and time selector
Compared to the previous version of our Timeseries API, version 2 offers more convenient date and time selection. The newly introduced date time format for specifying the from and to parameters allows you to choose between millisecond timestamps, human-readable date and time format, and relative times, such as last 2 days.
The following examples show how much easier the selection of a timeseries timespan is with version 2 of the API endpoint:
Receive a metric for the last week:
from=now-2w&to=now-1w
Receive a metric for the timespan between two given dates in the past:
from=2019-12-21T05:57:01.123+01:00&to=2019-12-22T05:57:01.123+01:00
Receive the timestamp in UTC millisecond format:
from=1558963489634
Receive a metric for a given date and time aligned with a specific URC timezone:
from=2019-12-21T05:57:01.123+01:00
In upcoming releases, we’ll begin using this date time format as a consistent means of selecting dates within all our API endpoints.
Flexible filters for focusing on relevant results
One of the most important features of web-scale monitoring solutions like Dynatrace is the ability to efficiently apply filters to reduce result sets.
Efficient filters allow you to reduce the network bandwidth necessary to transfer data as well as to speed up result queries in general.
Whenever possible, use filters to focus your result set on the entities within Dynatrace that you’re interested in, instead of fetching all available data.
While in the past multiple parameters were used to apply filters, in version 2 of our Timeseries API, a combined query string is used.
Some of the most important filter queries are shown within the examples below:
Filter by a given management zone with name easyTravel or use multiple management zone filters:
scope=mz(easyTravel)
scope=mz(easyTravel, production)
Filter by given entities:
scope=entity(HOST-123445678, HOST-23456789)
Filter by entity names:
scope=entity(easy)
Combine multiple filters:
scope=mz(easyTravel, production),name(easy)
Summary
The completely reworked new version of the Dynatrace Metrics REST API comes with many improvements that have been requested by Dynatrace customers over the last 5 years.
The new version offers a lot more convenience in building metric queries and it allows you to efficiently filter huge result sets.
The Metrics API introduces some necessary limits that help you to keep your metric requests stable and not trigger huge queries that could result in Gigabytes of result size.
The redesigned consistent structure of all available metrics within Dynatrace is aligned with recent improvements in custom charting and dashboarding. Custom charting, including API-based charting, and dashboarding now deliver a consistent view of all available metrics. The goal is to offer the same query and filtering features seamlessly across both the Dynatrace web UI and the REST API.
These recent changes further position Dynatrace as a platform that offers the same power in its integration APIs as it does in its web UI.
With the introduction of version 2 of our Timeseries endpoint, we will no longer introduce new features in version 1 of the endpoint. The version 1 endpoint will continue to be supported. We’ll announce a discontinuation date for version 1 at a later time.
Last, but not least, please stay up to date with our progress and changes with the Dynatrace APIs by reviewing our API release notes on a regular basis.
Start a free trial!
Dynatrace is free to use for 15 days! The trial stops automatically, no credit card is required. Just enter your email address, choose your cloud location and install our agent.


Looking for answers?
Start a new discussion or ask for help in our Q&A forum.
Go to forum