
Every Java developer knows the story: Java harnesses the power of garbage collection to automatically keep application memory clean and healthy. I’ll tell you what though, this is only half the story. While helpful, garbage collection performed automatically in the background isn’t a surefire way of protecting your app from memory leaks.
You know that your app is in trouble when you come across the following message:
java.lang.OutOfMemoryError: Java heap spaceIf the issue is really too little allocated memory, you can increase the available memory for your application as follows:
java -Xms<initial heap size> -Xmx<maximum heap size>However, if your problem is a memory leak, this approach only shifts the problem.
Identifying memory leaks
You should check your app for memory leaks even before putting it into production. As an initial indicator, check the garbage collection metrics.
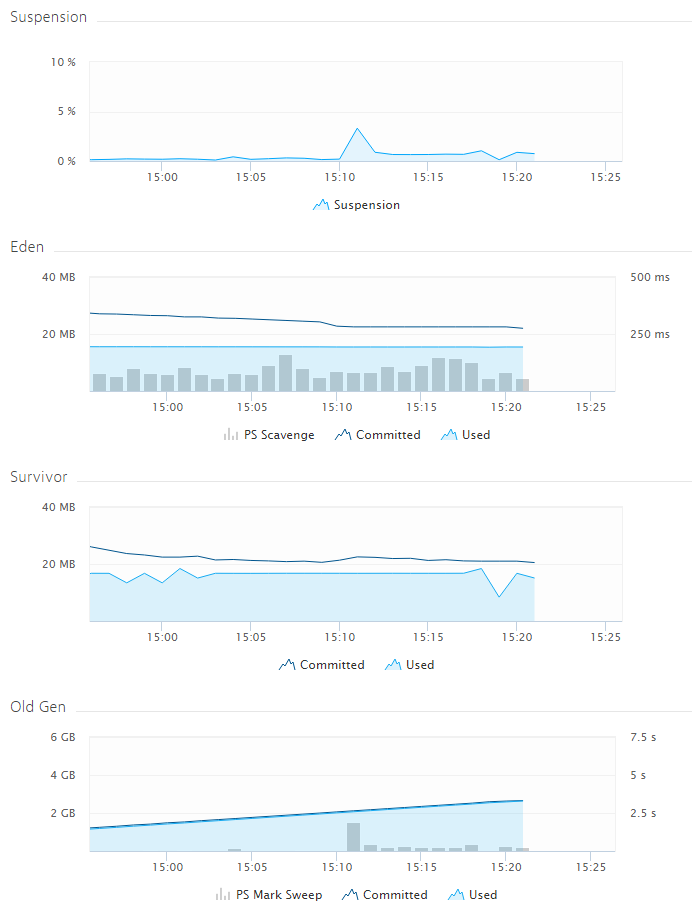
If memory usage returns to the same level following GC, all is well. However, if memory rises continuously, you have a problem. The screenshot above shows a provoked memory leak. The code has been taken from this gist on github.com. While in reality, memory consumption would not rise as linear as in this example (Old Gen is the graph of interest), it clearly shows that GC suspension times or Eden and Survivor space usage do not necessarily act as indicators for memory leaks.
Nailing down the problem
You have a few options for identifying the cause of such memory issues (for example, JVisualVM and jStat). These tools come with the JDK, so you can jump in any time and begin investigating. In addition to identifying some frequently used internal Java classes, you may be able to identify some of your own classes.
Optimizing and tuning
You probably don’t typically care much about how your memory settings are configured—at least as long as garbage collection isn’t impacting Java performance. This can be a problem because memory issues don’t only manifest themselves in the form of out-of-memory errors and memory leaks. Upcoming memory issues might manifest themselves in the form of high garbage collection times (but not always).
Heap size set to small
Heap size set too low leads to increased GC activity because GC must be executed more often. As you might imagine, increased GC usage leads to increased CPU usage and—as JVMs tend to freeze during GC—often bad performance. GCs tend to be short, but frequent.
Heap size set to large
Heap size set too large manifests in the form of long GC times. GC isn’t performed too often, but once triggered, it stops your VM for a considerable amount of time.
Now consider how a memory leak contributes to such a situation: a memory leak combines the problems of too small heap size with the problems of too large a heap size: GC is triggered frequently and it takes a long time before the JVM finally crashes with an out-of-memory error.
GC versions
The garbage collector has changed a lot since Java 6. Java 7 introduced the G1GC as an alternative to the stock CMS GC (concurrent mark and sweep) which is slated to become the default for Java 9. Java 8 dropped the PermGen space. The data stored there previously is now stored in either native memory or on the stack.
Though Dynatrace takes these differences into account automatically, it’s a good idea for you to understand the subtle differences.
A final thought
In addition to displaying JVM stats, Dynatrace shines because it correlates JVM metrics with other key indicators. No other tool makes it so easy to compare GC suspension times with CPU usage, network traffic outages, and more. This makes it easy to think outside the box—unusual JVM behavior may result from misbehaving GC, but this isn’t always the case.
Further reading
Learn more about Java garbage collection in the eBook Chapter How Garbage Collection Works


Looking for answers?
Start a new discussion or ask for help in our Q&A forum.
Go to forum