
Some time ago, when we first announced the concept of digital touchpoint monitoring in Dynatrace, we introduced the custom application type as part of the beta program that allows you to monitor all end-user interactions with your business using OpenKit for Java and .NET environments. We’ve since gathered lots of feedback and improved several things. Today, we’re ready to make custom application monitoring with Java and .NET generally available.
Custom applications created during the beta period
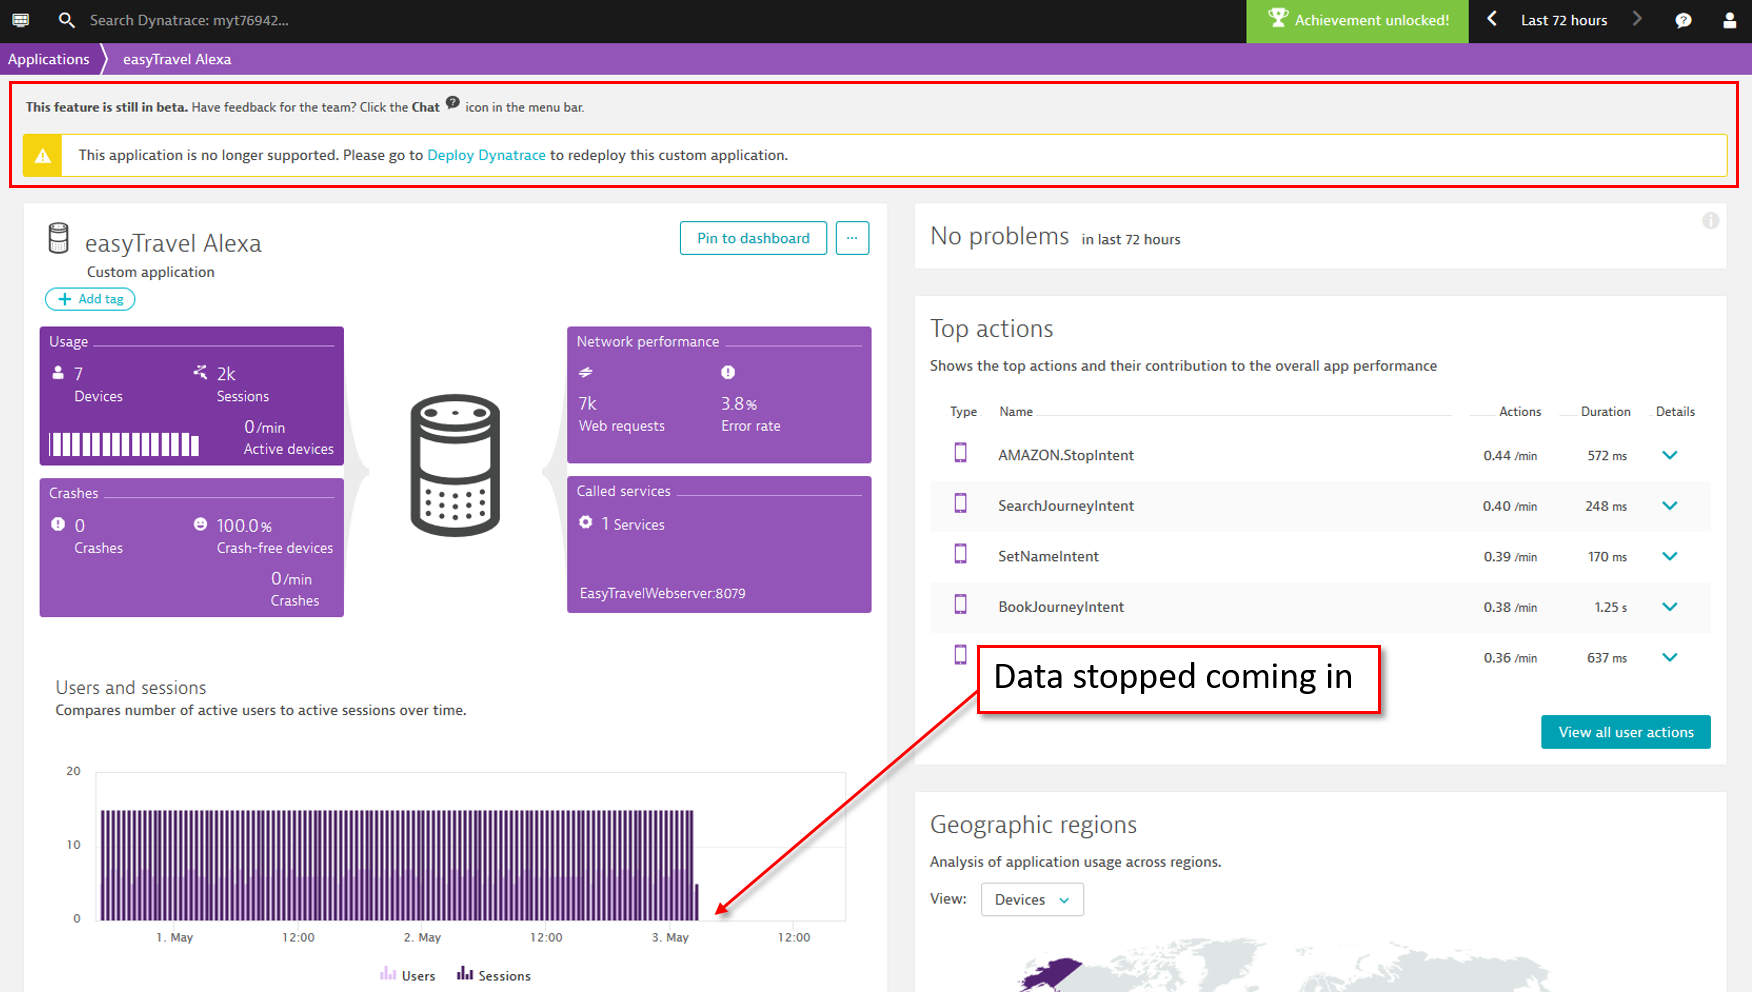
If you participated in the public beta program and defined any custom applications in Dynatrace, you’ll now see a deprecation message at the top of each application’s overview page (see example below). Custom applications created during the beta period no longer receive monitoring data. You must re-define any custom applications that you want to use going forward, including updating the instrumentation in your code to point to the new application definitions.
Define a new custom application using the deployment wizard (Select Deploy Dynatrace from the navigation menu) and modify your code to use the new application ID. 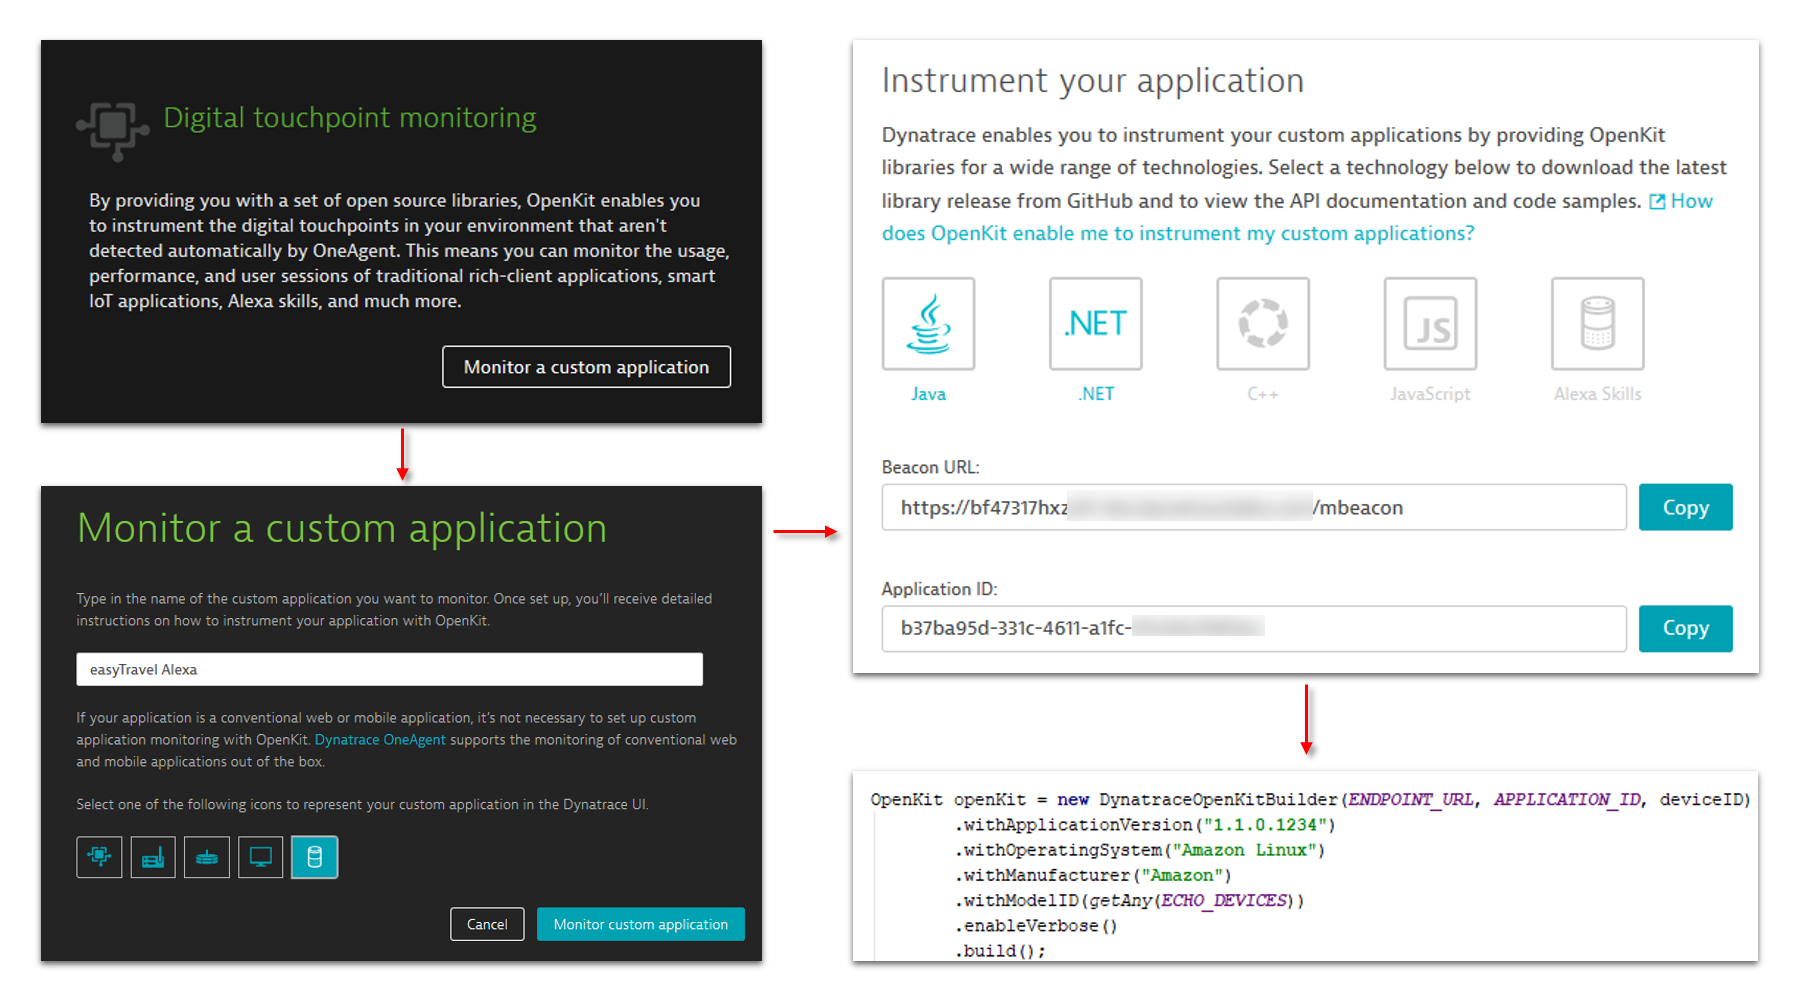
Run your newly instrumented application. You can monitor the incoming beacons within application settings. As soon as the beacons arrive, you’re all set.
![]()
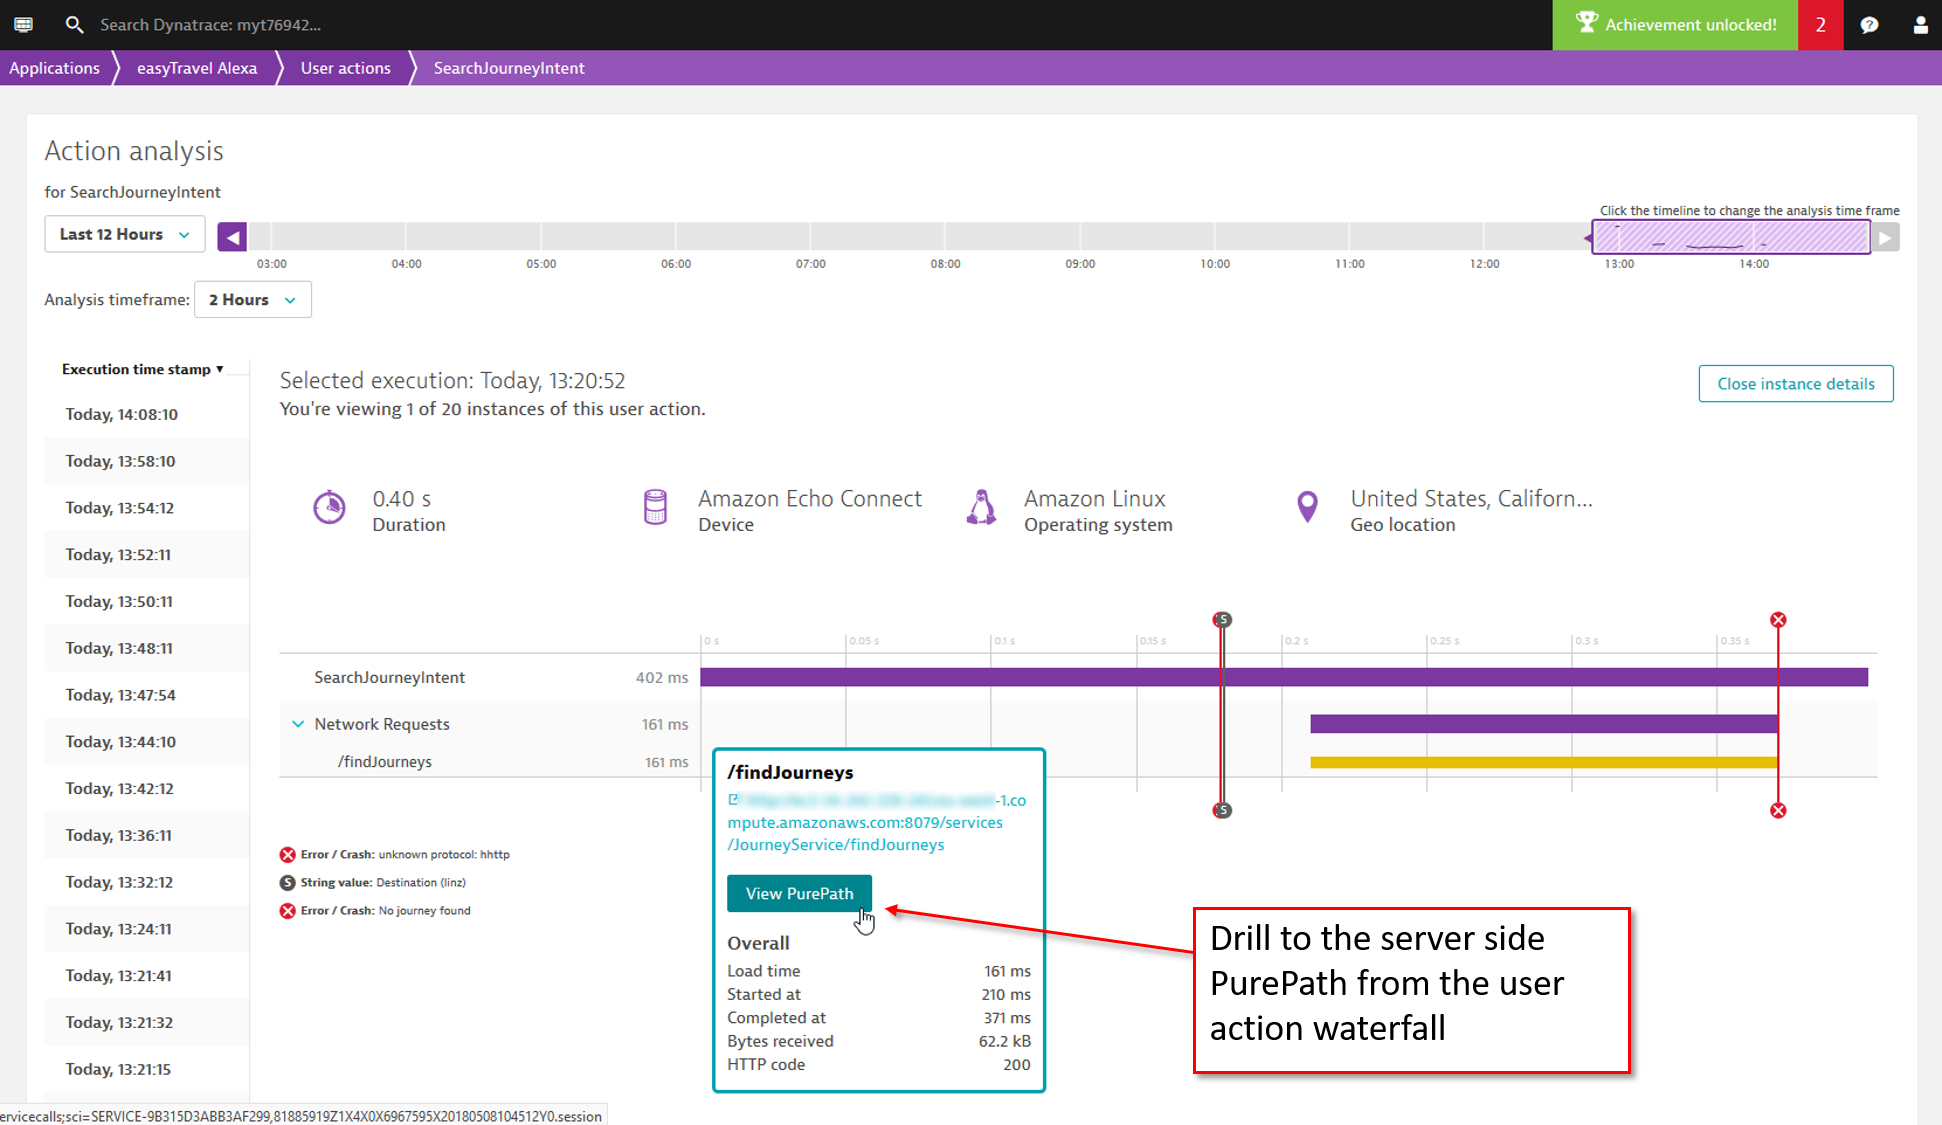
Drill from User actions analysis view down to PurePath view
On each User actions waterfall analysis page you’ll now find a View PurePath button that enables you to jump from specific web requests directly to the corresponding server-side PurePaths.
What’s next?
We also have an Early Access Program in place for the OpenKit native library, which allows you to instrument C/C++ applications. If you’d like to join this EAP, please get in touch with me.


Looking for answers?
Start a new discussion or ask for help in our Q&A forum.
Go to forum