
Learn how Dynatrace unifies synthetic monitoring, traces, and logs for instant insights.
Anomalies are clues that something in your system isn’t behaving as expected. Detecting these early warnings gives SREs and developers a critical window to investigate and resolve the issue before they impact customer experience. But detection alone isn’t enough. You need to identify the root cause so teams can take action before a minor glitch cascades into something more serious that impacts revenue and customer experience.
Dynatrace automatically connects synthetic monitoring, traces, and logs, so you can go from spotting an anomaly to uncovering the exact root cause in under a minute. Without a unified solution, you’d have to sift through logs spread across different systems, which is not only time consuming but can also result in human error. With Dynatrace, you can drill down to the failed test execution and then jump directly into distributed trace and related logs to expose the precise error in code. Instead of just showing data, Dynatrace delivers answers fast.
Let’s take a look at how this works in practice by walking through an example.
From error to answer in a few steps
The Dynatrace platform was built to solve complex challenges, whether they originate in the frontend, backend, or database. Modern applications are distributed systems, where a single user action can trigger a chain of events across dozens of services. To understand this chain, you need to link the beginning (the user’s action) to every subsequent step. Synthetic monitoring and distributed traces are powerful capabilities that provide visibility into this complex chain, but only when automatically connected do they deliver easy insight into end-to-end performance and user experience.

Now, let’s walk through this process step-by-step.
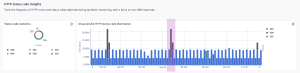
1. Spot the anomaly on the dashboard
Our journey begins on the ready-made synthetic monitoring dashboard. This high-level overview aggregates results from all monitors and locations, making it easy to spot issues—like a sudden spike in HTTP 500 errors in our travel booking system. Each of these errors could negatively impact user experience, so we want to get to the bottom of this quickly before we see a major degradation of service that could lead to lost revenue or brand reputation damage.
A single click on the problematic metric begins the investigation.
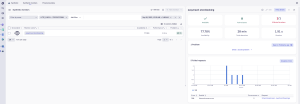
2. Isolate the failing monitor
With the context of time and error type carried over, you’re directed to a filtered list of all synthetic monitors that experienced a 500 error in that timeframe. Here, we can instantly see that the Easytravel storeBooking monitor has a low availability of 77.78% and has registered five failed requests.
Clicking “Analyze errors” allows us to drill down further.
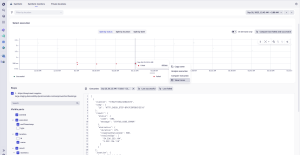
3. Analyze the failed execution
This page presents a list of individual test executions over time. On this timeline, you can instantly identify the specific failed run (marked in red) and move from a general problem to a concrete instance of failure. Selecting the failed execution and clicking “View traces” is the final step in our investigation.
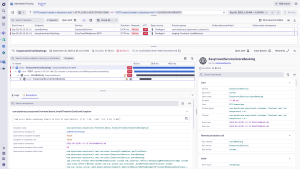
4. Uncover the root cause with distributed tracing
With one more click, you’re taken across the automated bridge to the Distributed Tracing Explorer. Dynatrace automatically carries over all the context, showing you the exact end-to-end trace for that specific failure.
Here, the root cause is exposed. The trace shows that Exceptions are captured, also linking directly to the related logs. There, the technical reason and the detailed error message is waiting: an ArrayIndexOutOfBoundsException occurred within the storeBooking service. This tells you precisely what broke in the code and where to look to solve the 500 error spike. Dynatrace consolidates this experience onto a single platform, saving you the time and effort that would have been required to sift through disjointed pieces of data scattered across multiple tools and enabling you to solve the problem before it escalates.
The advantage: actionable answers, not disjointed data
This entire workflow, from a high-level dashboard to a code-level root cause, takes less than a minute! Whether you start from a dashboard or the Problem app, the result is the same: you get a definitive, actionable answer in moments.


Looking for answers?
Start a new discussion or ask for help in our Q&A forum.
Go to forum