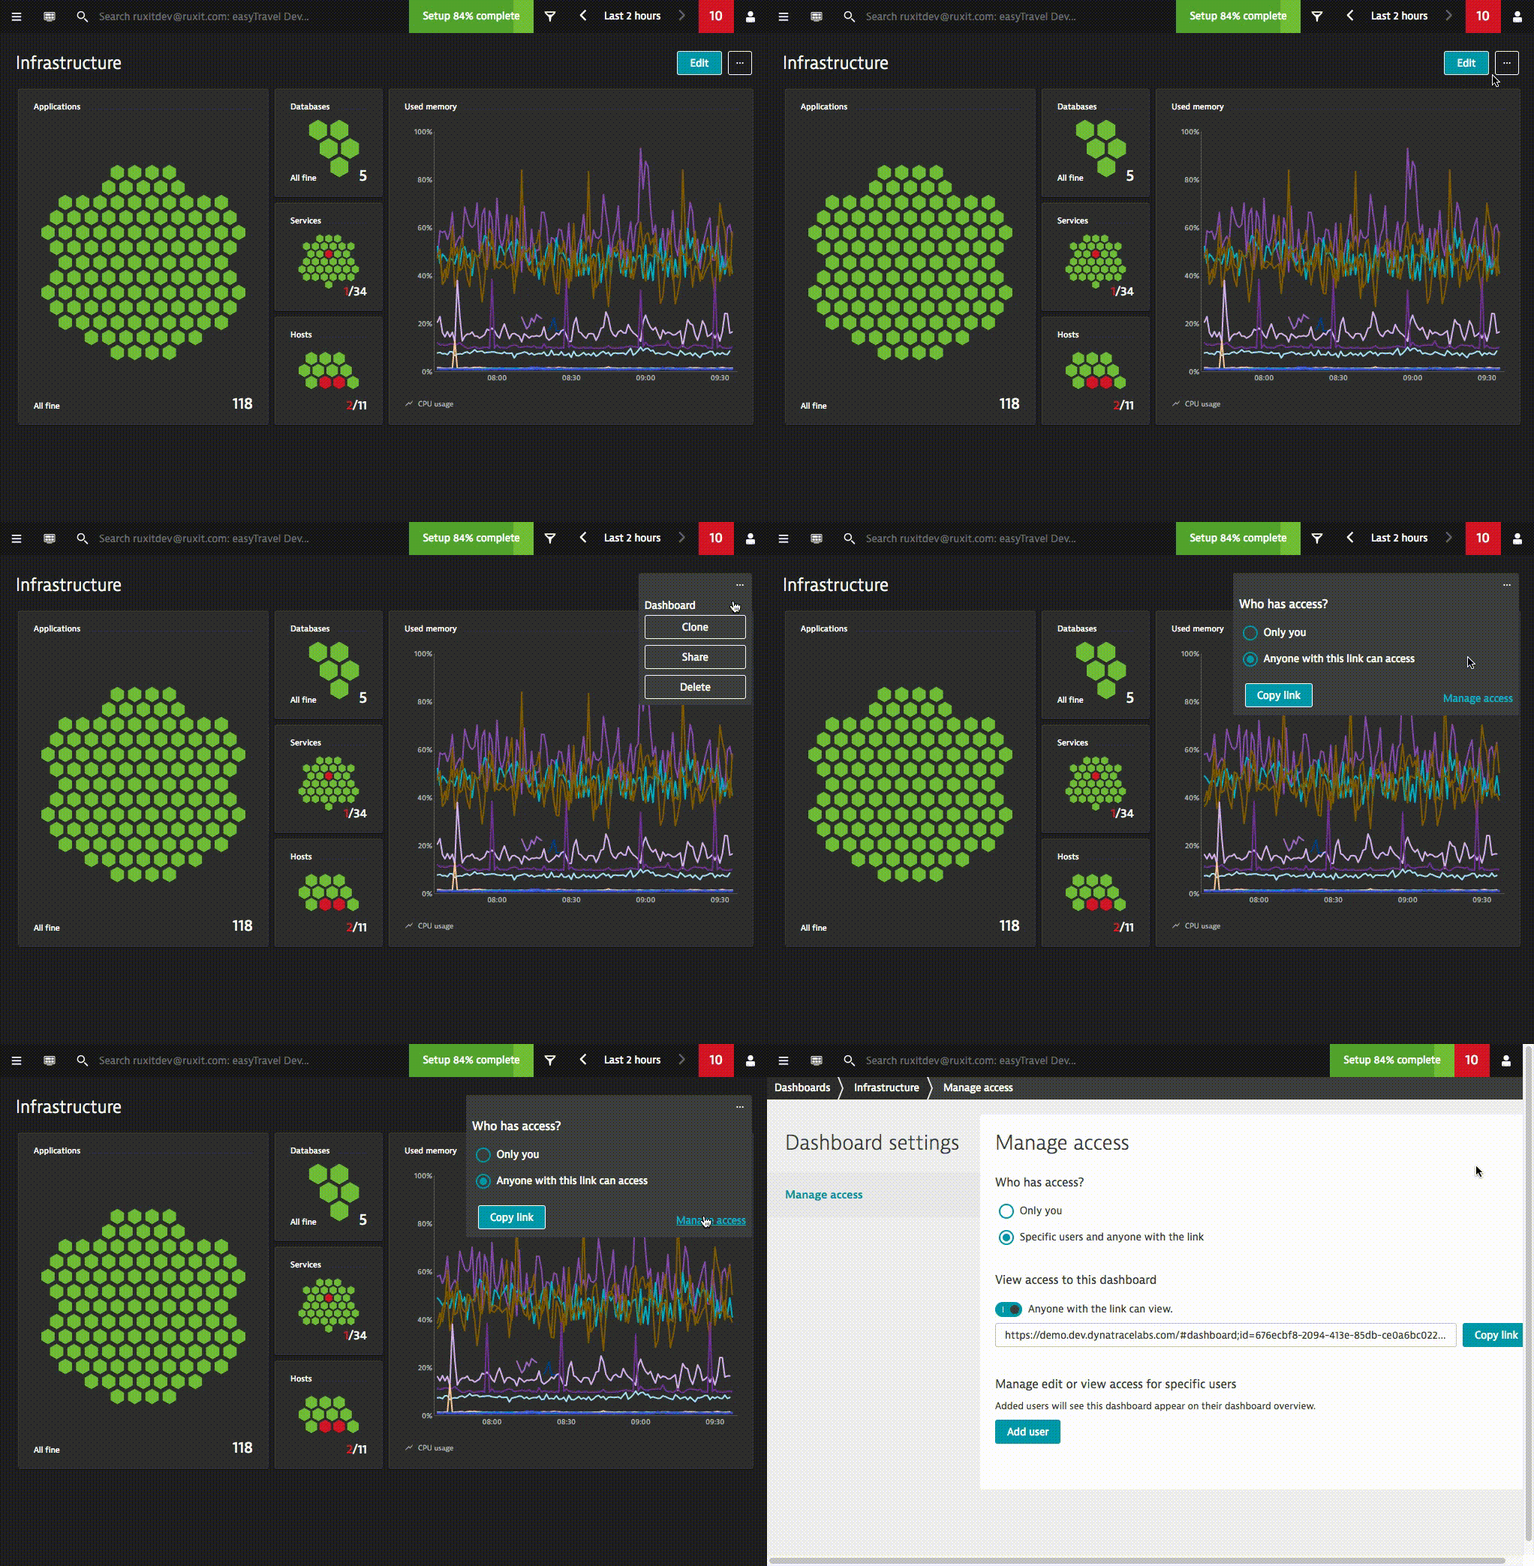
In an earlier dashboarding blog post, we told you about our ongoing journey to make all the hidden treasures of Dynatrace easily discoverable on your dashboards. Now it’s time to follow up and talk about how this update helps you to collaborate and share your insight across teams.
Allow people to collaborate
Our DevOps team creates amazing dashboards to monitor the health of many of our customer’s monitoring environments. While the team relies on the Dynatrace AI to alert them when problems occur, they use dashboards to integrate critical monitoring data into a single dashboard so that they can share their insights across the organization. And, with the ability to assign edit permissions to team members, they no longer need to clone a dashboard to make changes when the dashboard’s creator is unavailable.
We’ve also cared about saving you time by automatically publishing the dashboard to the team members you’ve assigned either edit or view permissions. So copy-pasting URLs is not needed anymore.

Full-fledged access control
This update provides you with the convenience of full control of who has access to your dashboards. Dashboard owners can now restrict access to specific team members, or even disable sharing entirely where appropriate.
What you get with this update
- Quick & easy sharing via URL
- Edit permissions for specific users
- Fine-grain control over user access to dashboards
- Ability to disable dashboard access
- Automatic publishing to people with view or edit permissions.
What’s next
While we’ve worked hard to address the most critical cross-team dashboarding use cases, we’d love to get your feedback to make Dynatrace dashboarding even more effective. Have suggestions? Be sure to share them in our Dynatrace Community forum at Planned enhancements for custom dashboards.
We’re currently focused on delivering more charting power and a more streamlined dashboard creation workflow. Here are highlights of what we’ll tackle next:
- More metrics and improved workflow for custom charts
- Improved analysis of peaks and points-of-interest within custom charts
- New dashboard-tile catalog and tile configuration
- More chart types


Looking for answers?
Start a new discussion or ask for help in our Q&A forum.
Go to forum