We just wrapped up Perform 2018 and now it’s time to focus on this year’s Big Game. Last year, reports from Adweek had 30-second spots running $5 million USD, and reports this year are that ads are in the same price range. The ads aired during the Super Bowl represent the advertising brands best creative efforts and are substantial investments. The goal of these ads to is drive brand awareness and after the Super Bowl is over, the most cost effective way for these brands to interact with consumers is via their digital channels.

TOC:
- Prepping for the digital tail gate party, Feb 3
- Who’s advertising this year and what’s at stake, Feb 4th 10:00am
- New Players and New Plays, Feb 4th 11:15am
- The Super Bowl runs on technology, Feb 4th 12:00pm
- How about some Instant Replay?, Feb 4th 1:30pm
- T-minus 4 Hours, Feb 4th 2:30pm
- Aw, Snap, Feb 4th 3:30pm
- Puppies… I love Puppies, Feb 4th 4:30pm
- Time for some Super Bowl RUM punch, Feb 4th 5:30pm
- Quick Update on fast Advertisers, Feb 4th 6:00pm
- Game Time!, Feb 4th 6:30pm
- Second Quarter, Feb 4th 7:15pm
- Half Time, Feb 4th 8:15pm
- Third Quarter, Feb 4th 9:00pm
- Fourth Quarter, Feb 4th 9:30pm
- Final! Feb 4th 10:15pm
Final!, Feb 4th 10:15pm
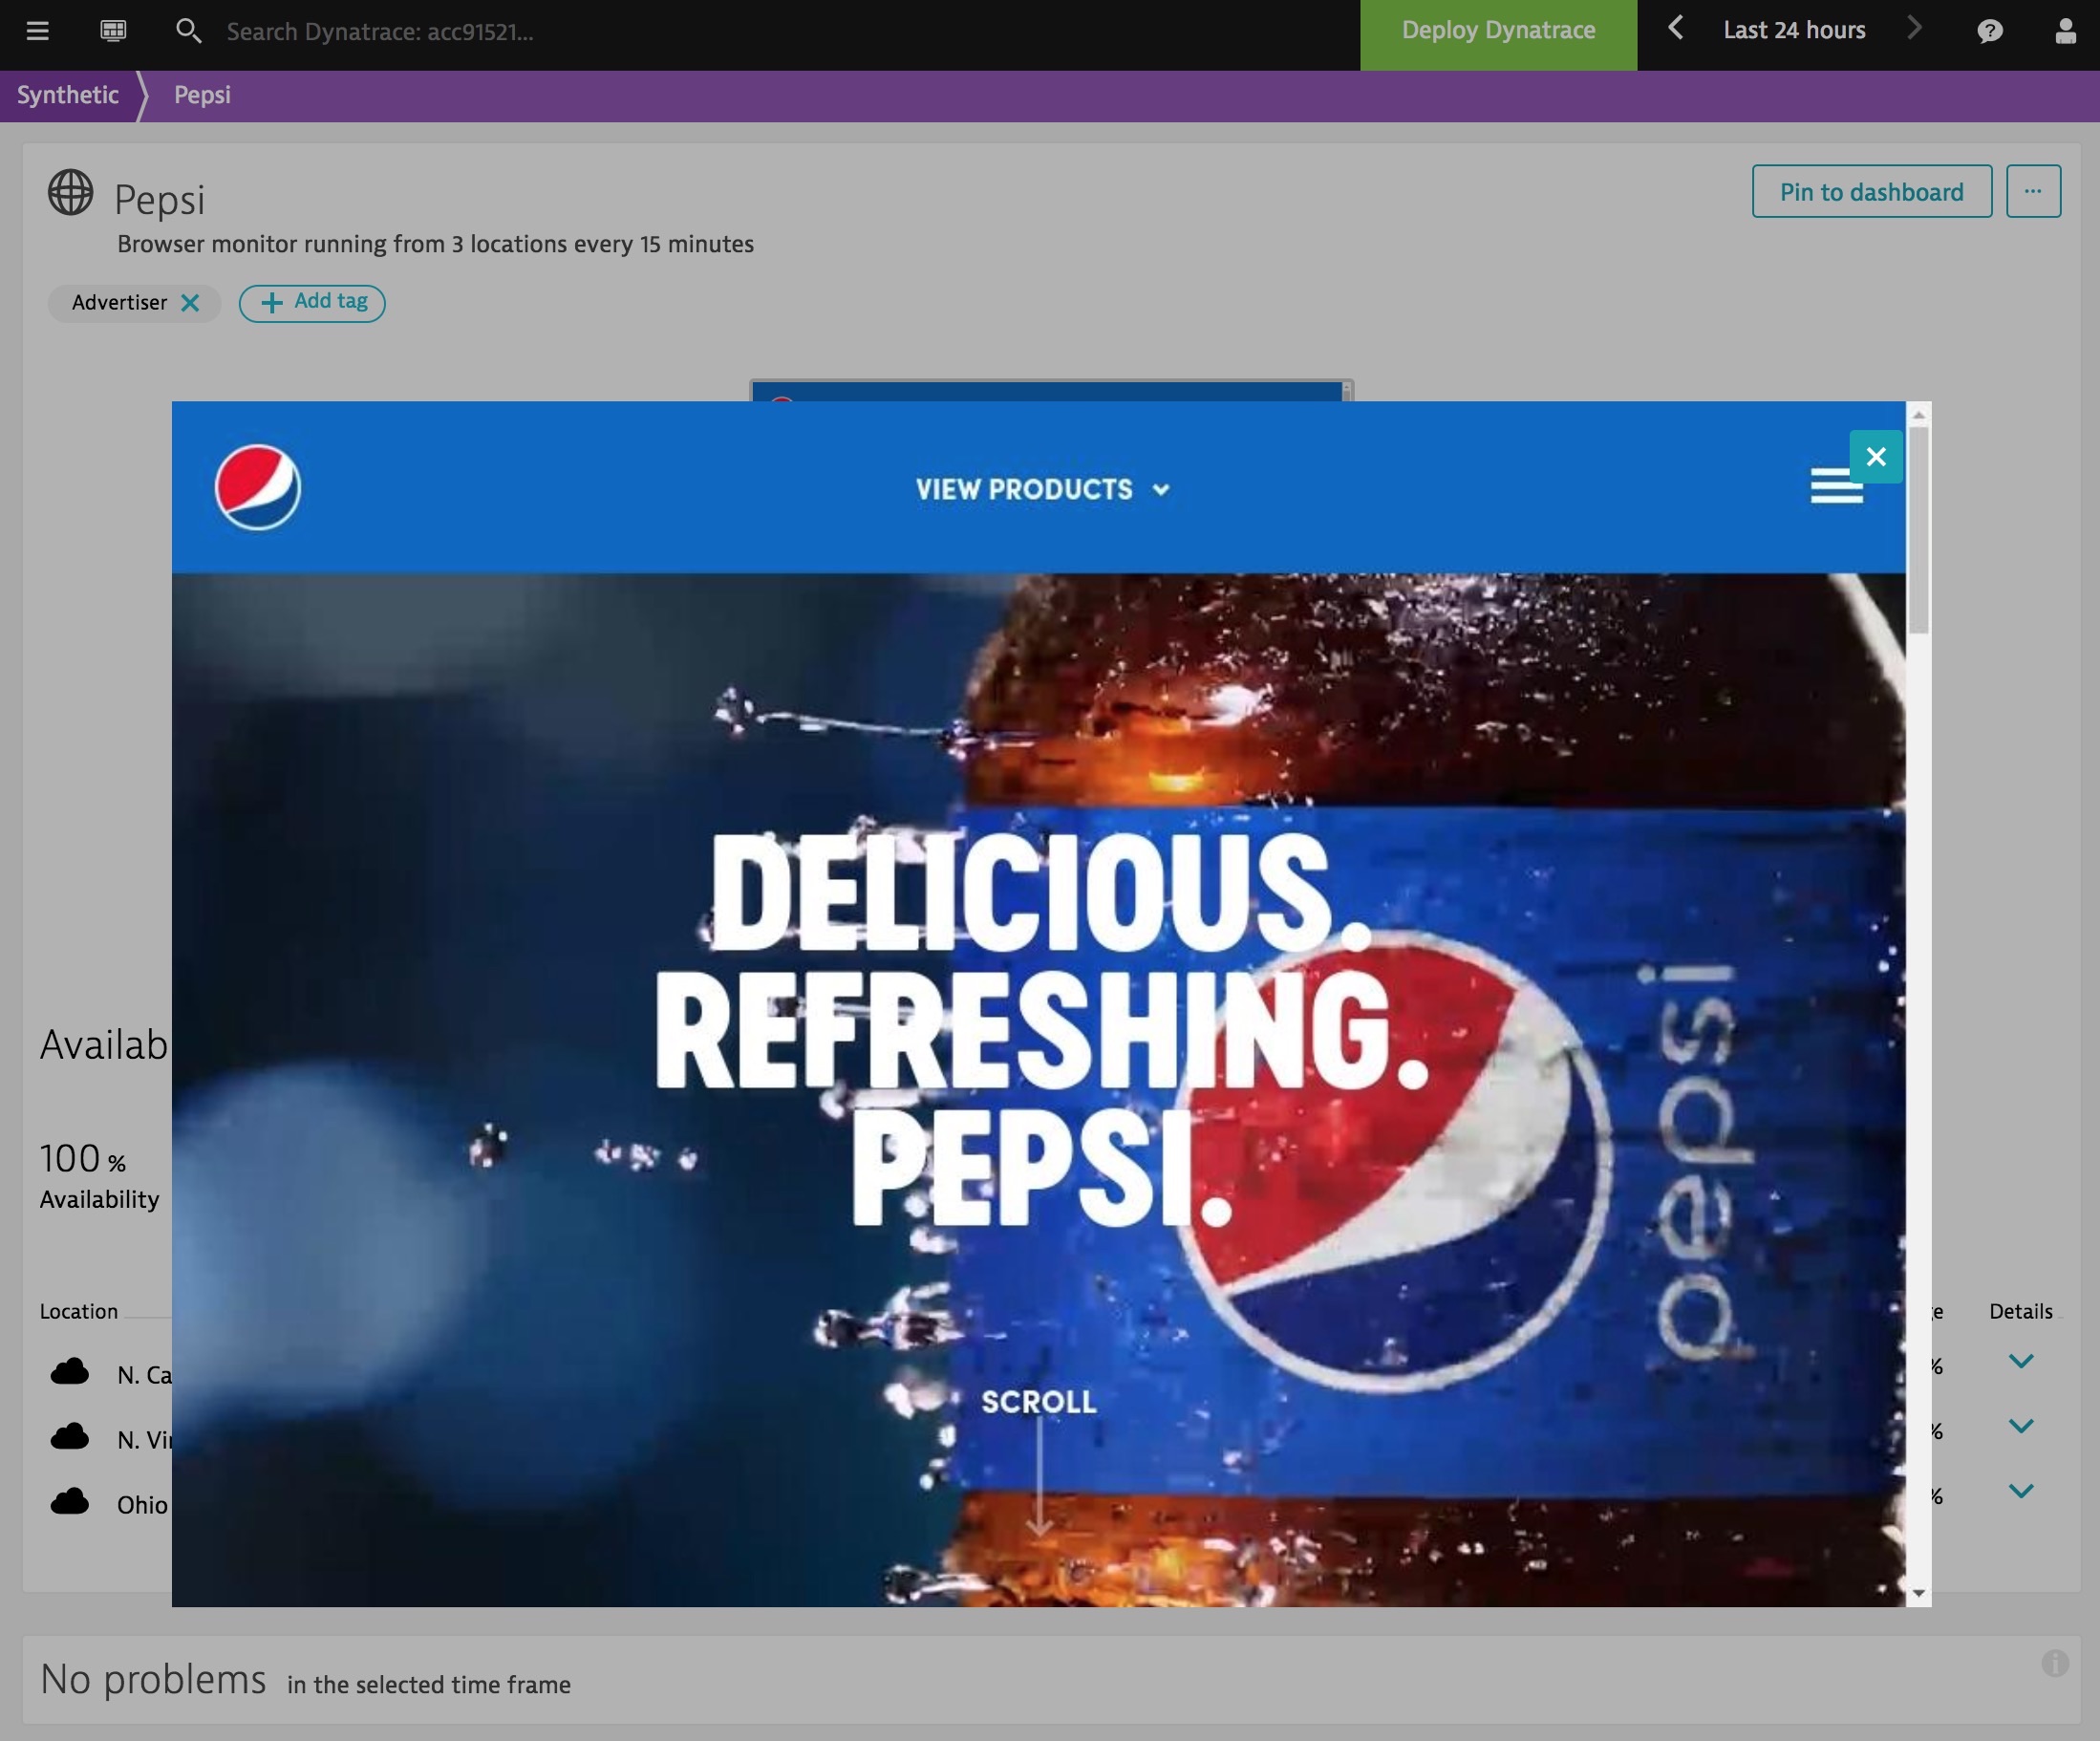
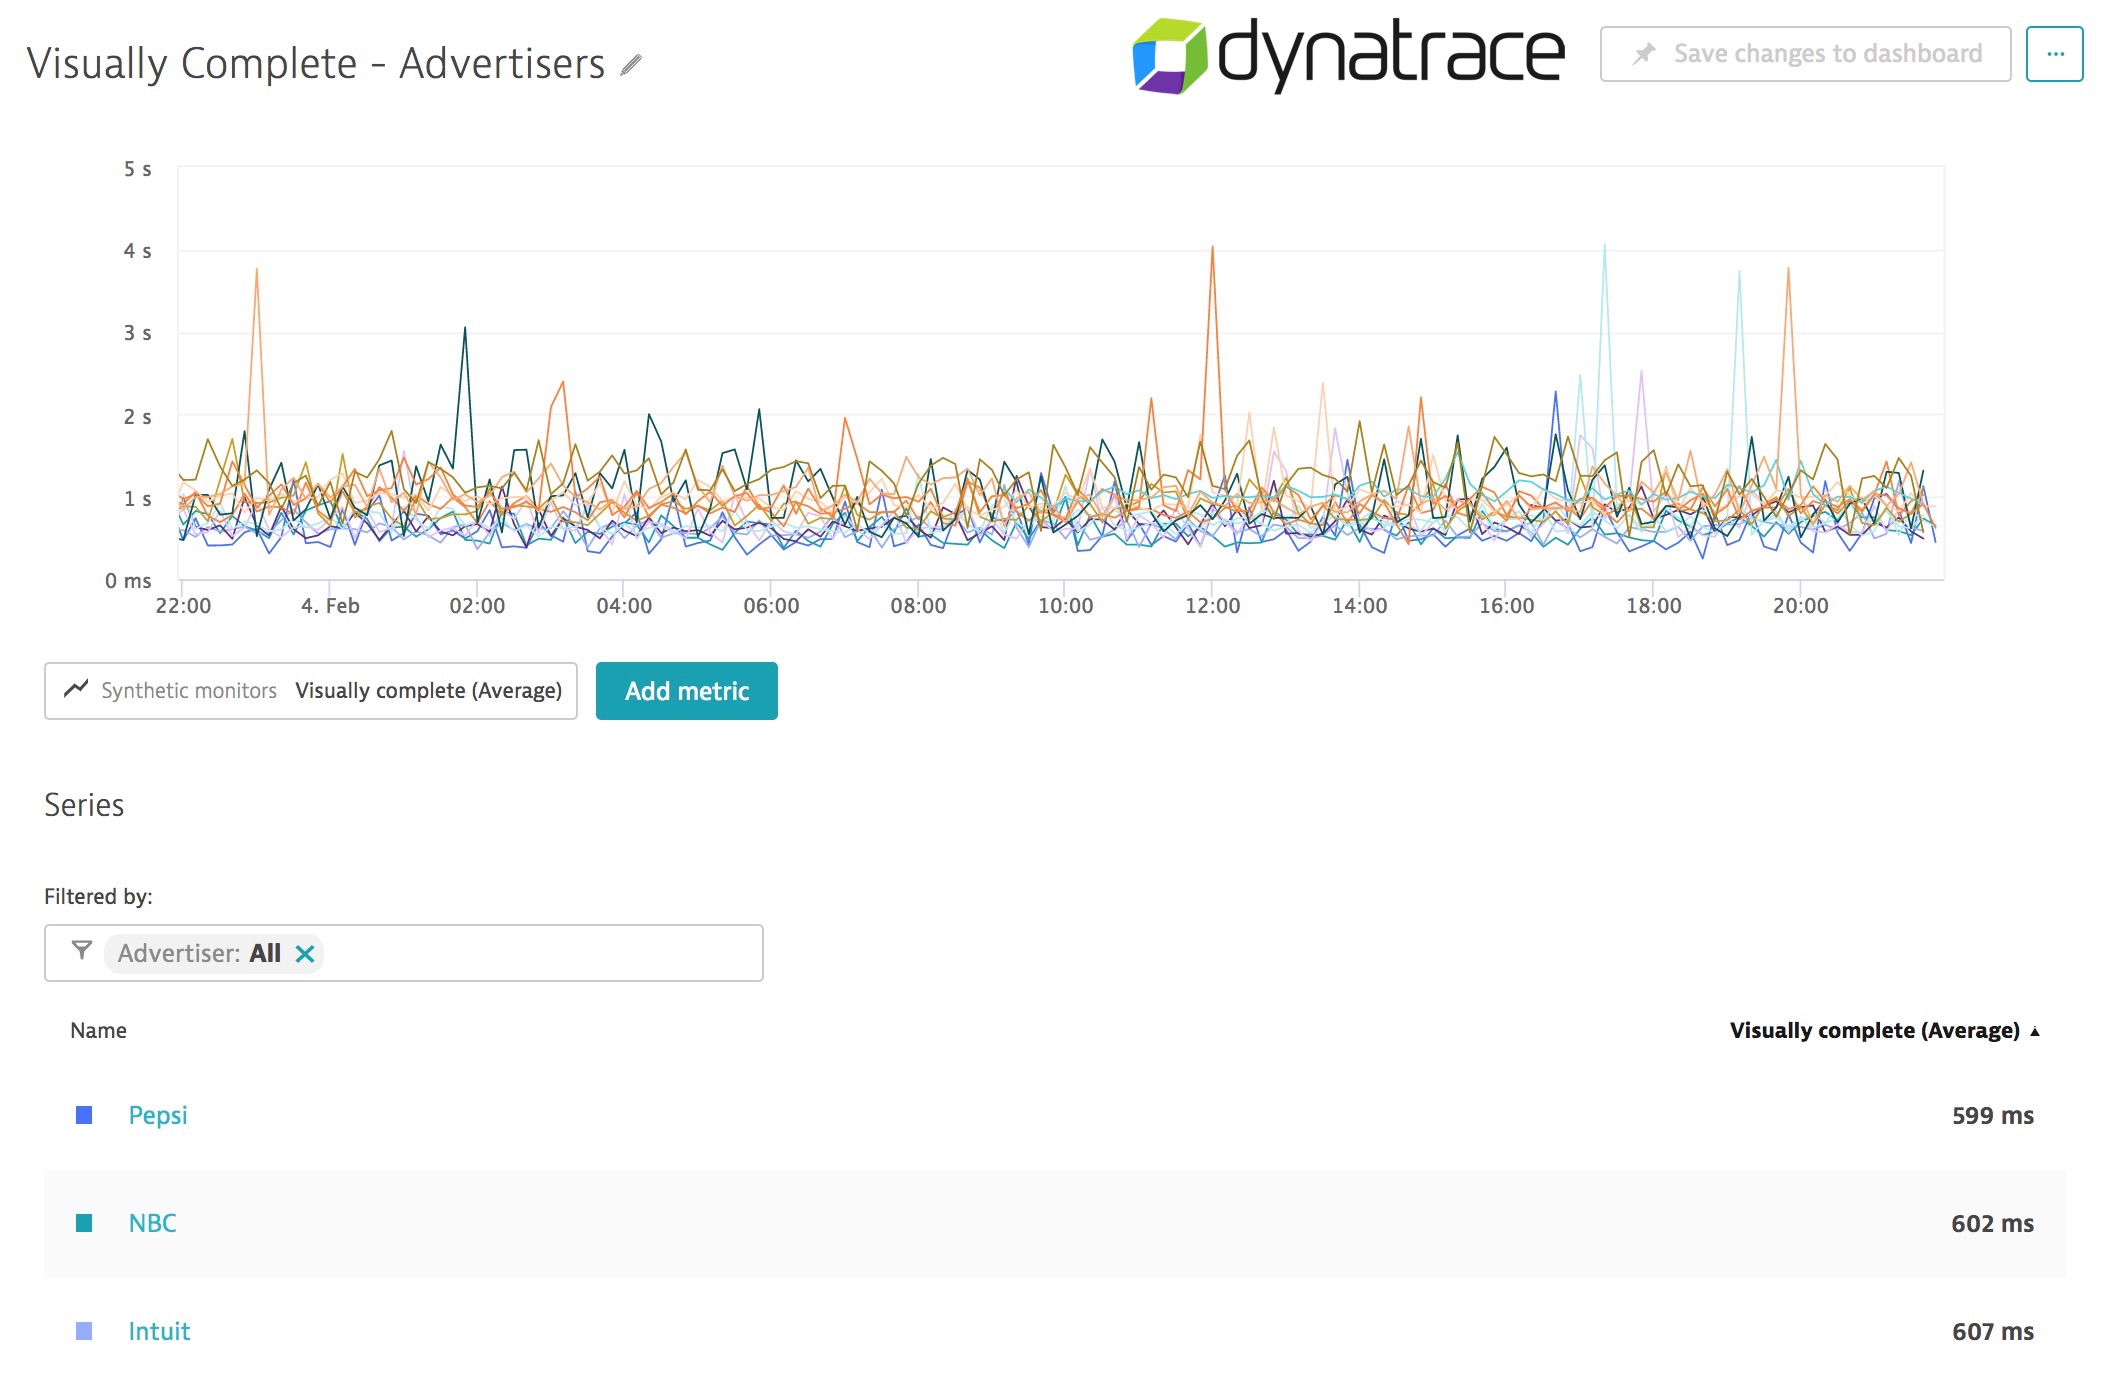
The winner of 2018 Dynatrace’s Performance Bowl is… Pepsi! With A 599 MS visually complete time they have provided the fastest response time for any advertiser during the 2018 Super Bowl! Congratulations to the Pepsi IT team.
As we get closer to the end of of quarter the top three performers are Pepsi, NBC and Intuit.
Fourth Quarter, Feb 4th 9:30pm
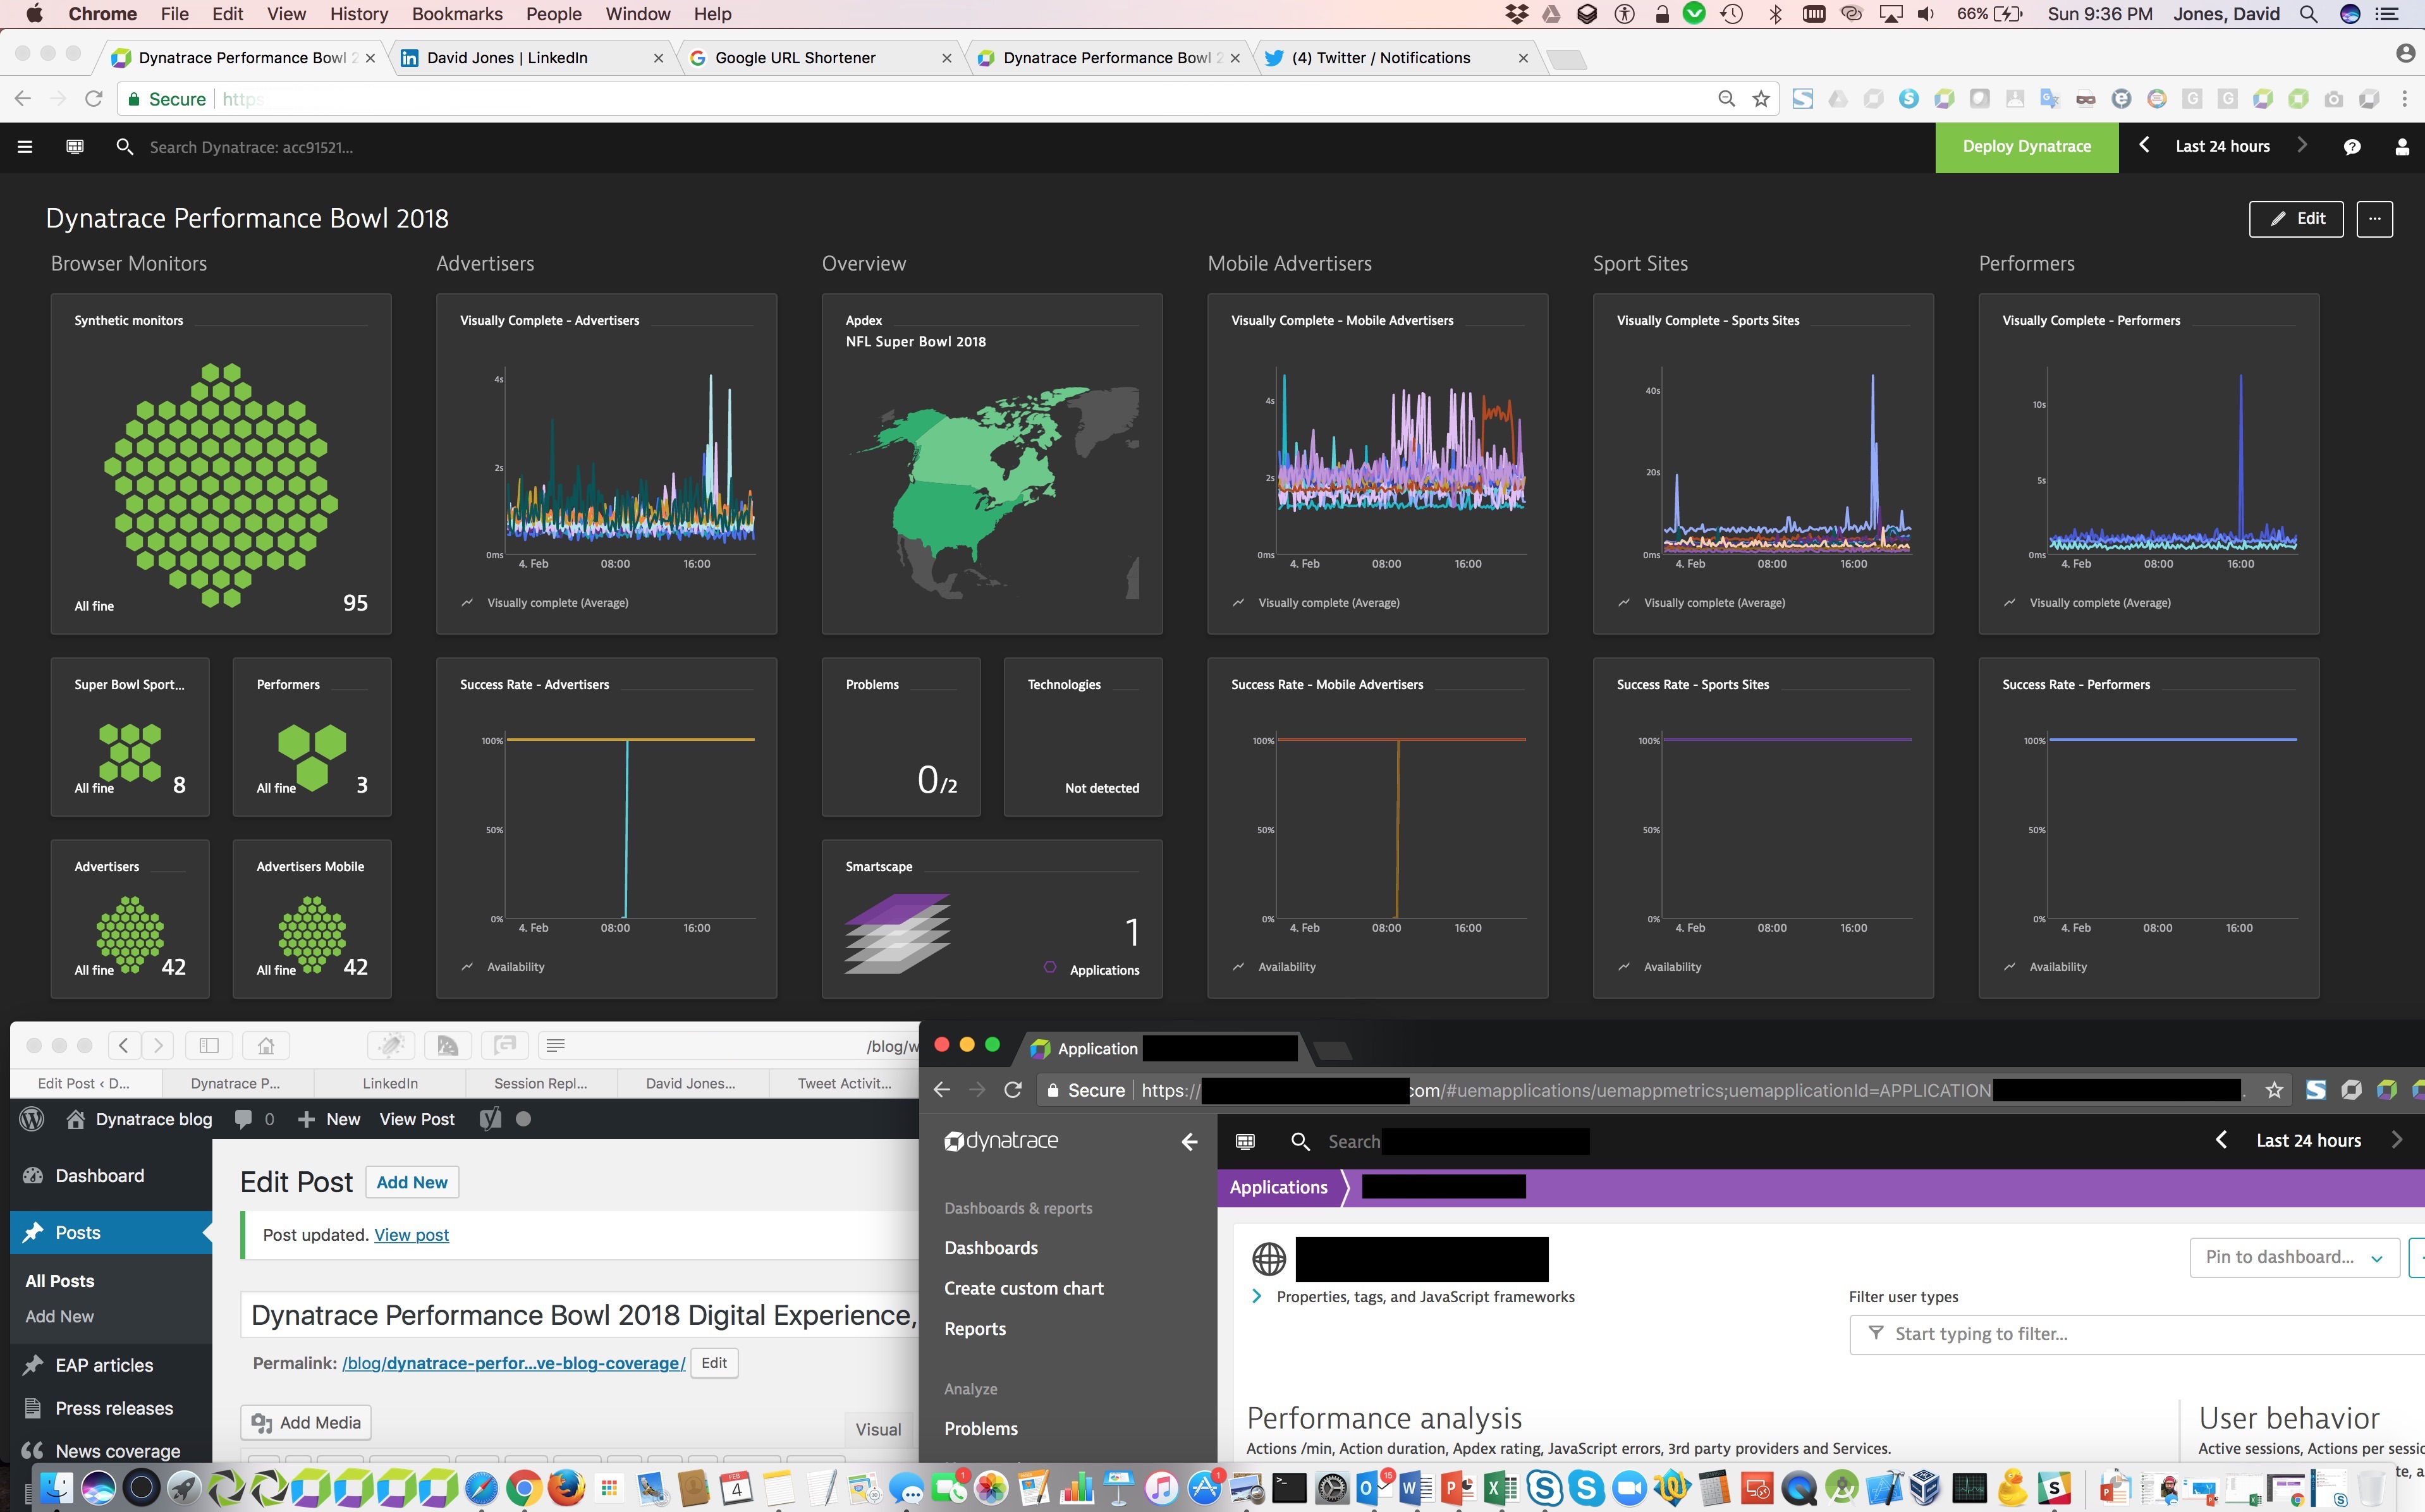
Patriots are bringing it on mid way through the 4th quarter. Here is a view of our NoOPs data center we are using to manage tonights blog coverage
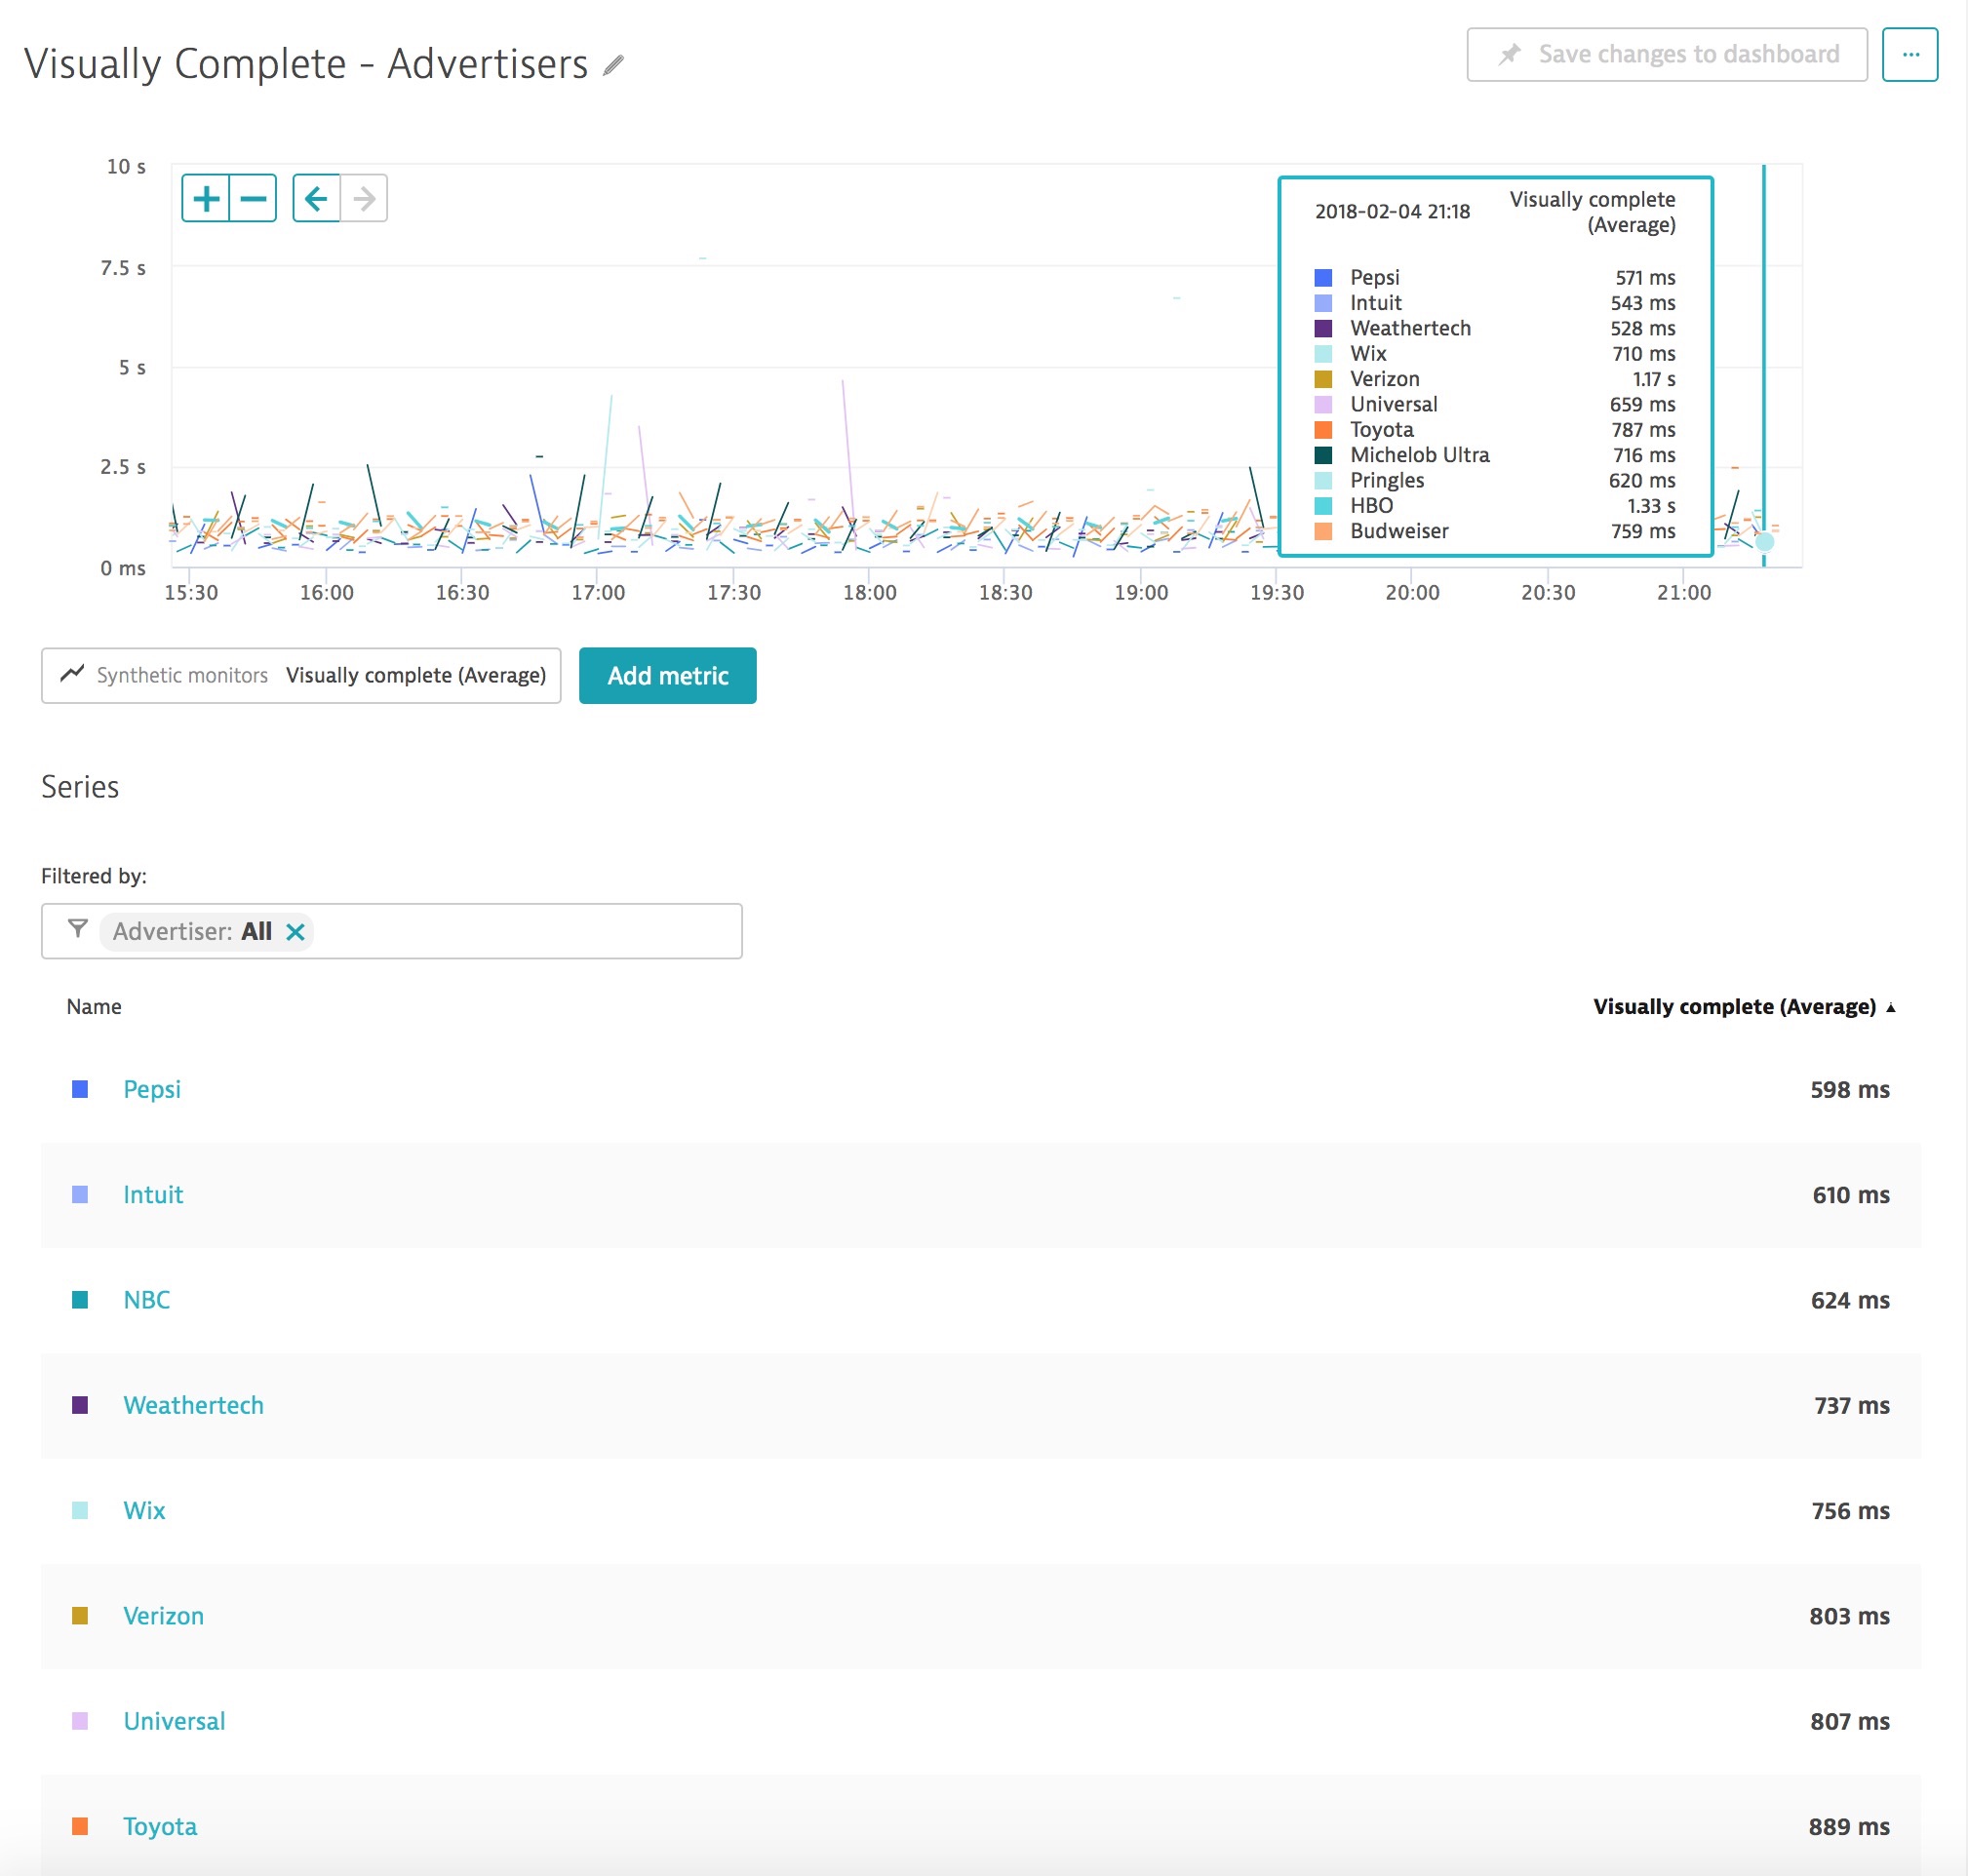
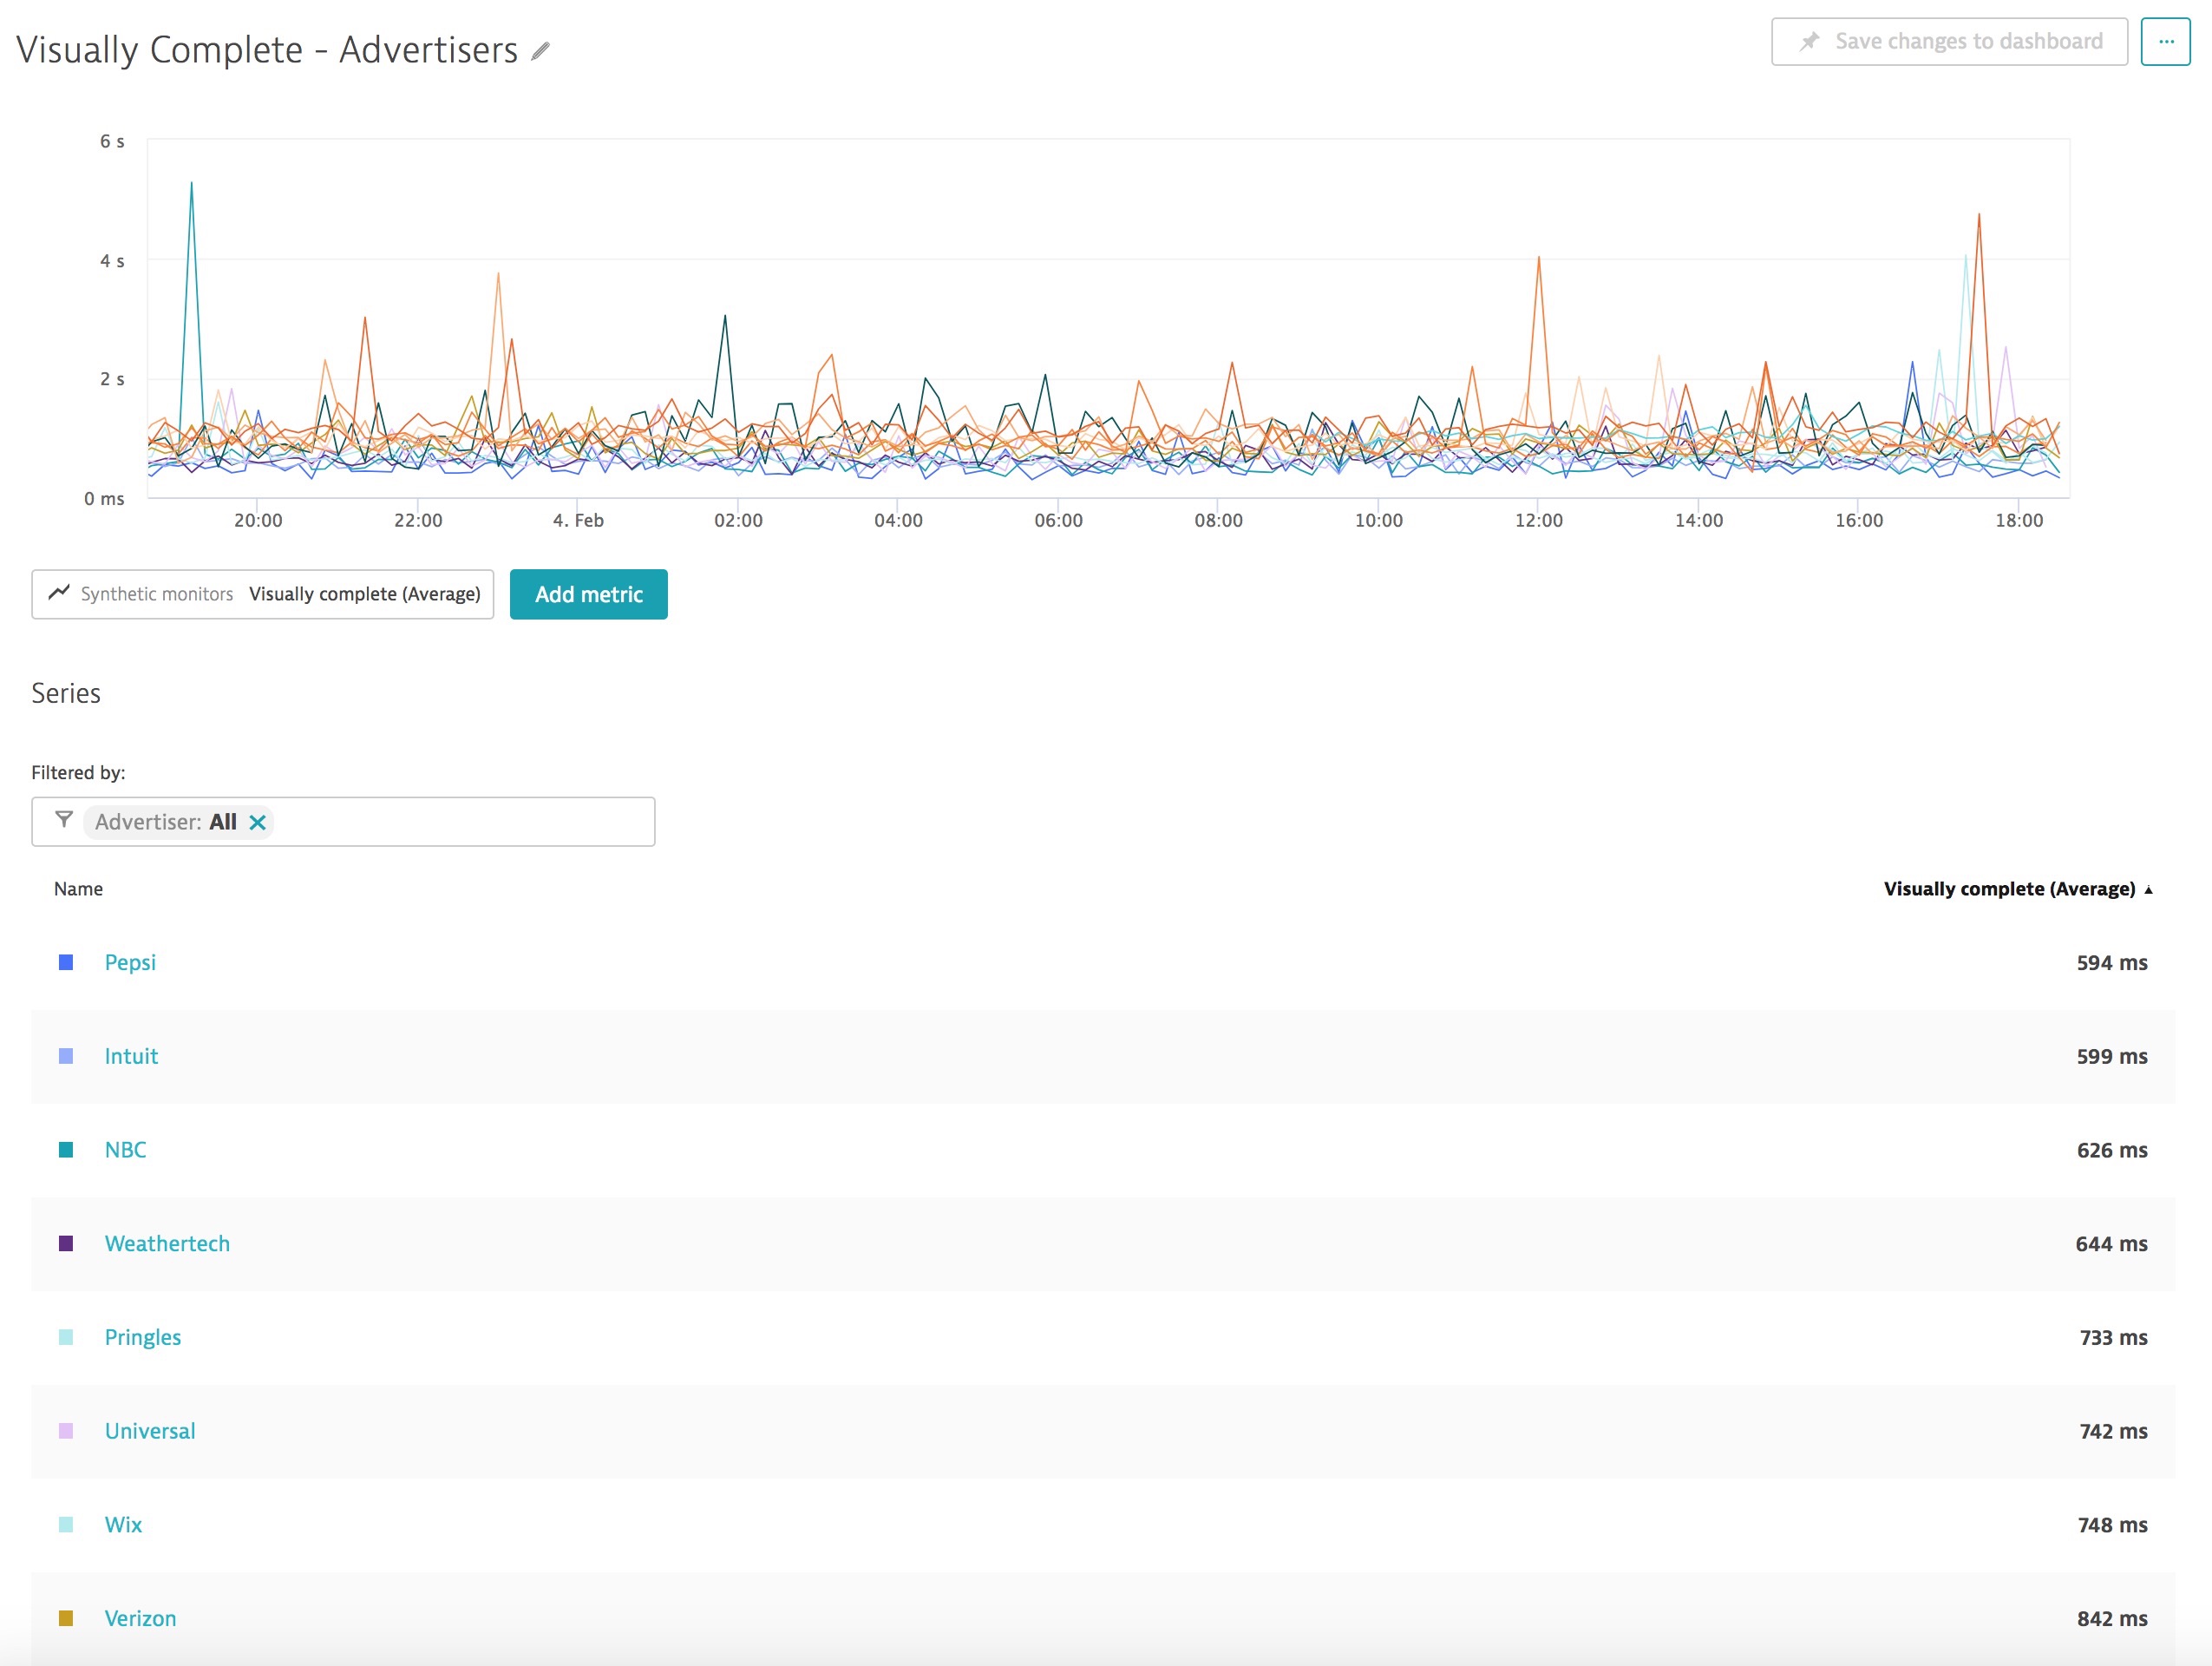
OK, start of the fourth quarter… most of the ads have aired now, a few more to go. As the game winds down here is a look at the fastest (using visually complete) advertisers.
Third Quarter, Feb 4th 9:00pm
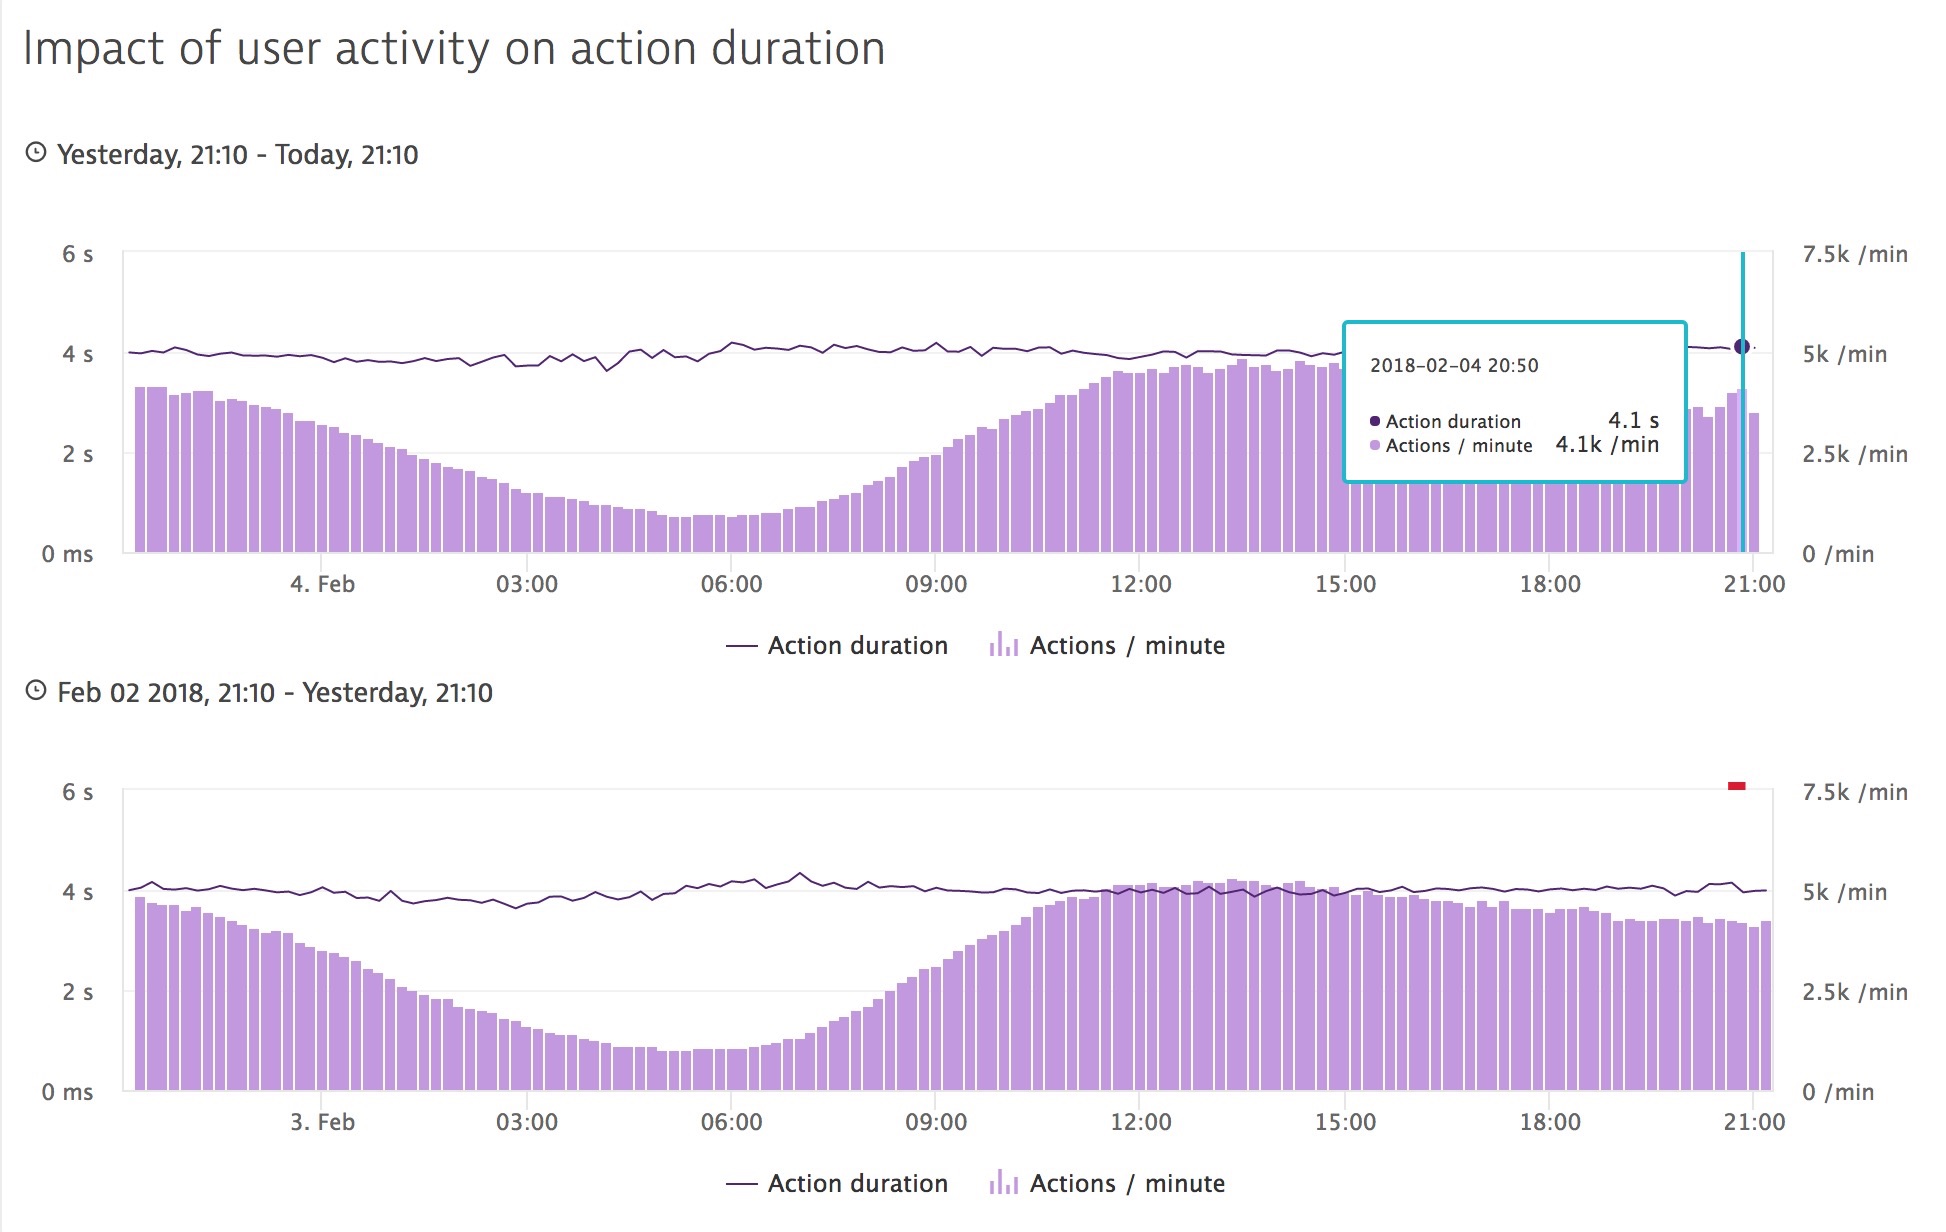
It doesn’t look like a huge hit, but that little spike after the ad airs actually represent a big success for a major brand advertising during the super bowl. When compared to a similar time frame you can see a definite uptick in views and user activity. This real user data (Dynatrace RUM) from a Super Bowl advertiser represents exactly what tonight is all about.
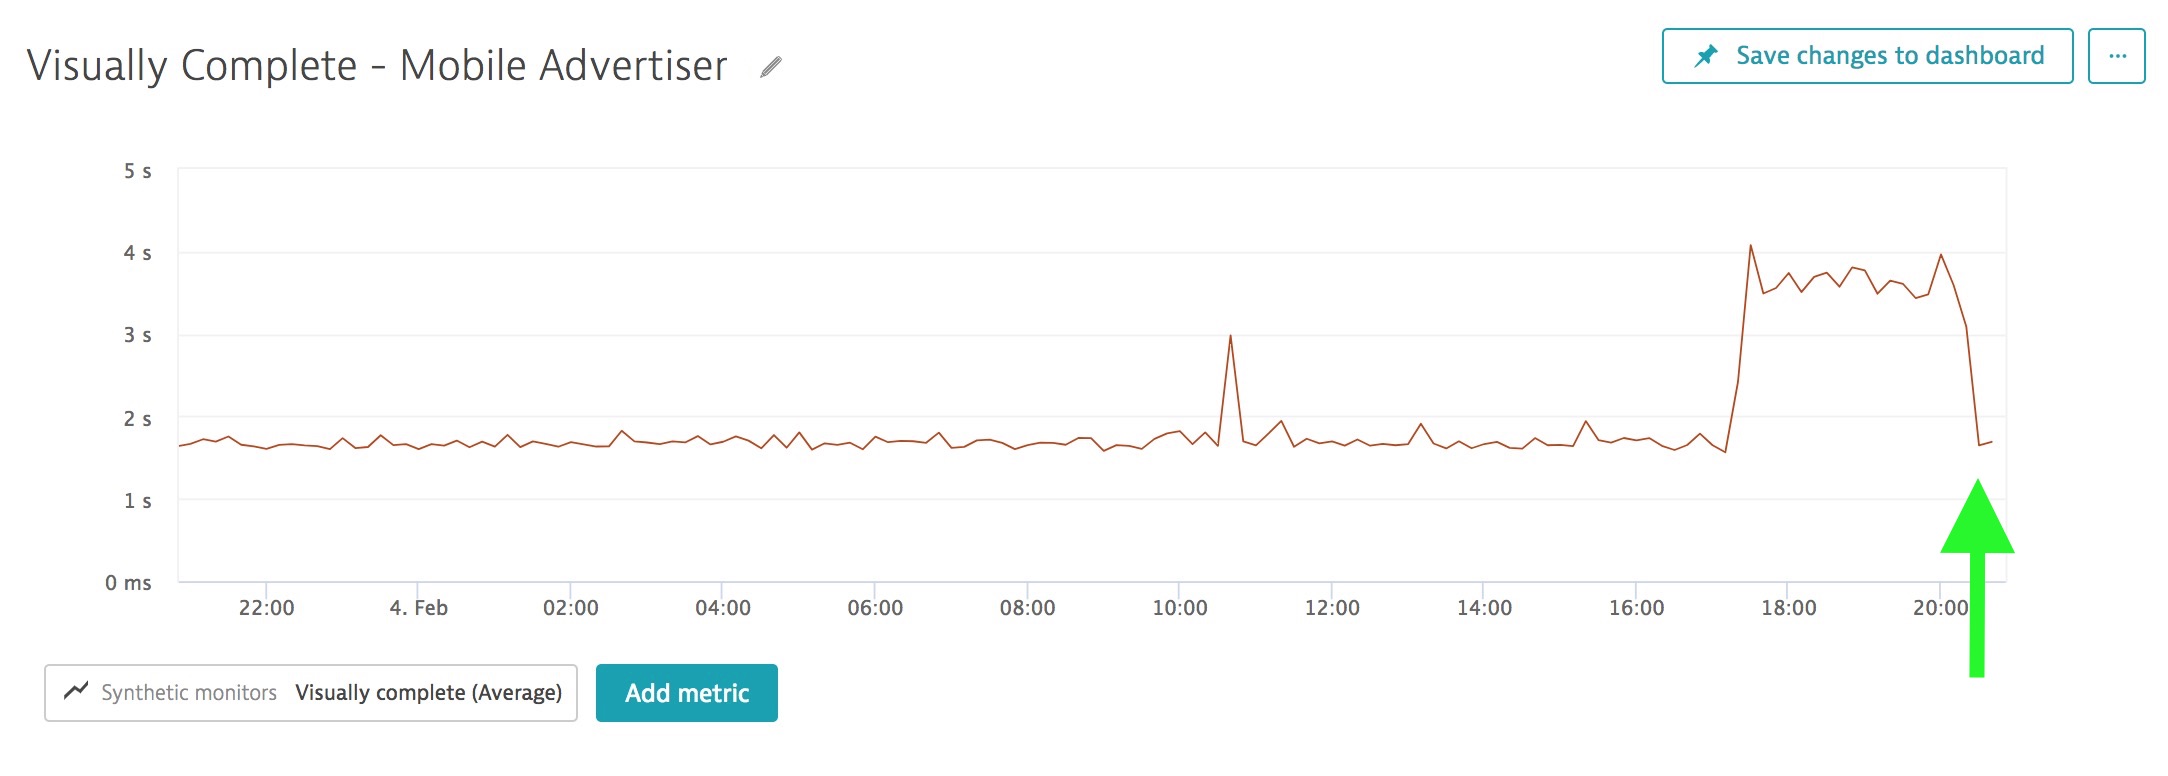
Earlier we were showing you a result from an advertiser who was having an issue with their mobile web performance. Here is what it looks like when they fix the issue. Real time actionable data is what Super Bowl advertisers need.
Half Time, Feb 4th 8:15pm
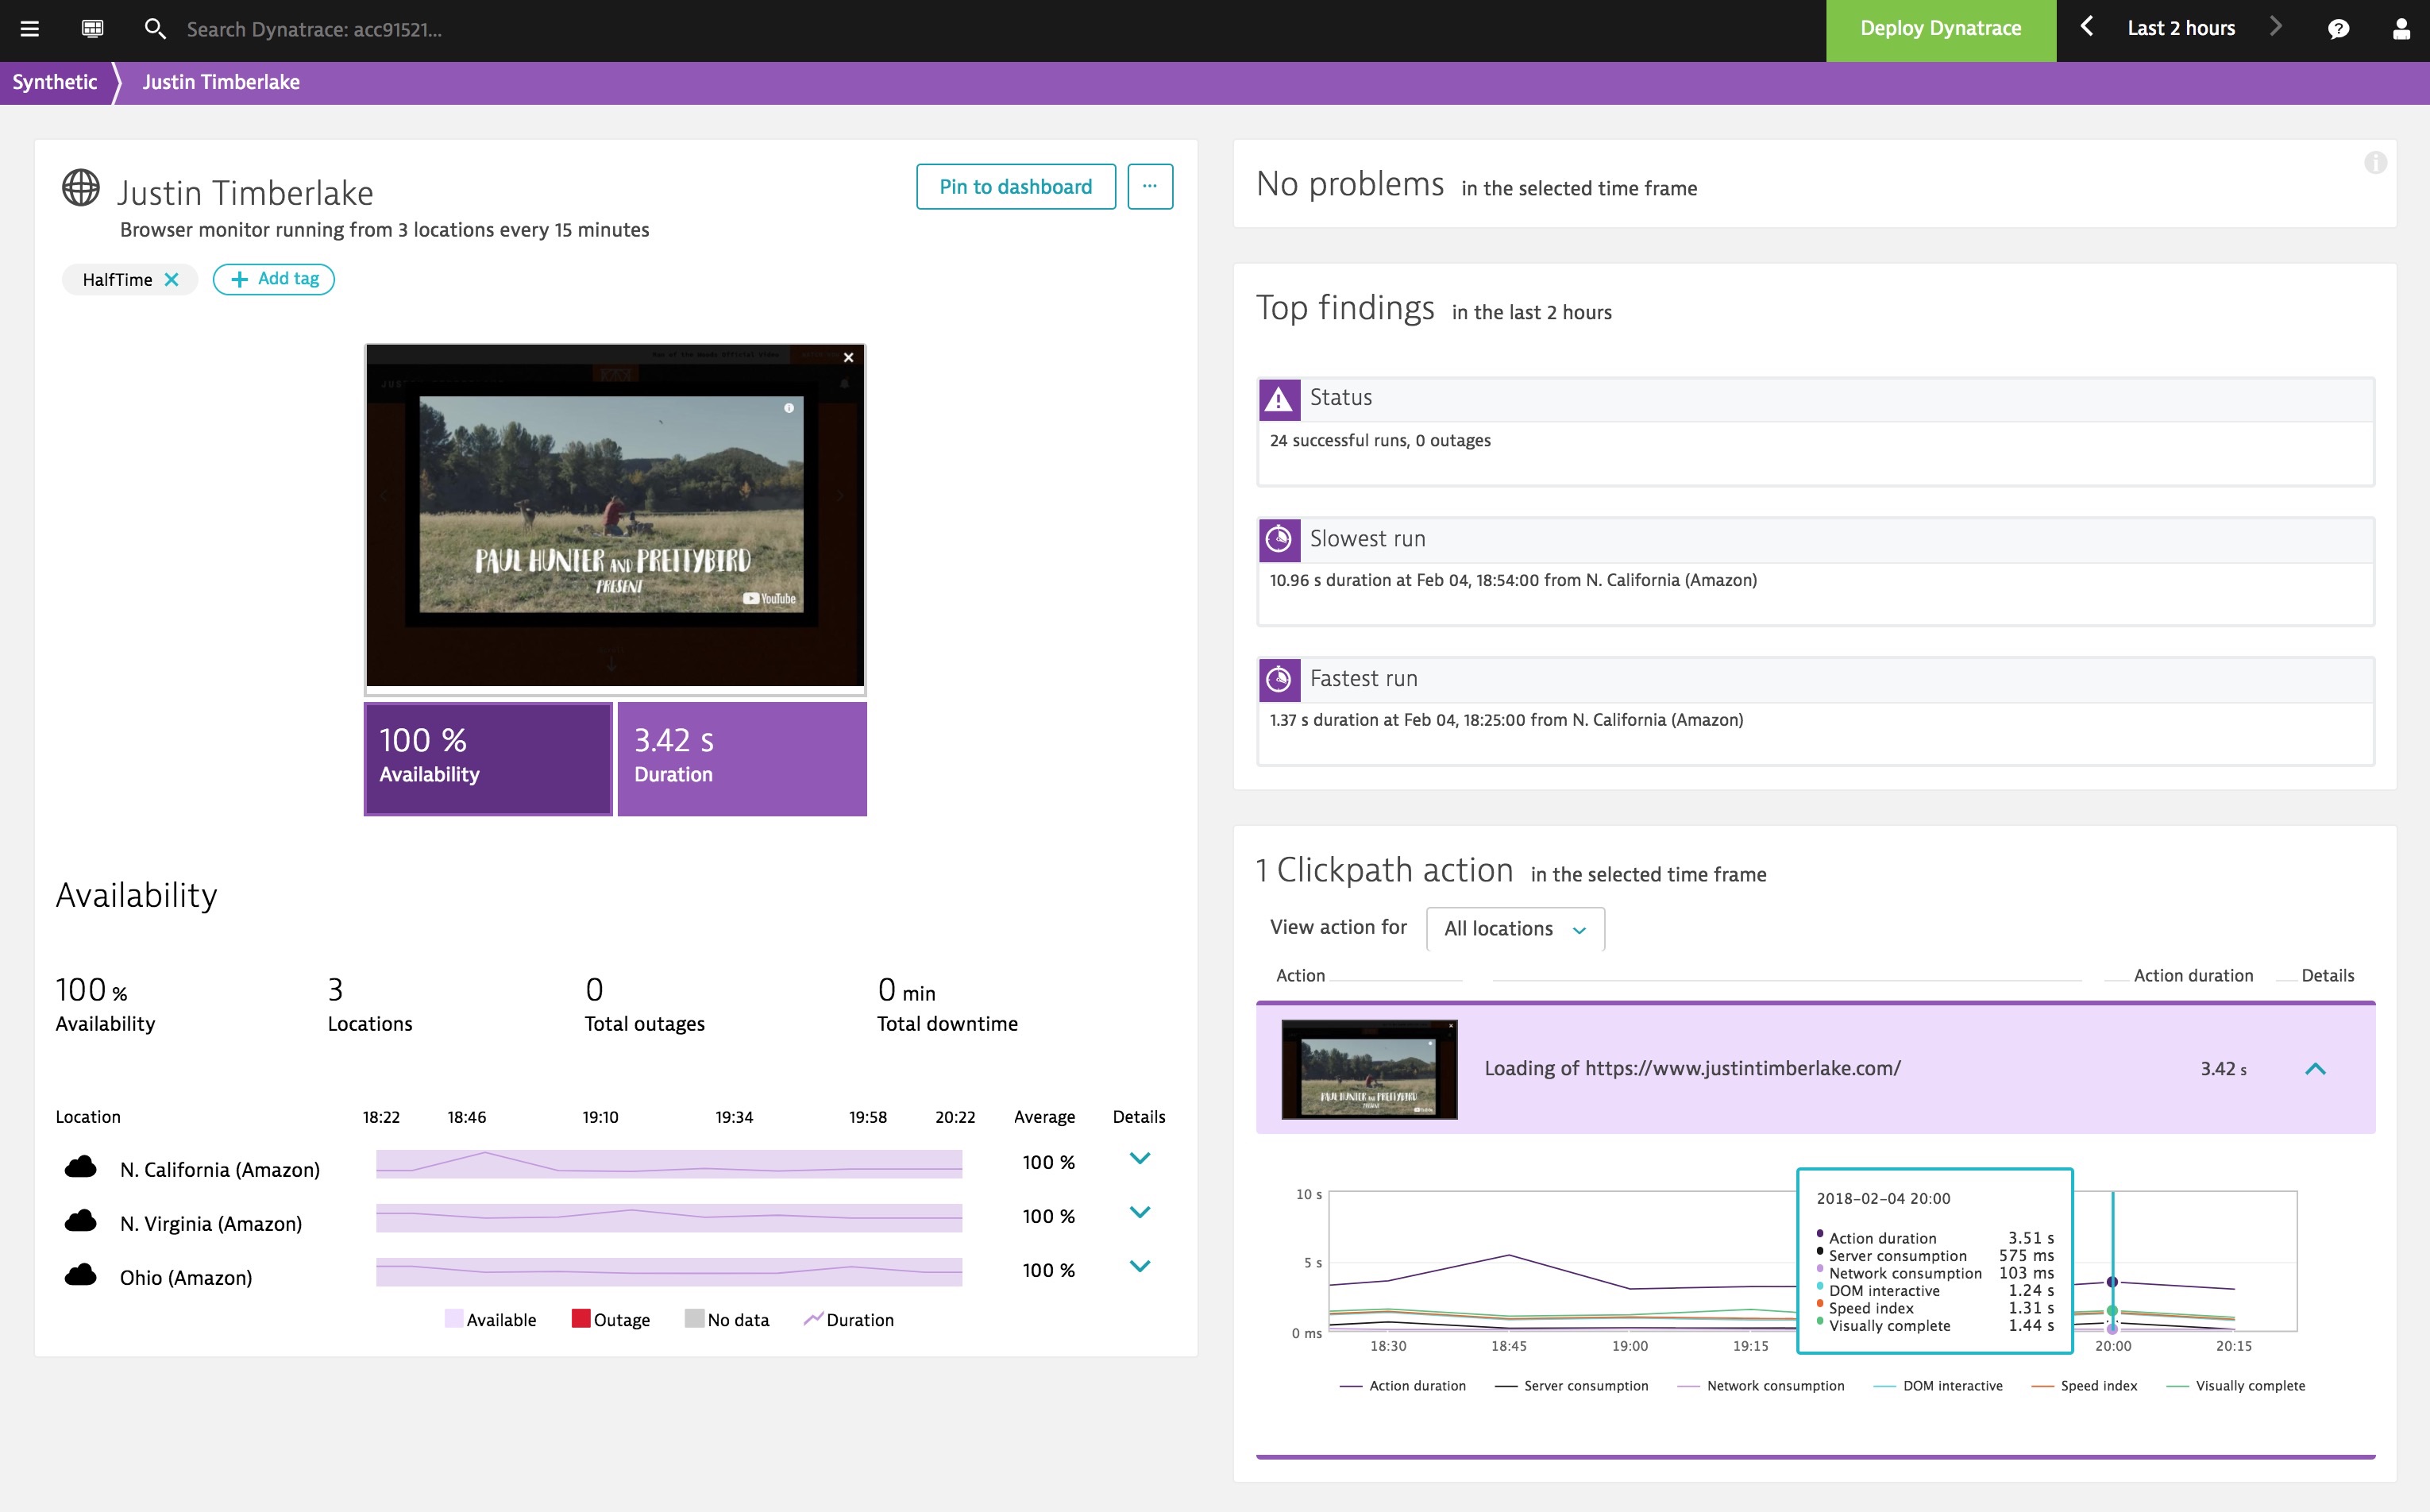
And here comes Justin Timberlake. Just releasing a new album and hitting the Super Bowl… that could put some pressure on some digital properties. His is performing just fine.
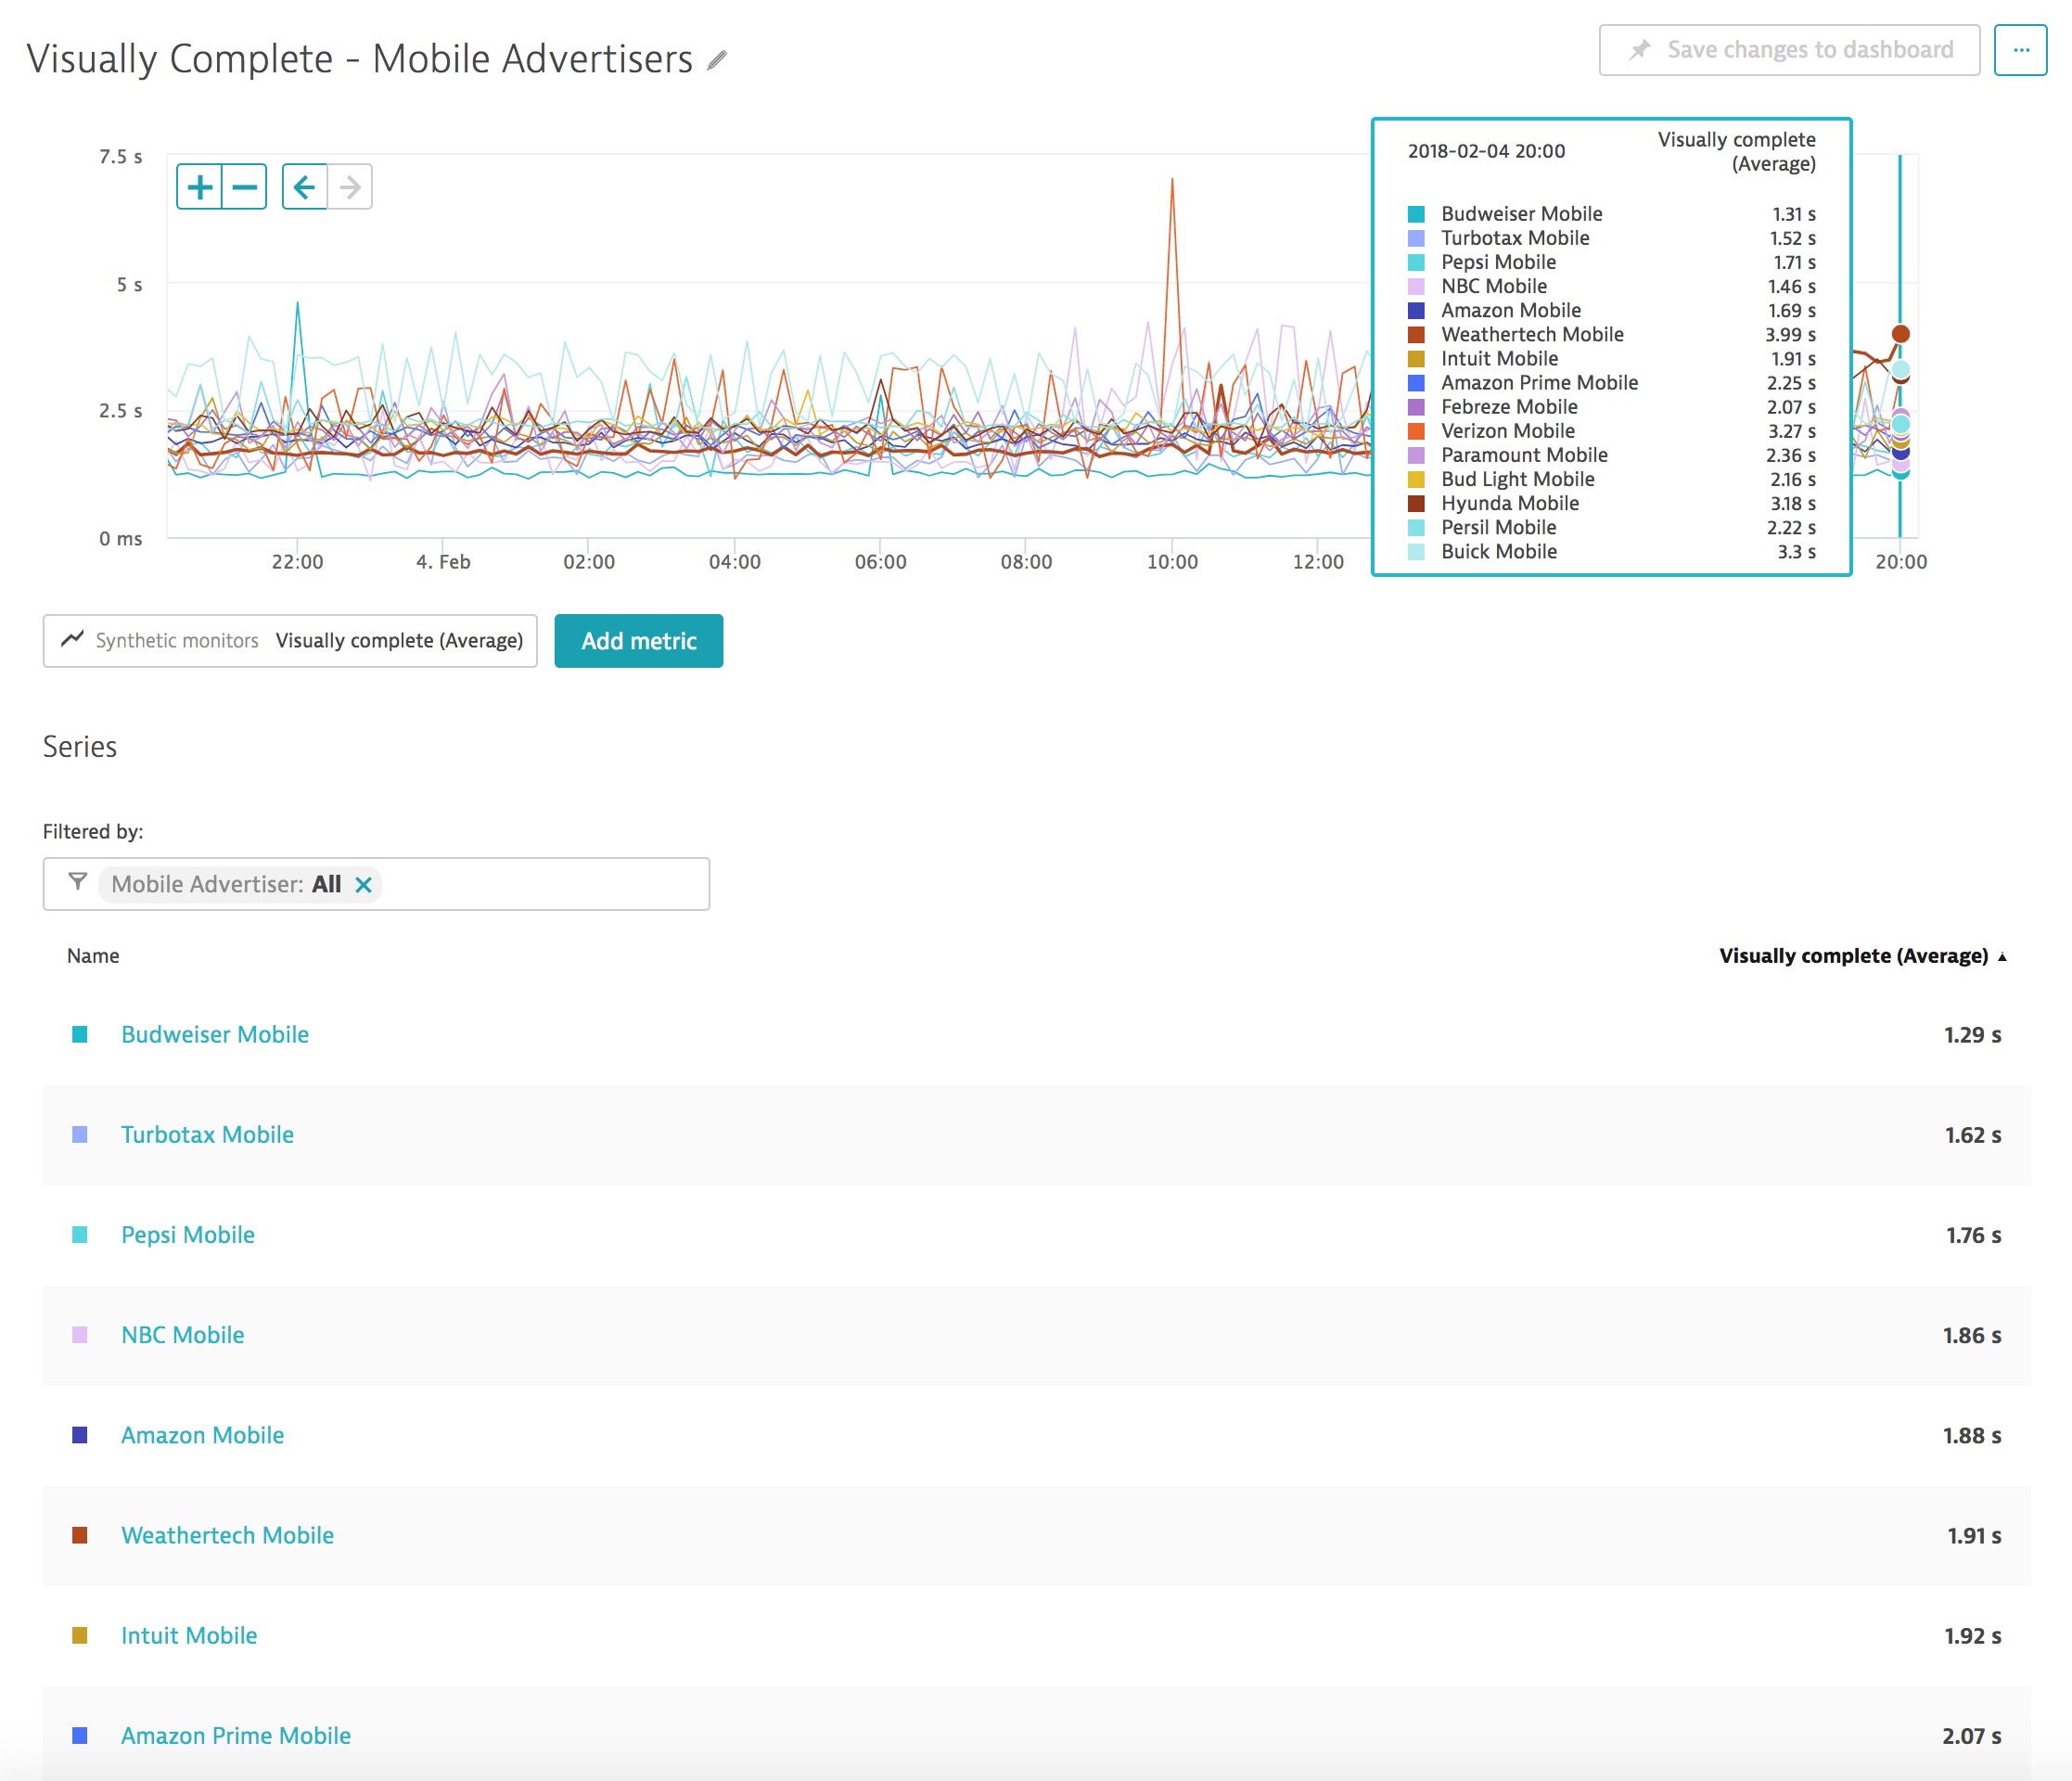
It’s half time, and they are getting setup for Justin. In the meantime here are some Mobile web results for the advertisers.
Second Quarter, Feb 4th 7:15pm
You have to watch what is happening on the mobile front, remember the RUM dat from the advertiser we talked about earlier had over 50% of their traffic comping from mobile devices.
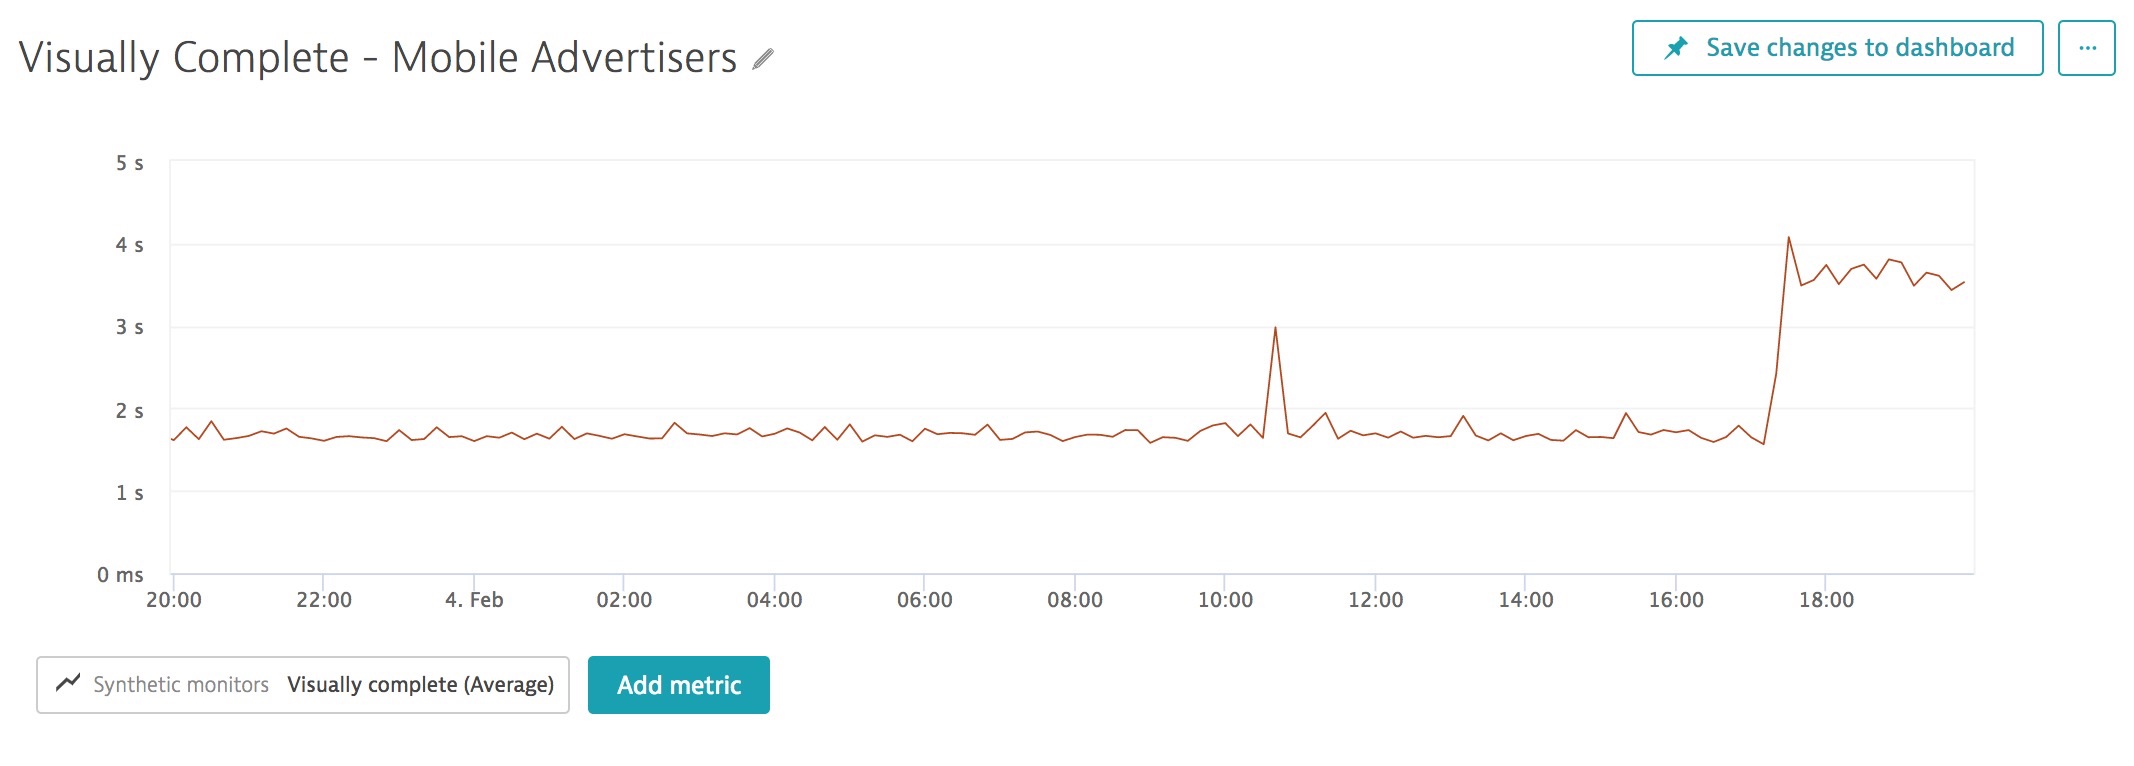
Here is an example of what can happen after the ad airs… leading up to the game sub one second visually complete. After the ad airs and traffic starts coming to the site 2.69 second visually complete time.

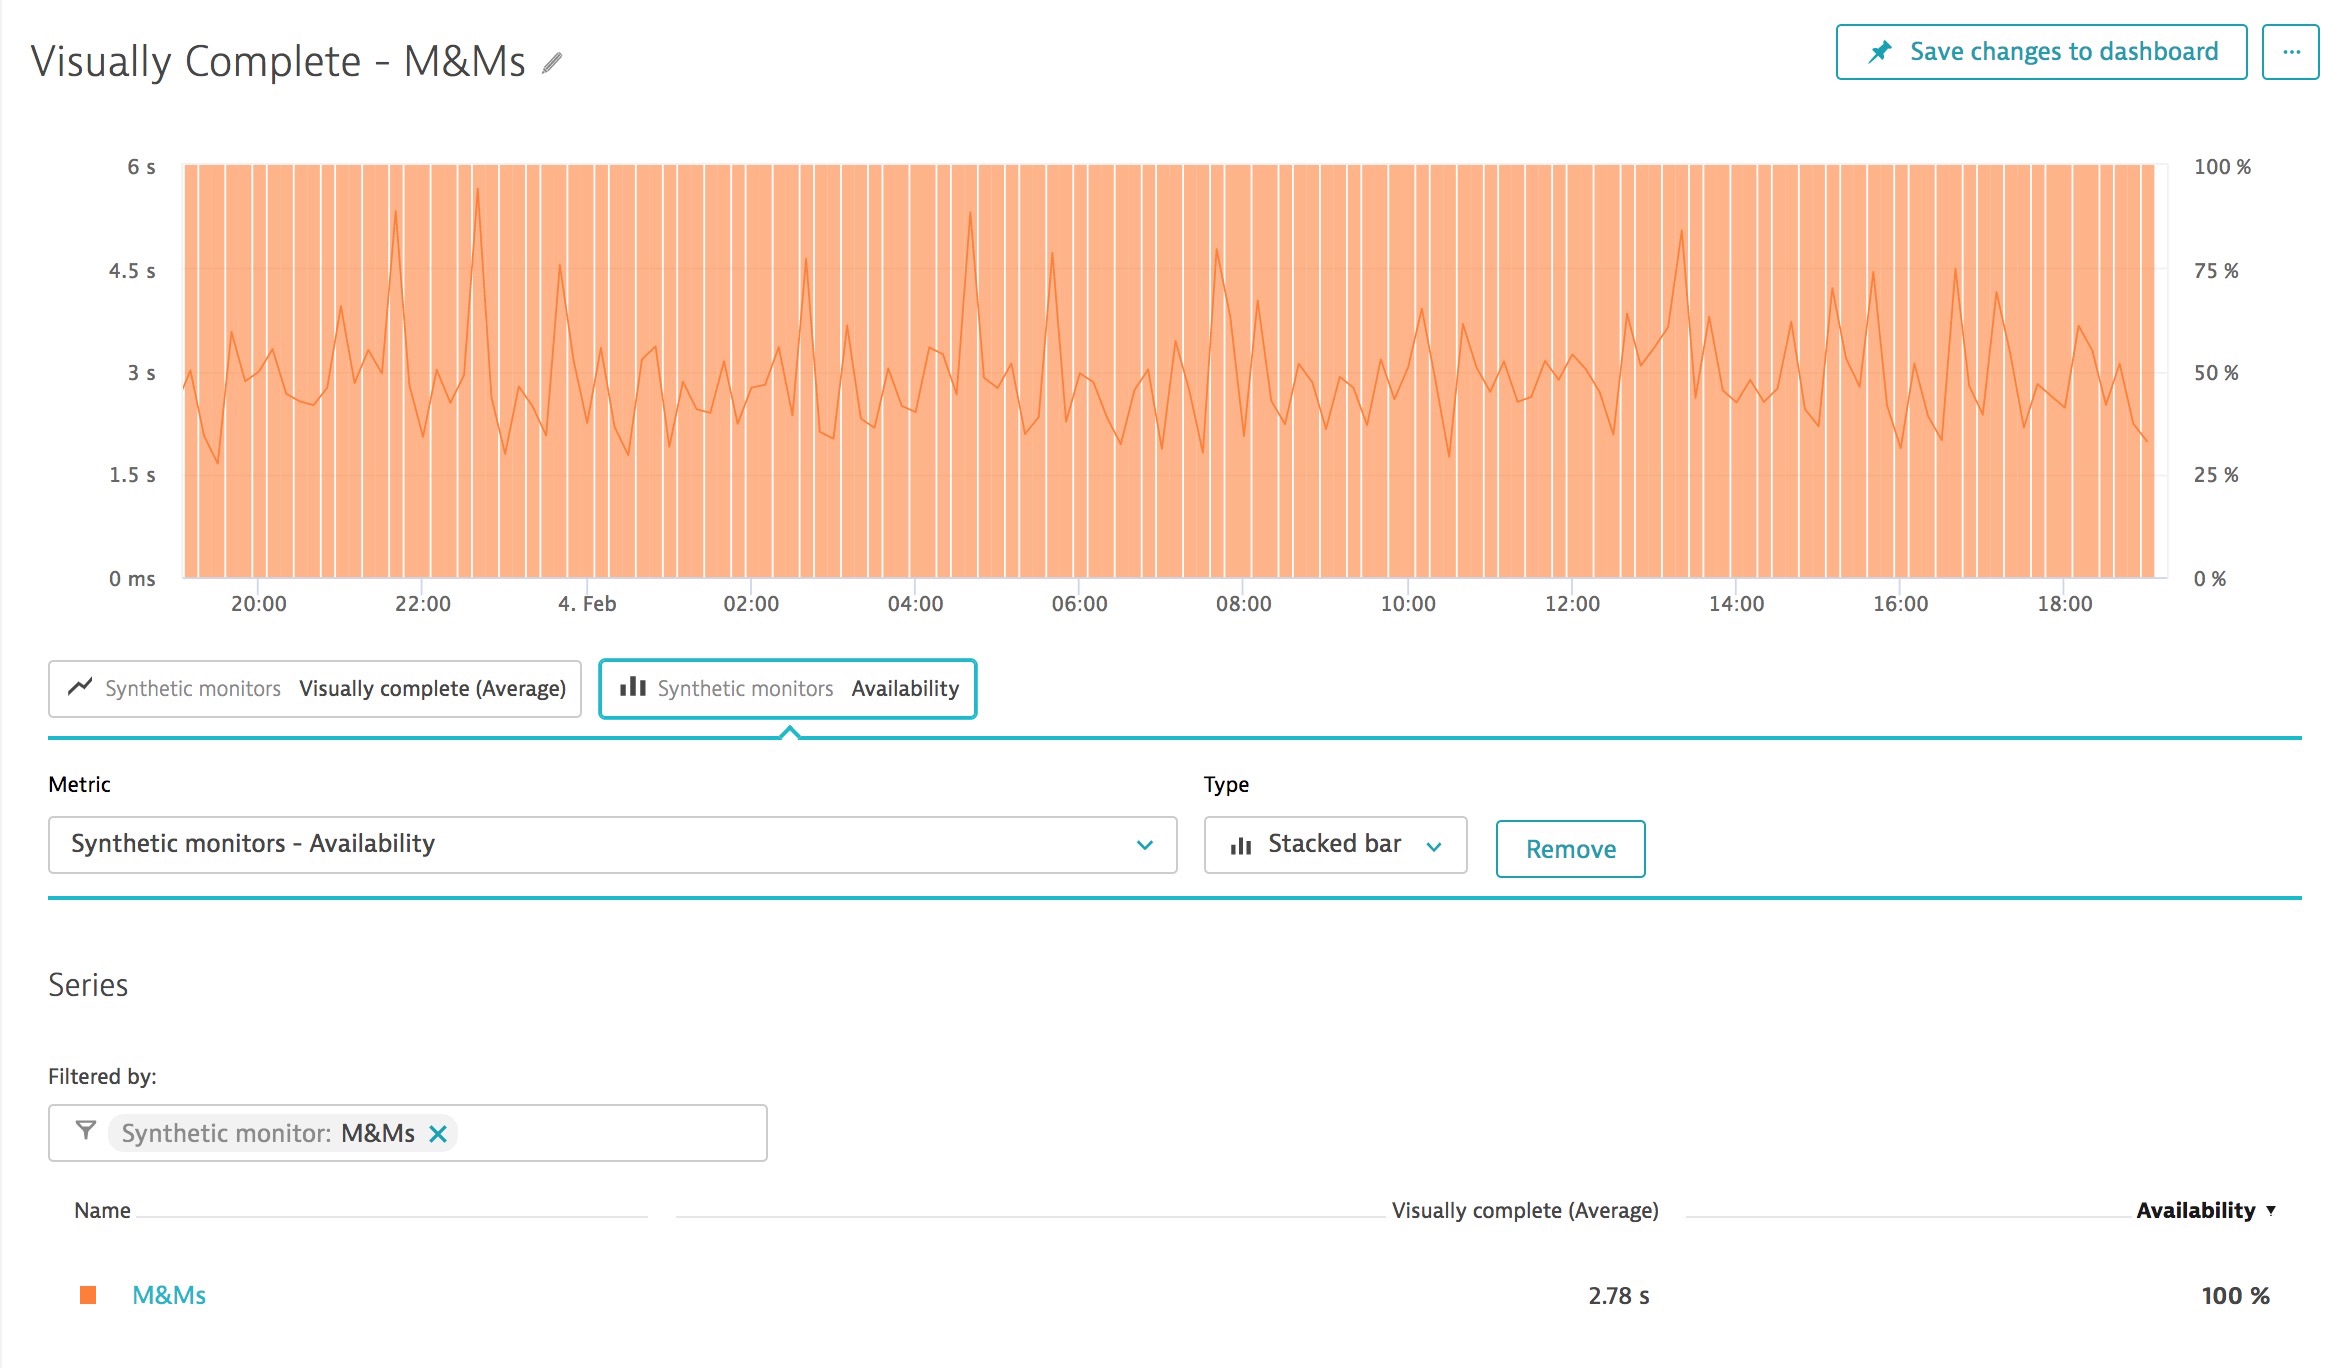
M&Ms ad aired and Danny Devito is trending on twitter. Site availability is rock solid.
Game Time!, Feb 4th 6:30pm
Still in the first and green lights across the board.
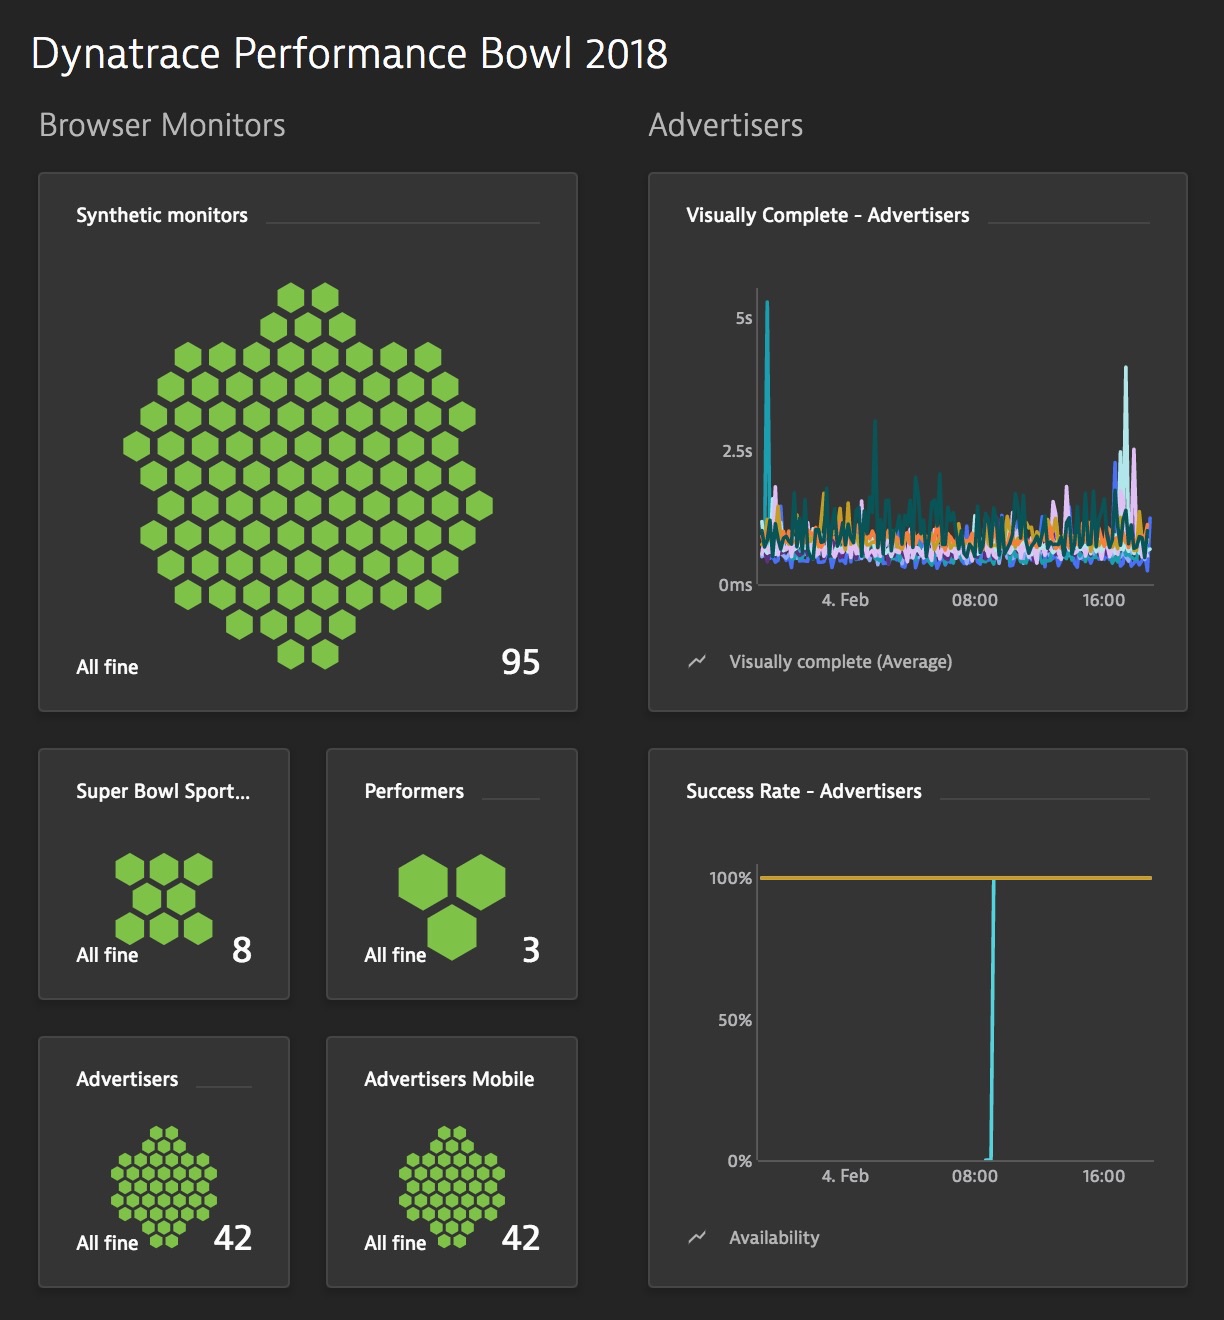
Here is a peak at some of the Visually Complete times as we get started in the first quarter.
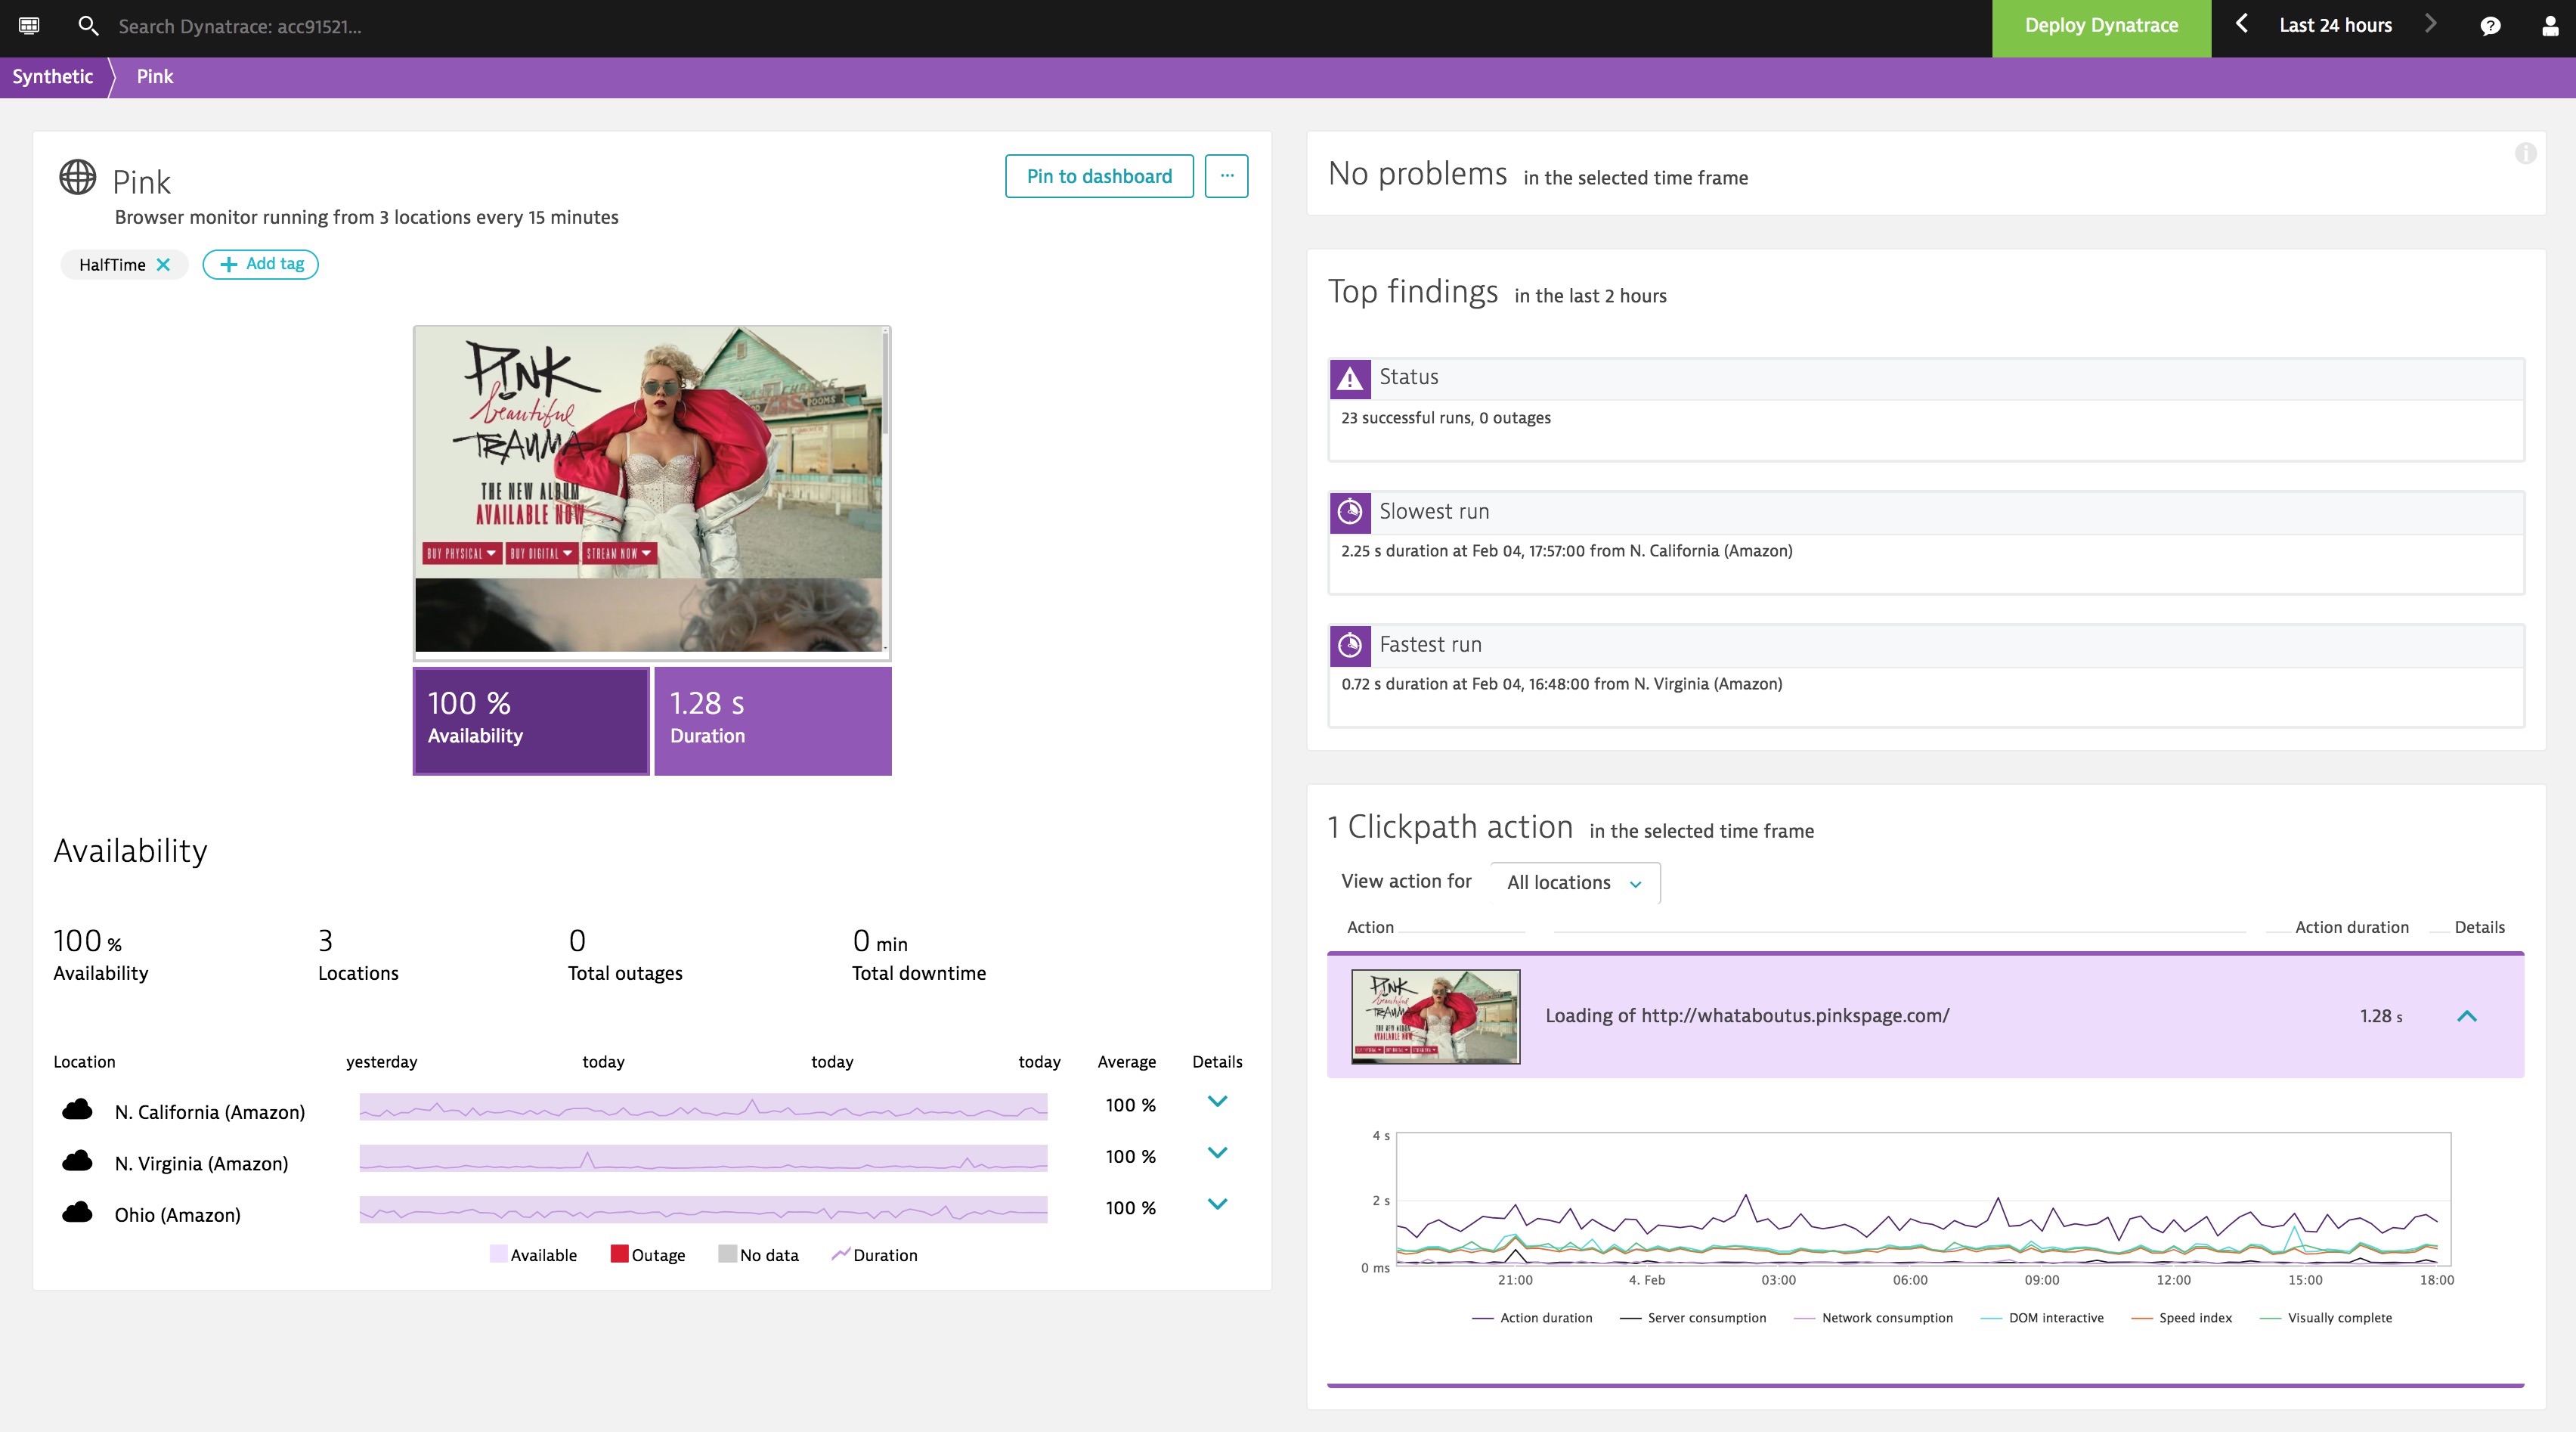
Pink might be suffering from the Flu but her site is not!
Quick Update on fast Advertisers, Feb 4th 6:00pm
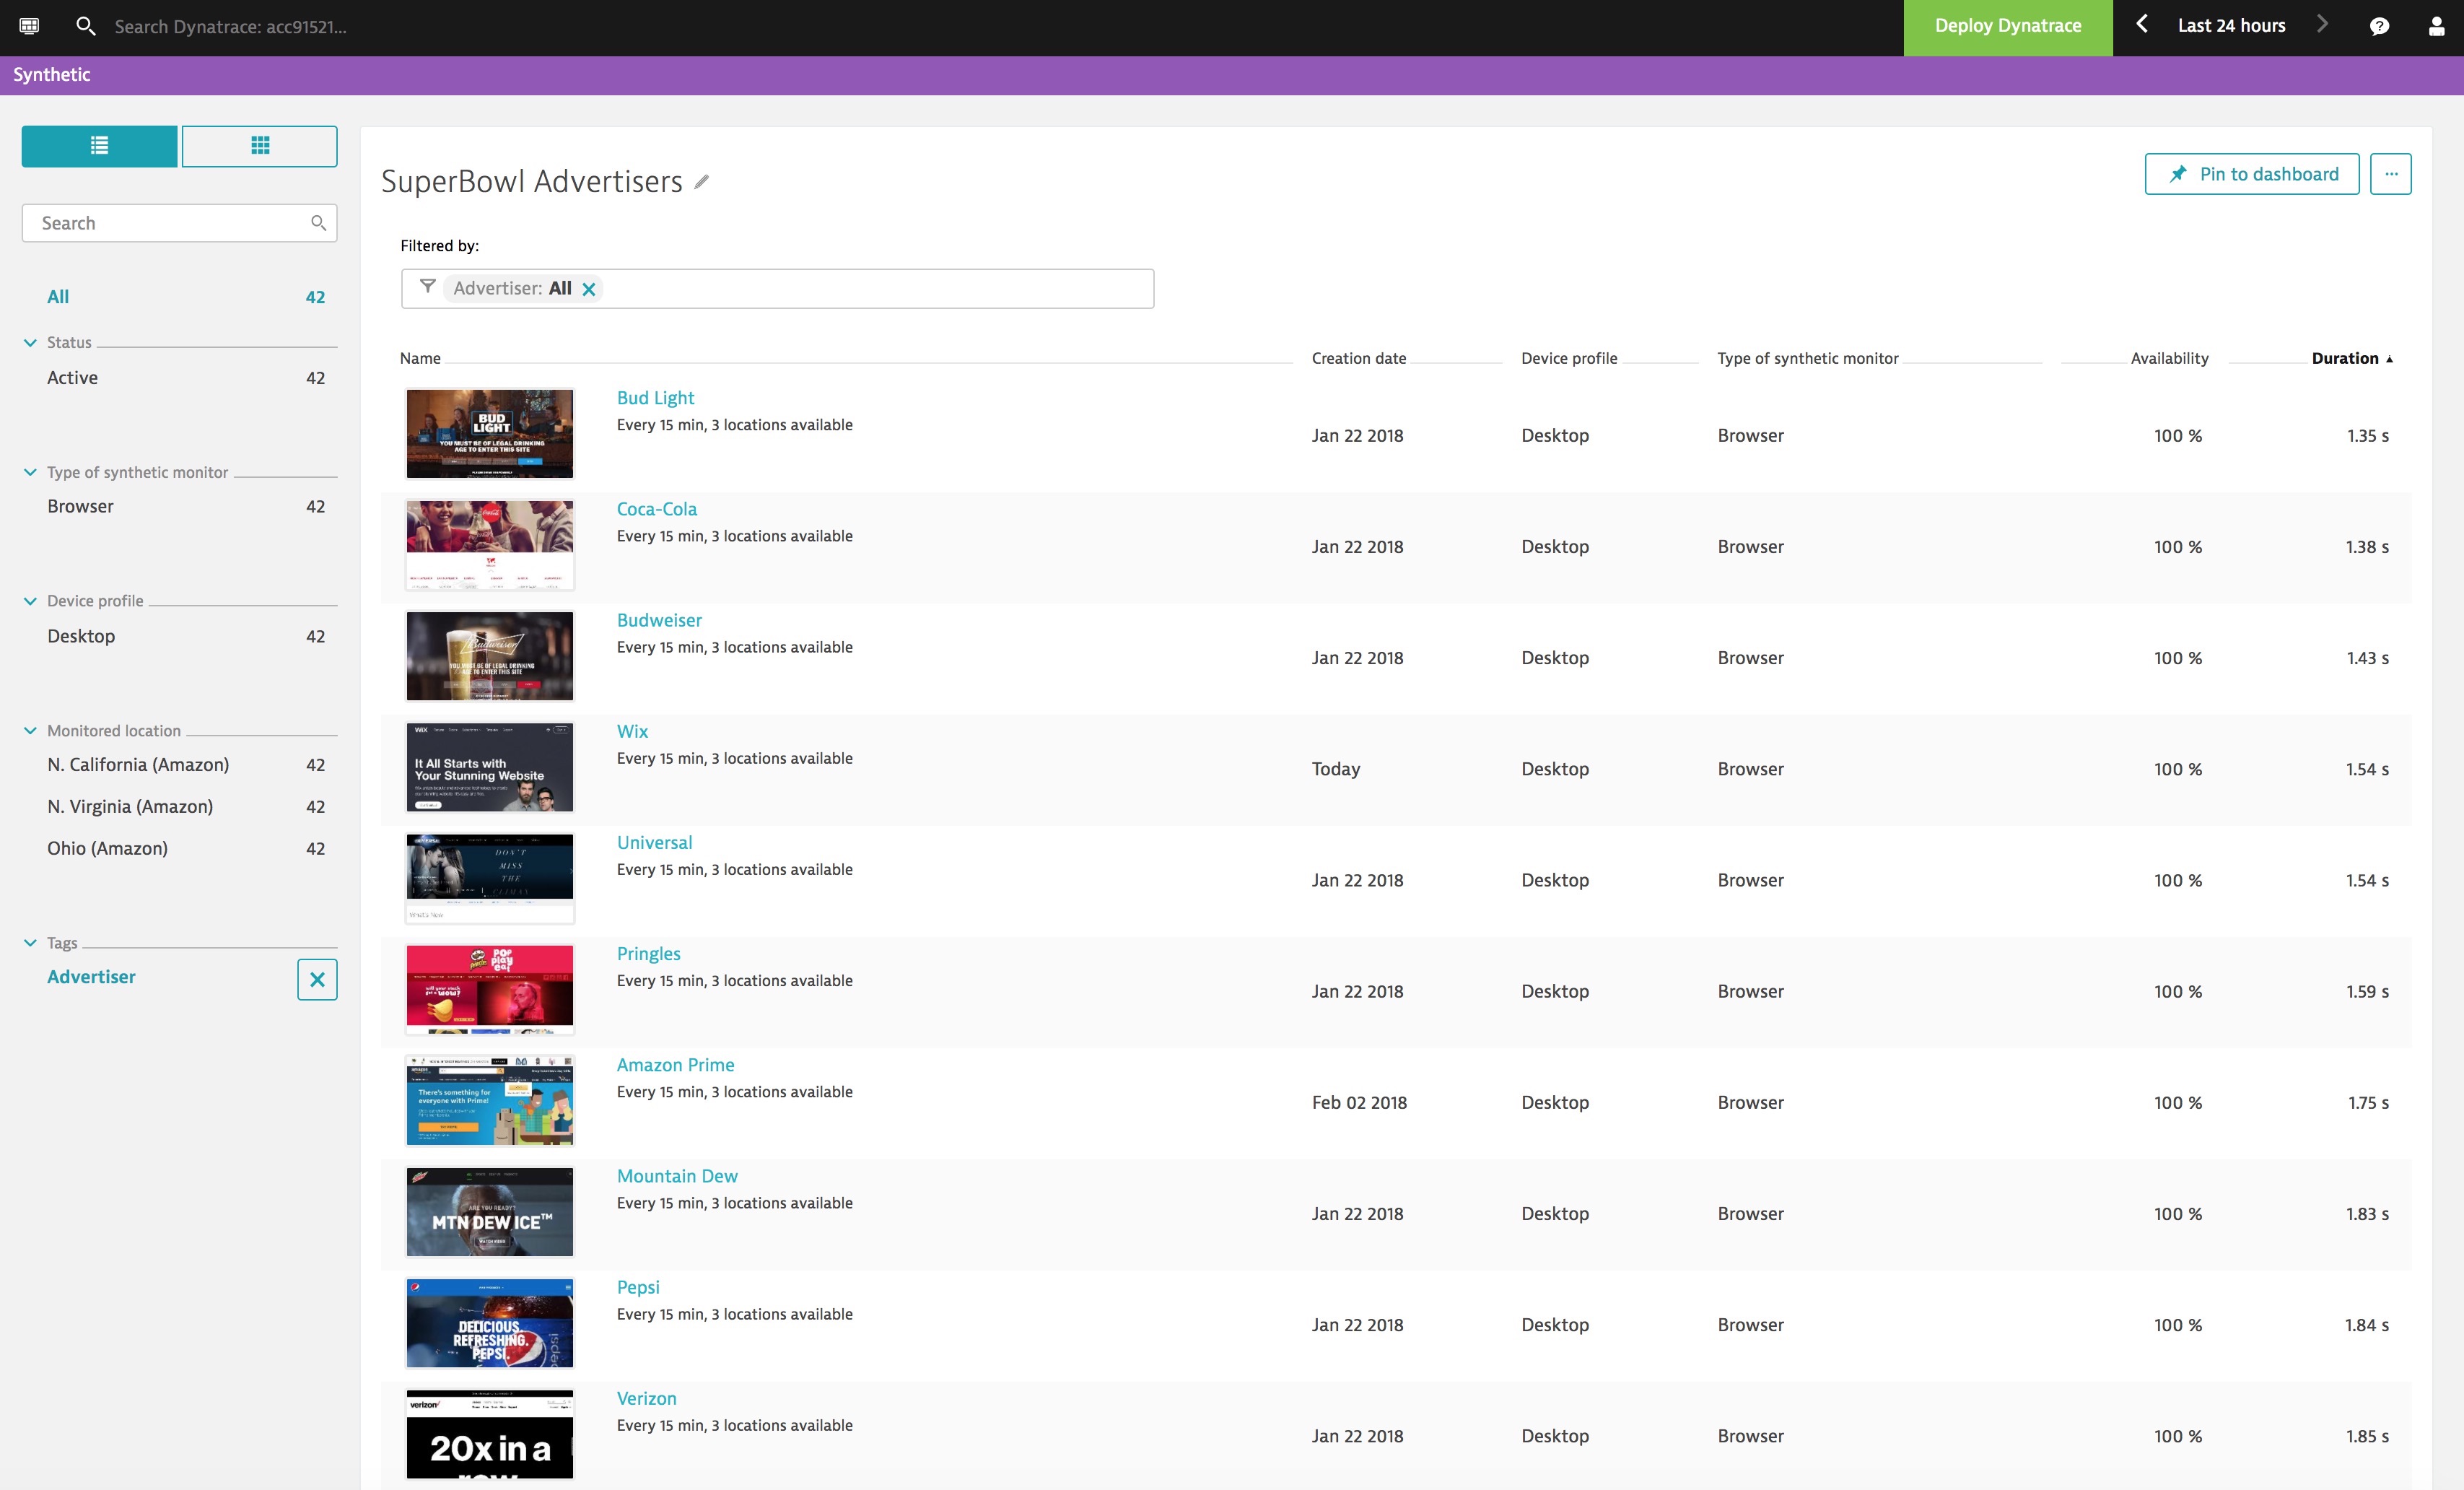
Quick Update, Budweiser, Amazon & Pepsi amongst others are laying down some impressive web and mobile performance ahead of the Super Bowl kickoff.
Time for some Super Bowl RUM punch, Feb 4th 5:30pm
RUM, we love RUM, ask Jason how much we love RUM. Here is a view from a Super Bowl advertiser showing Real User Monitoring (RUM) data coming from Dynatrace. As you can Dynatrace uses dynamic interactive infographics to make it easier to understand when performance is impacting end users.
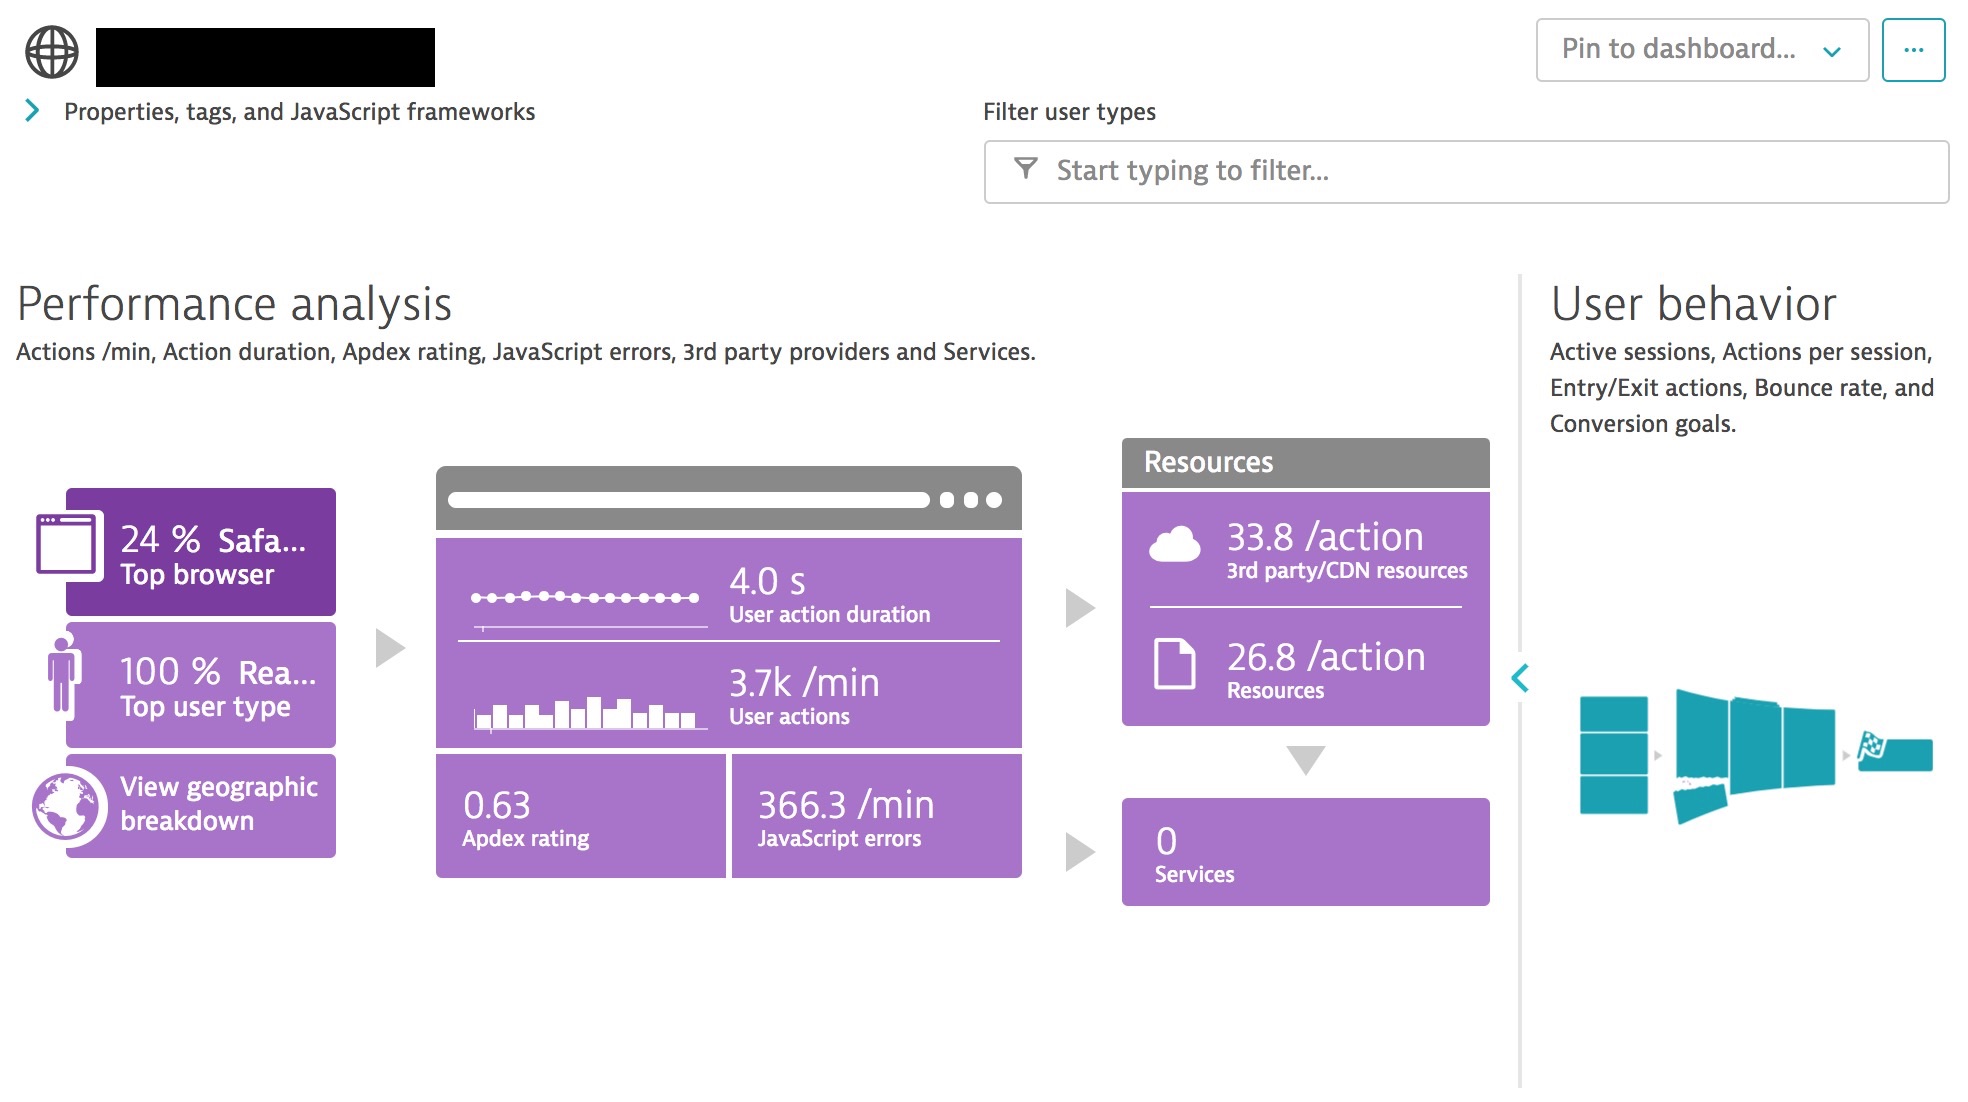
These graphics drill down into views like the one below, where we can see a breakdown of what digital touchpoints consumers are using to access the advertisers web and mobile applications. Here we see that more than half the traffic been seen today is on some form of mobile device or tablet.
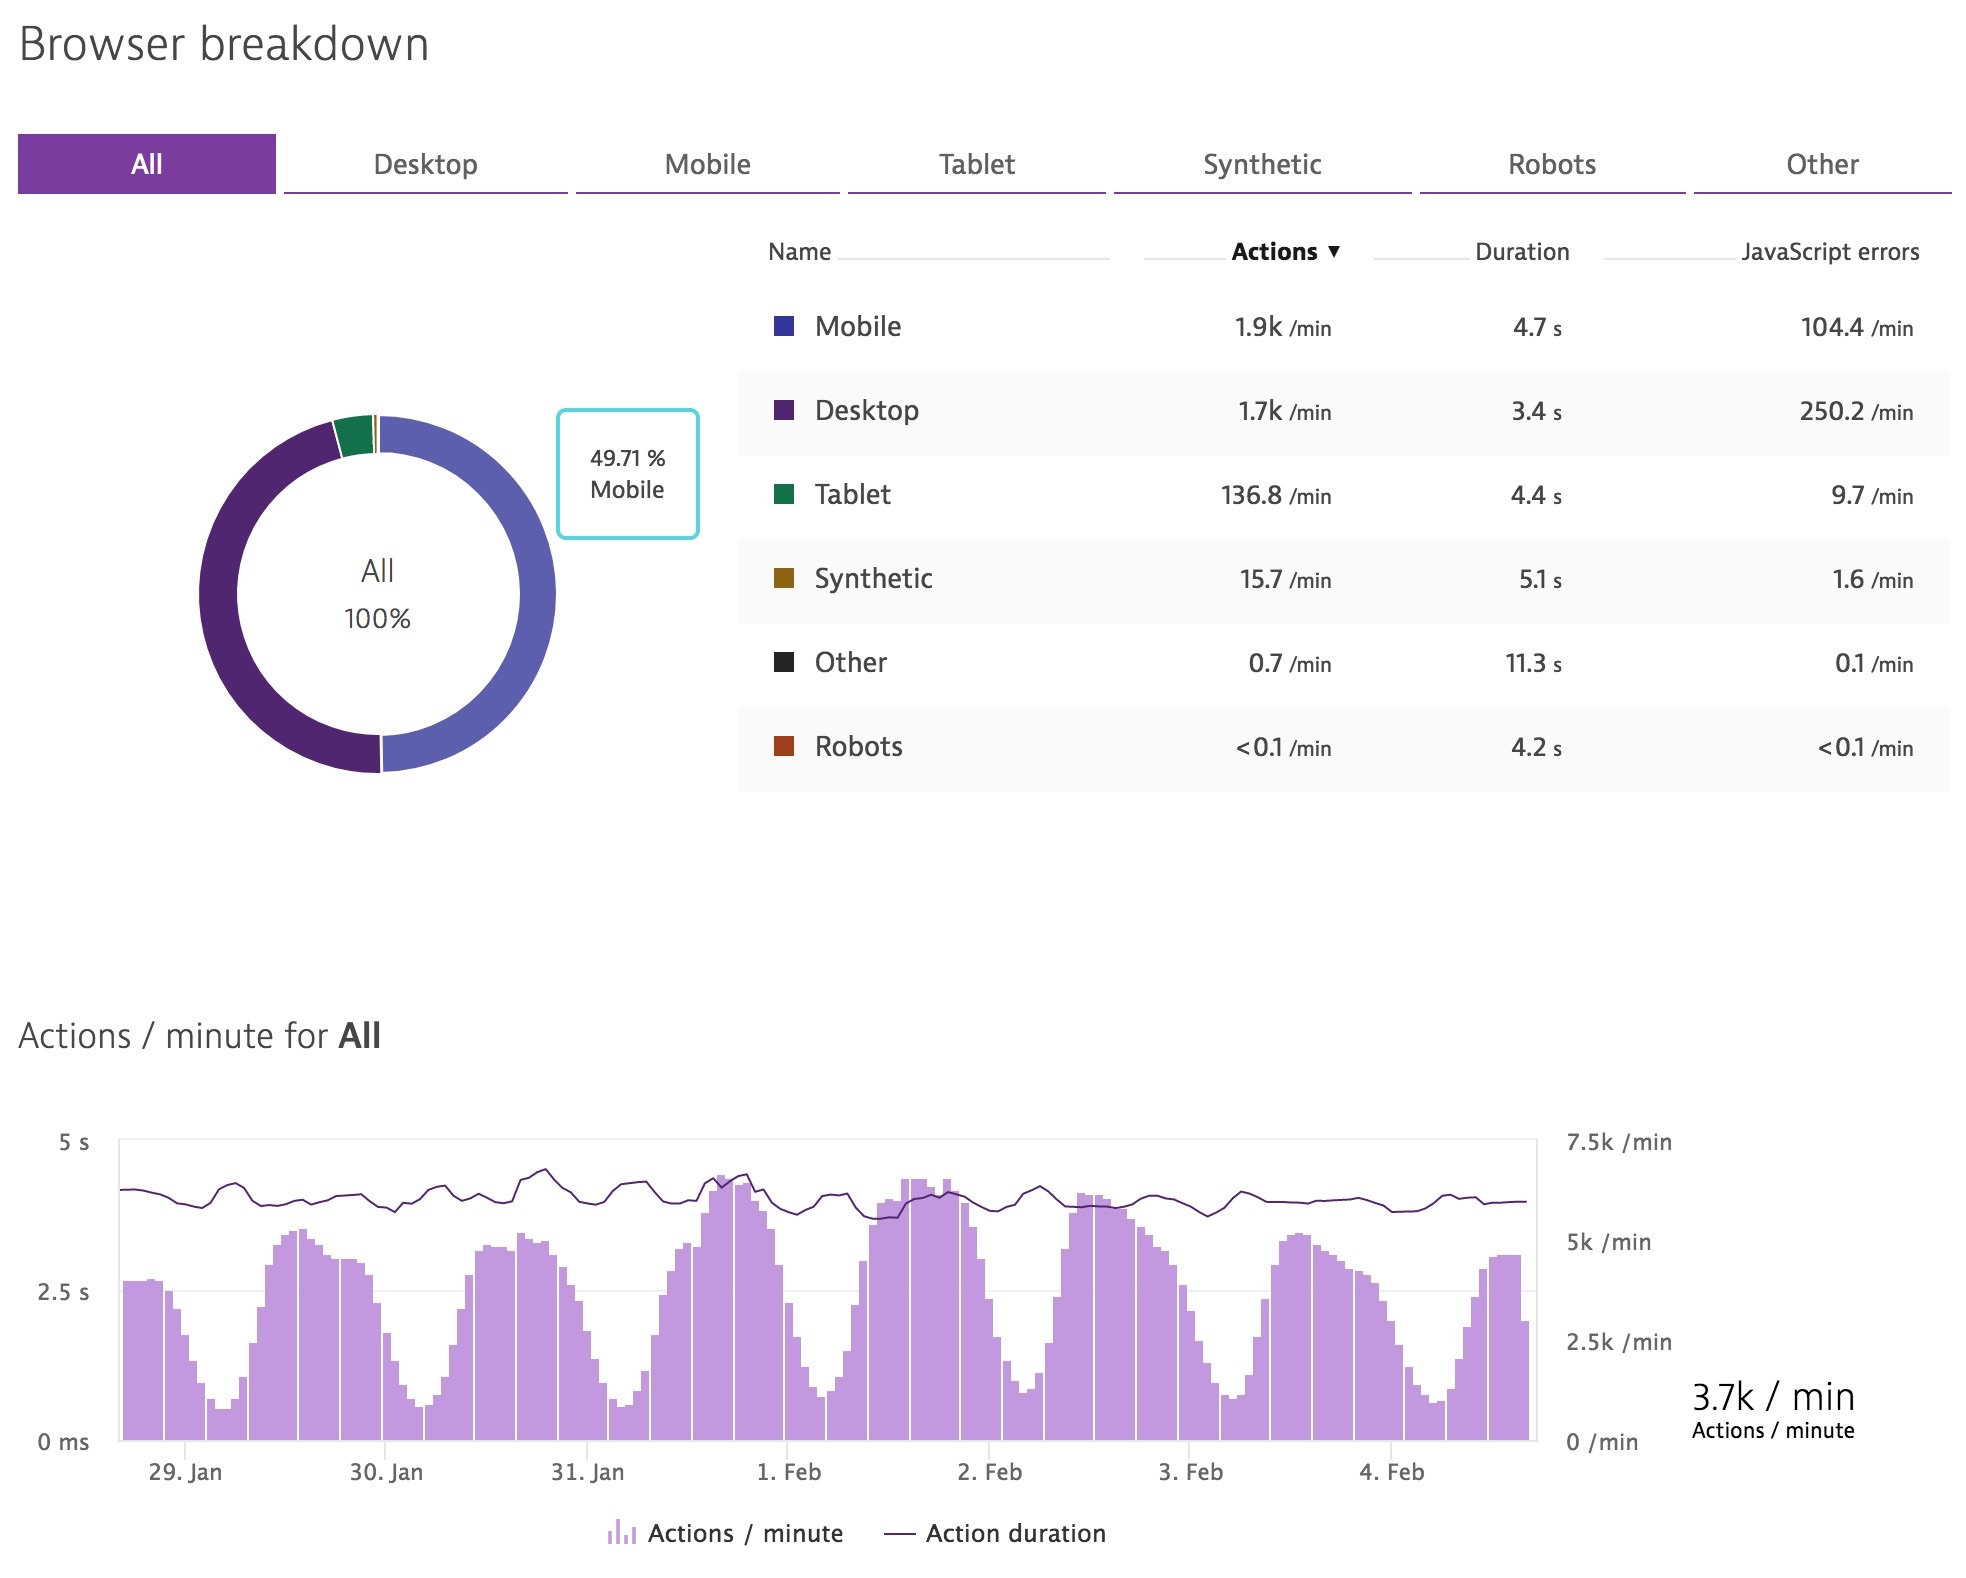
Take note of the chart above, this is a view of the traffic over the course of a week. The peaks and valleys represent typical business hours. If successful on Super Bowl Sunday the advertisers traffic will increase as a result of the ad. Tracking this is referred to attainment and conversion.
RUM data can help isolate localized trends as well. Below is a map showing user activity across the US. In situations like today getting a view of the whole country is useful to see if there are any local issues.
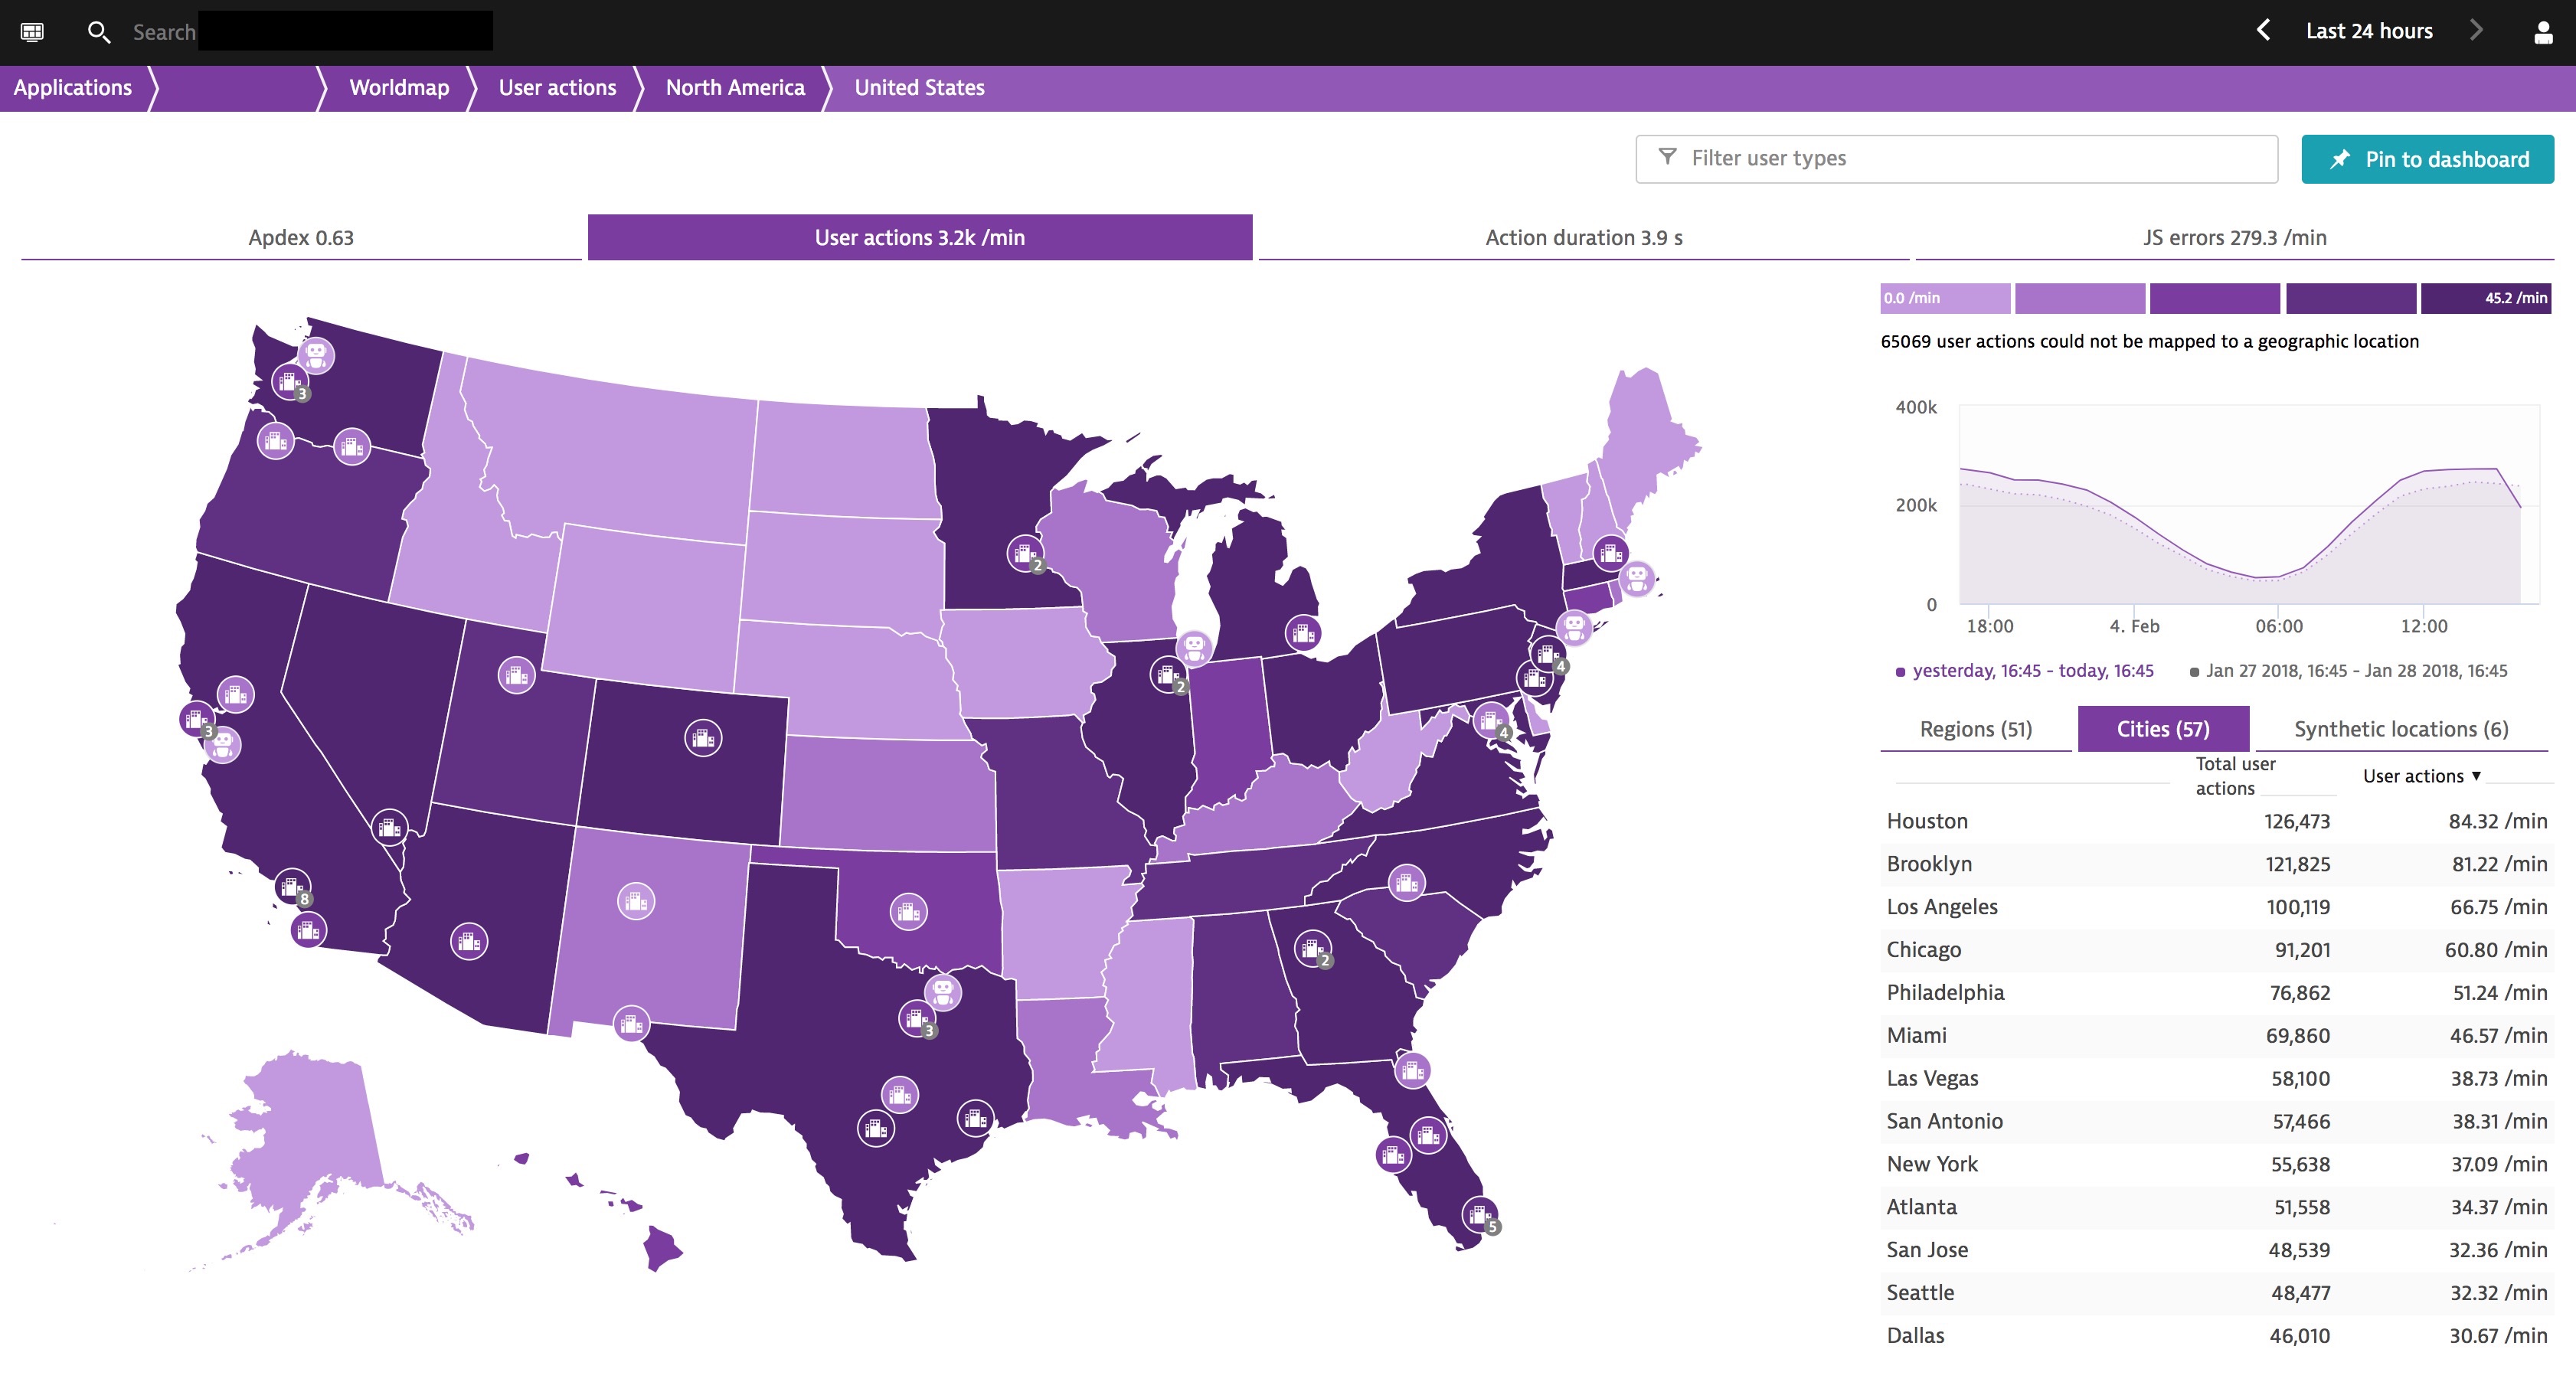
However, sometimes ads might get pushed to more local regions, in that case you need to be focus on the customer behavior for specific regions. Below is a view showing tonight’s hosting city Minneapolis.
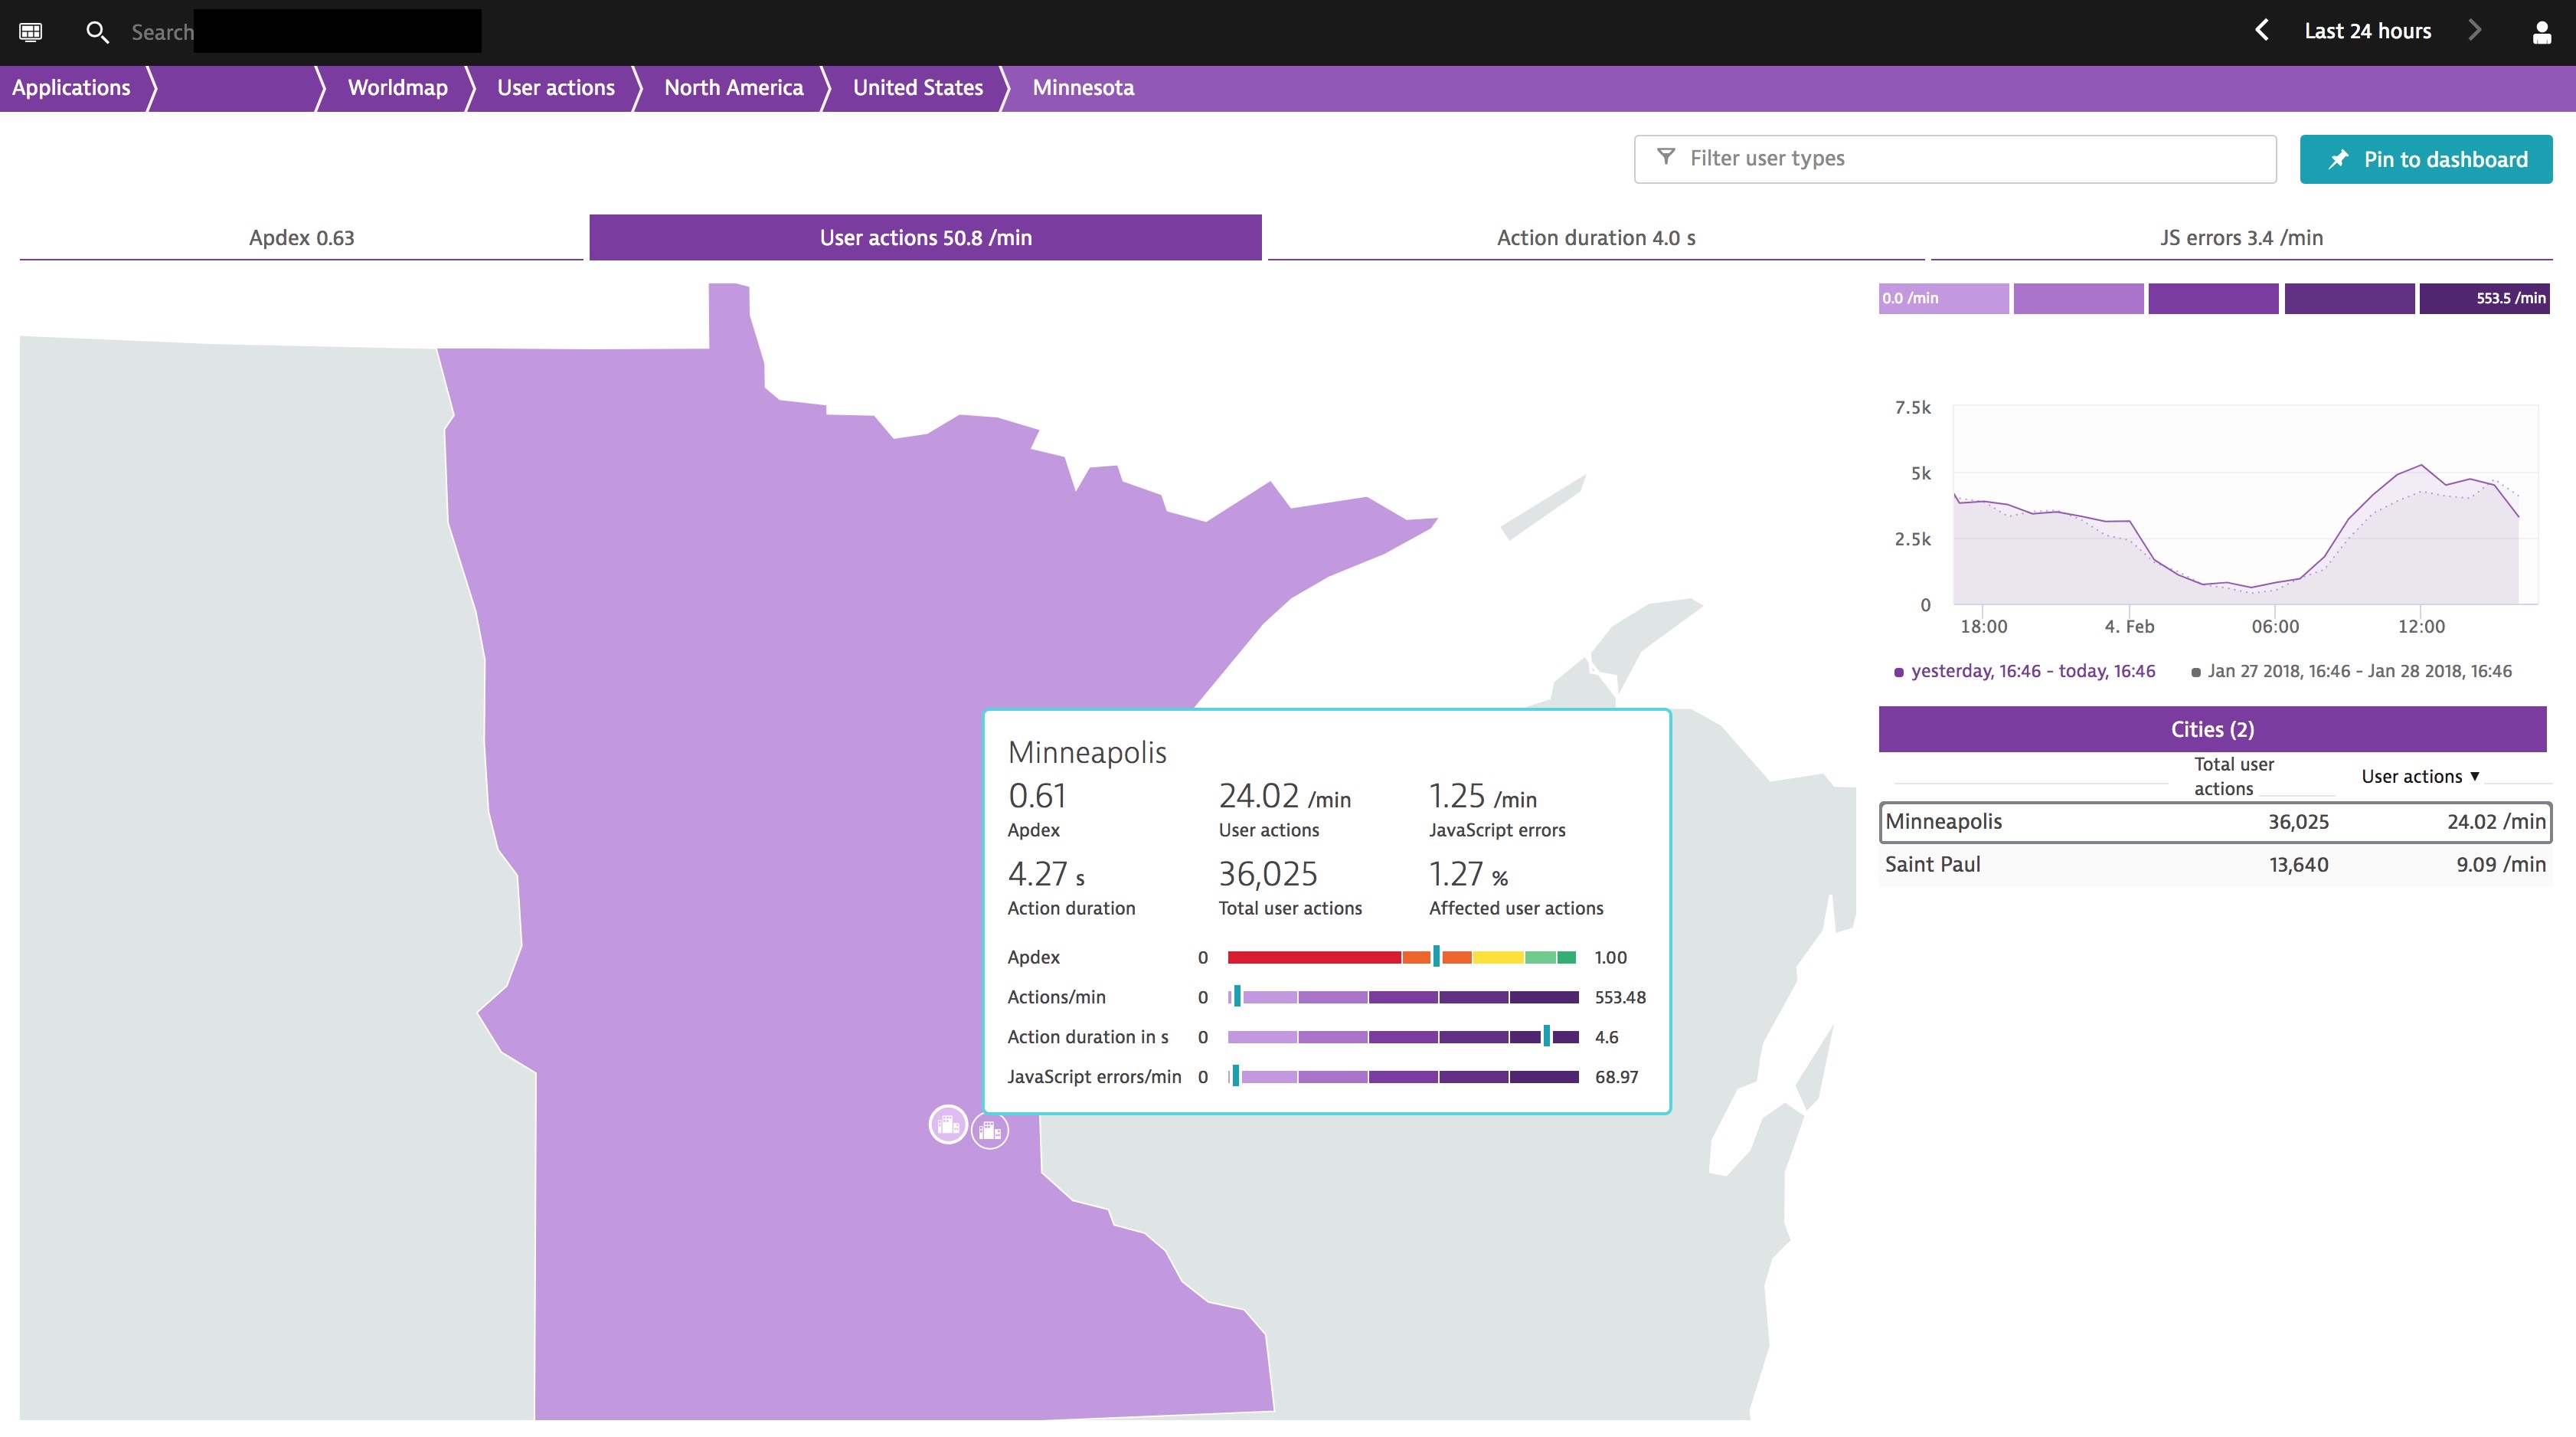
The reason this is vital is that content providers, third parties, ad networks can all have localized issues which can impact the viewer in their client/browser. This is often the case with localized JavaScripts. When diagnosing client side errors, you need to also be able to under which browser they are being seen in. For example, below this advertiser is seeing localized JavaScript errors which are only impacting Chrome based browsers.
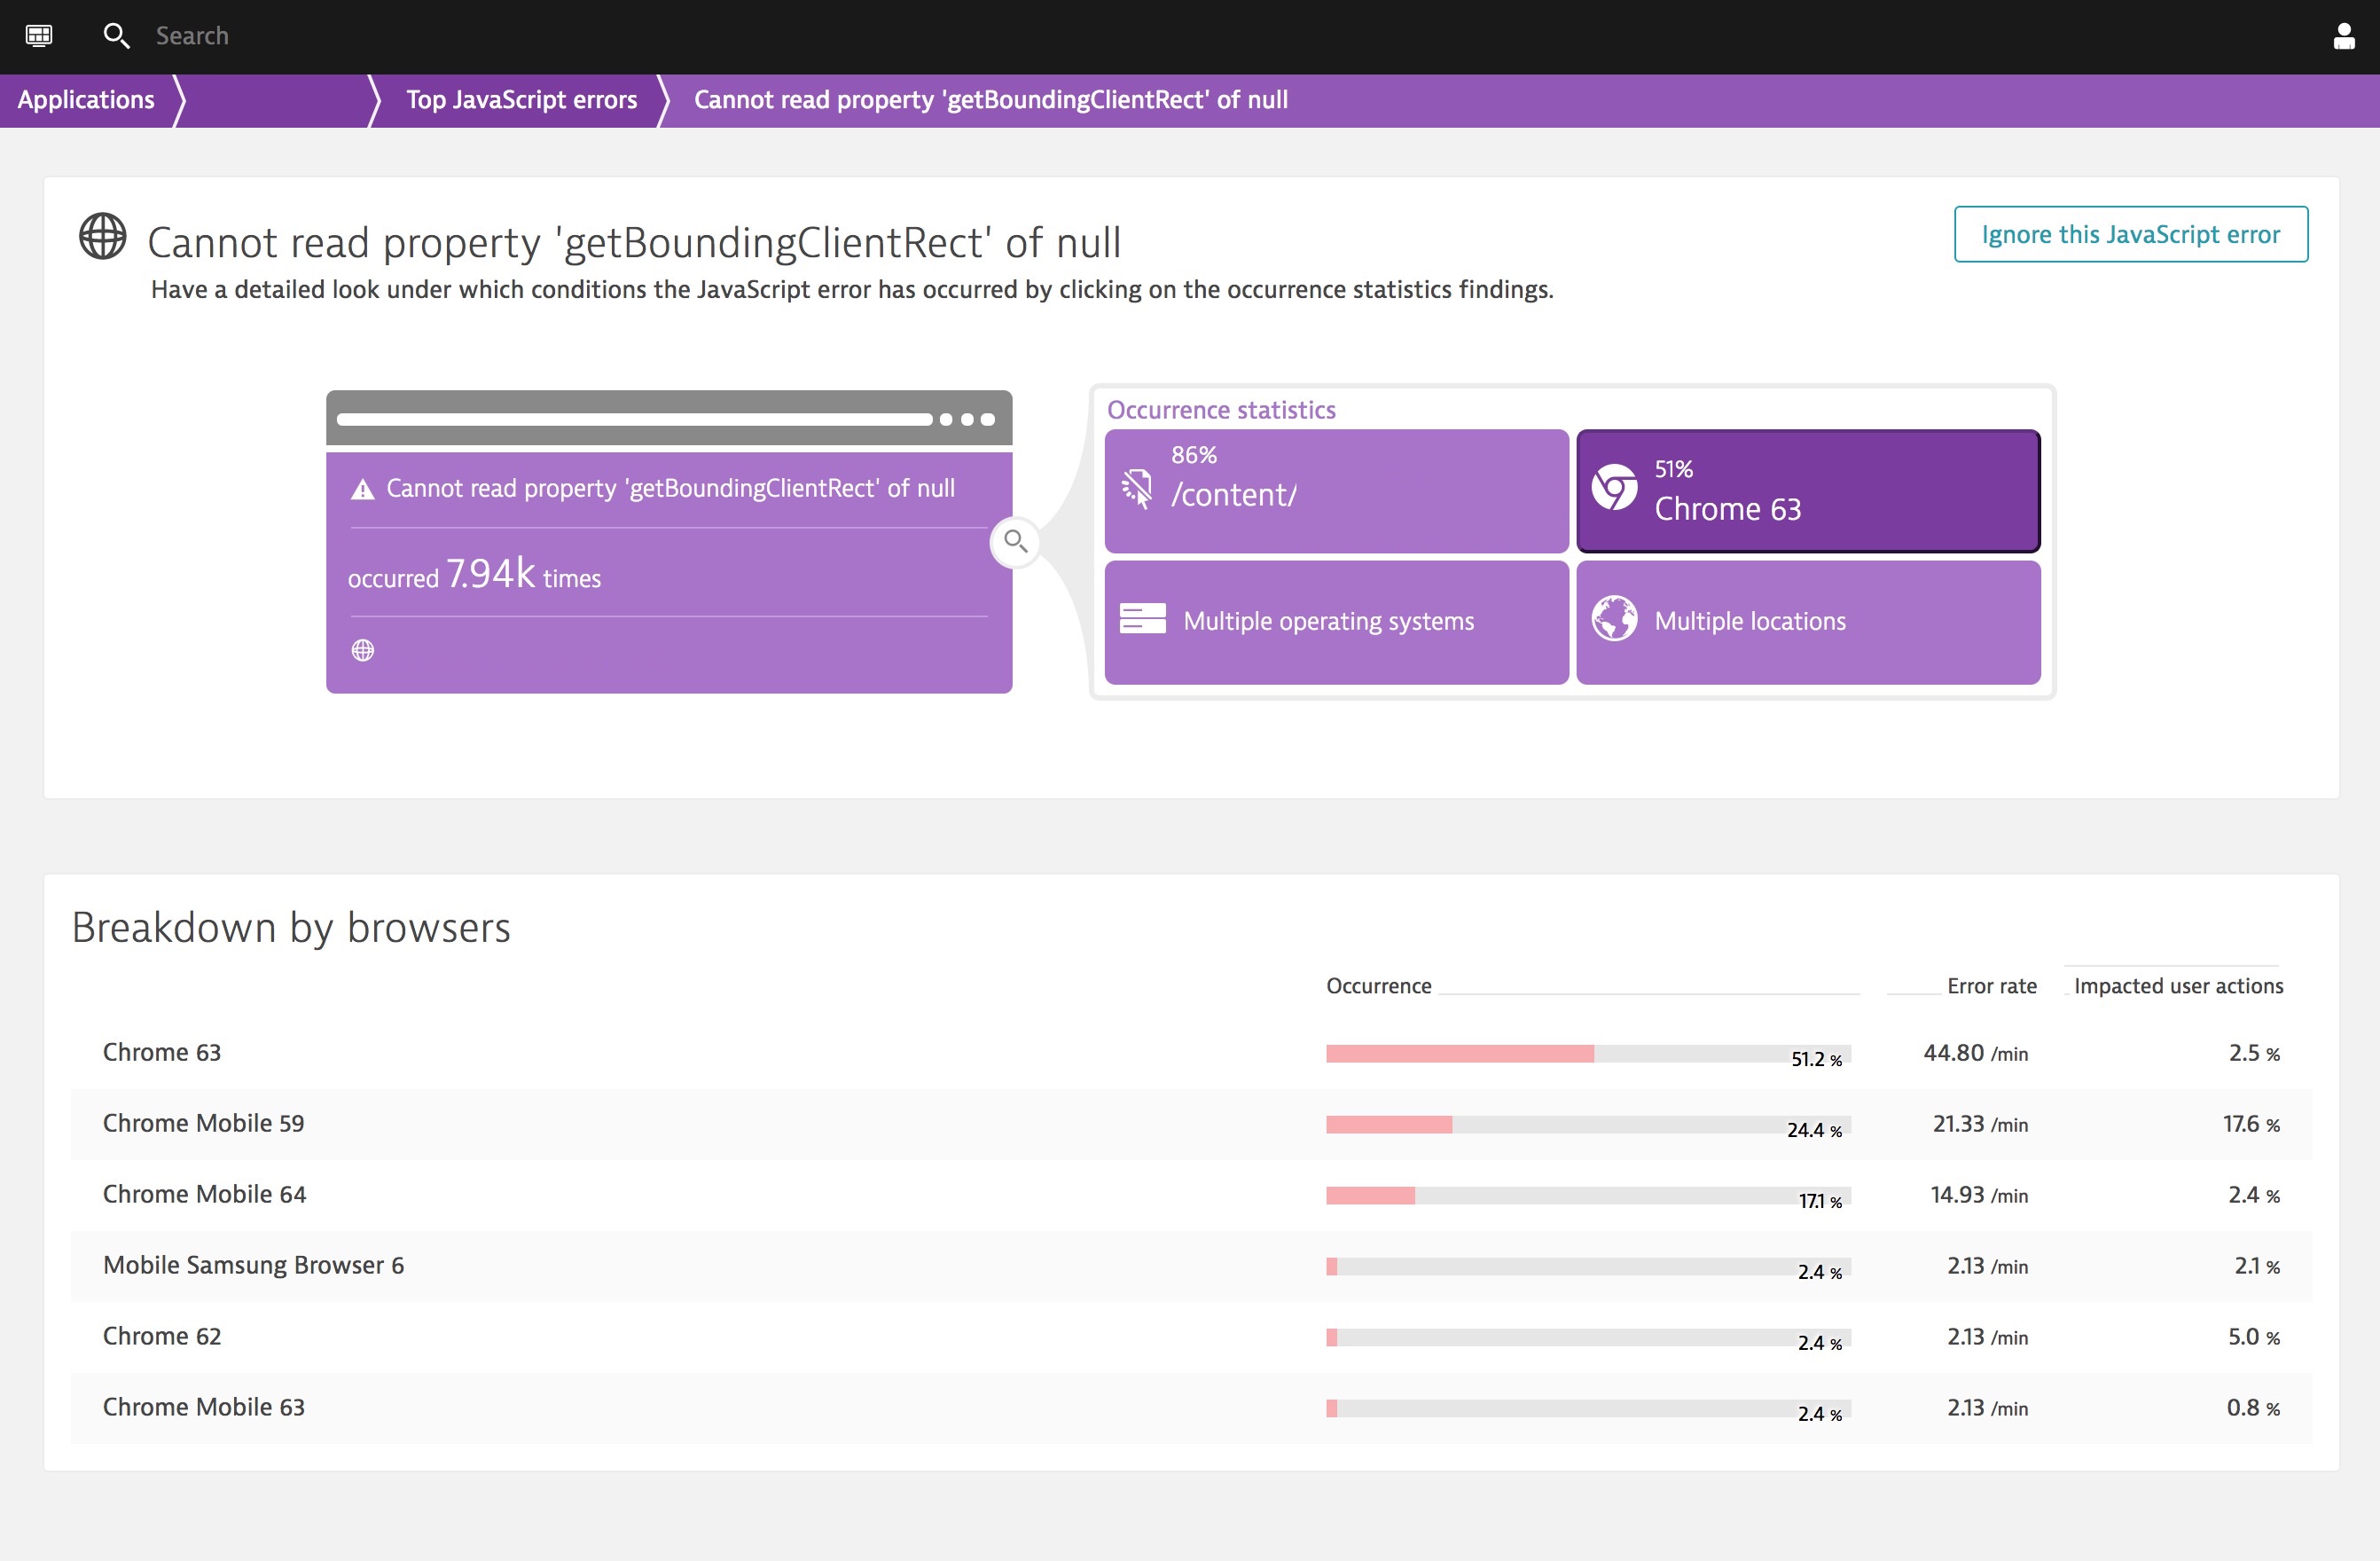
Catching these ahead of time helps ensure optimal end user experience, and makes sure they are not preventing viewers from converting after watching the Super Bowl ads.
Puppies… I love Puppies, Feb 4th 4:30pm
This years Puppy Bowl from Animal Planet went off without a hitch performance wise.
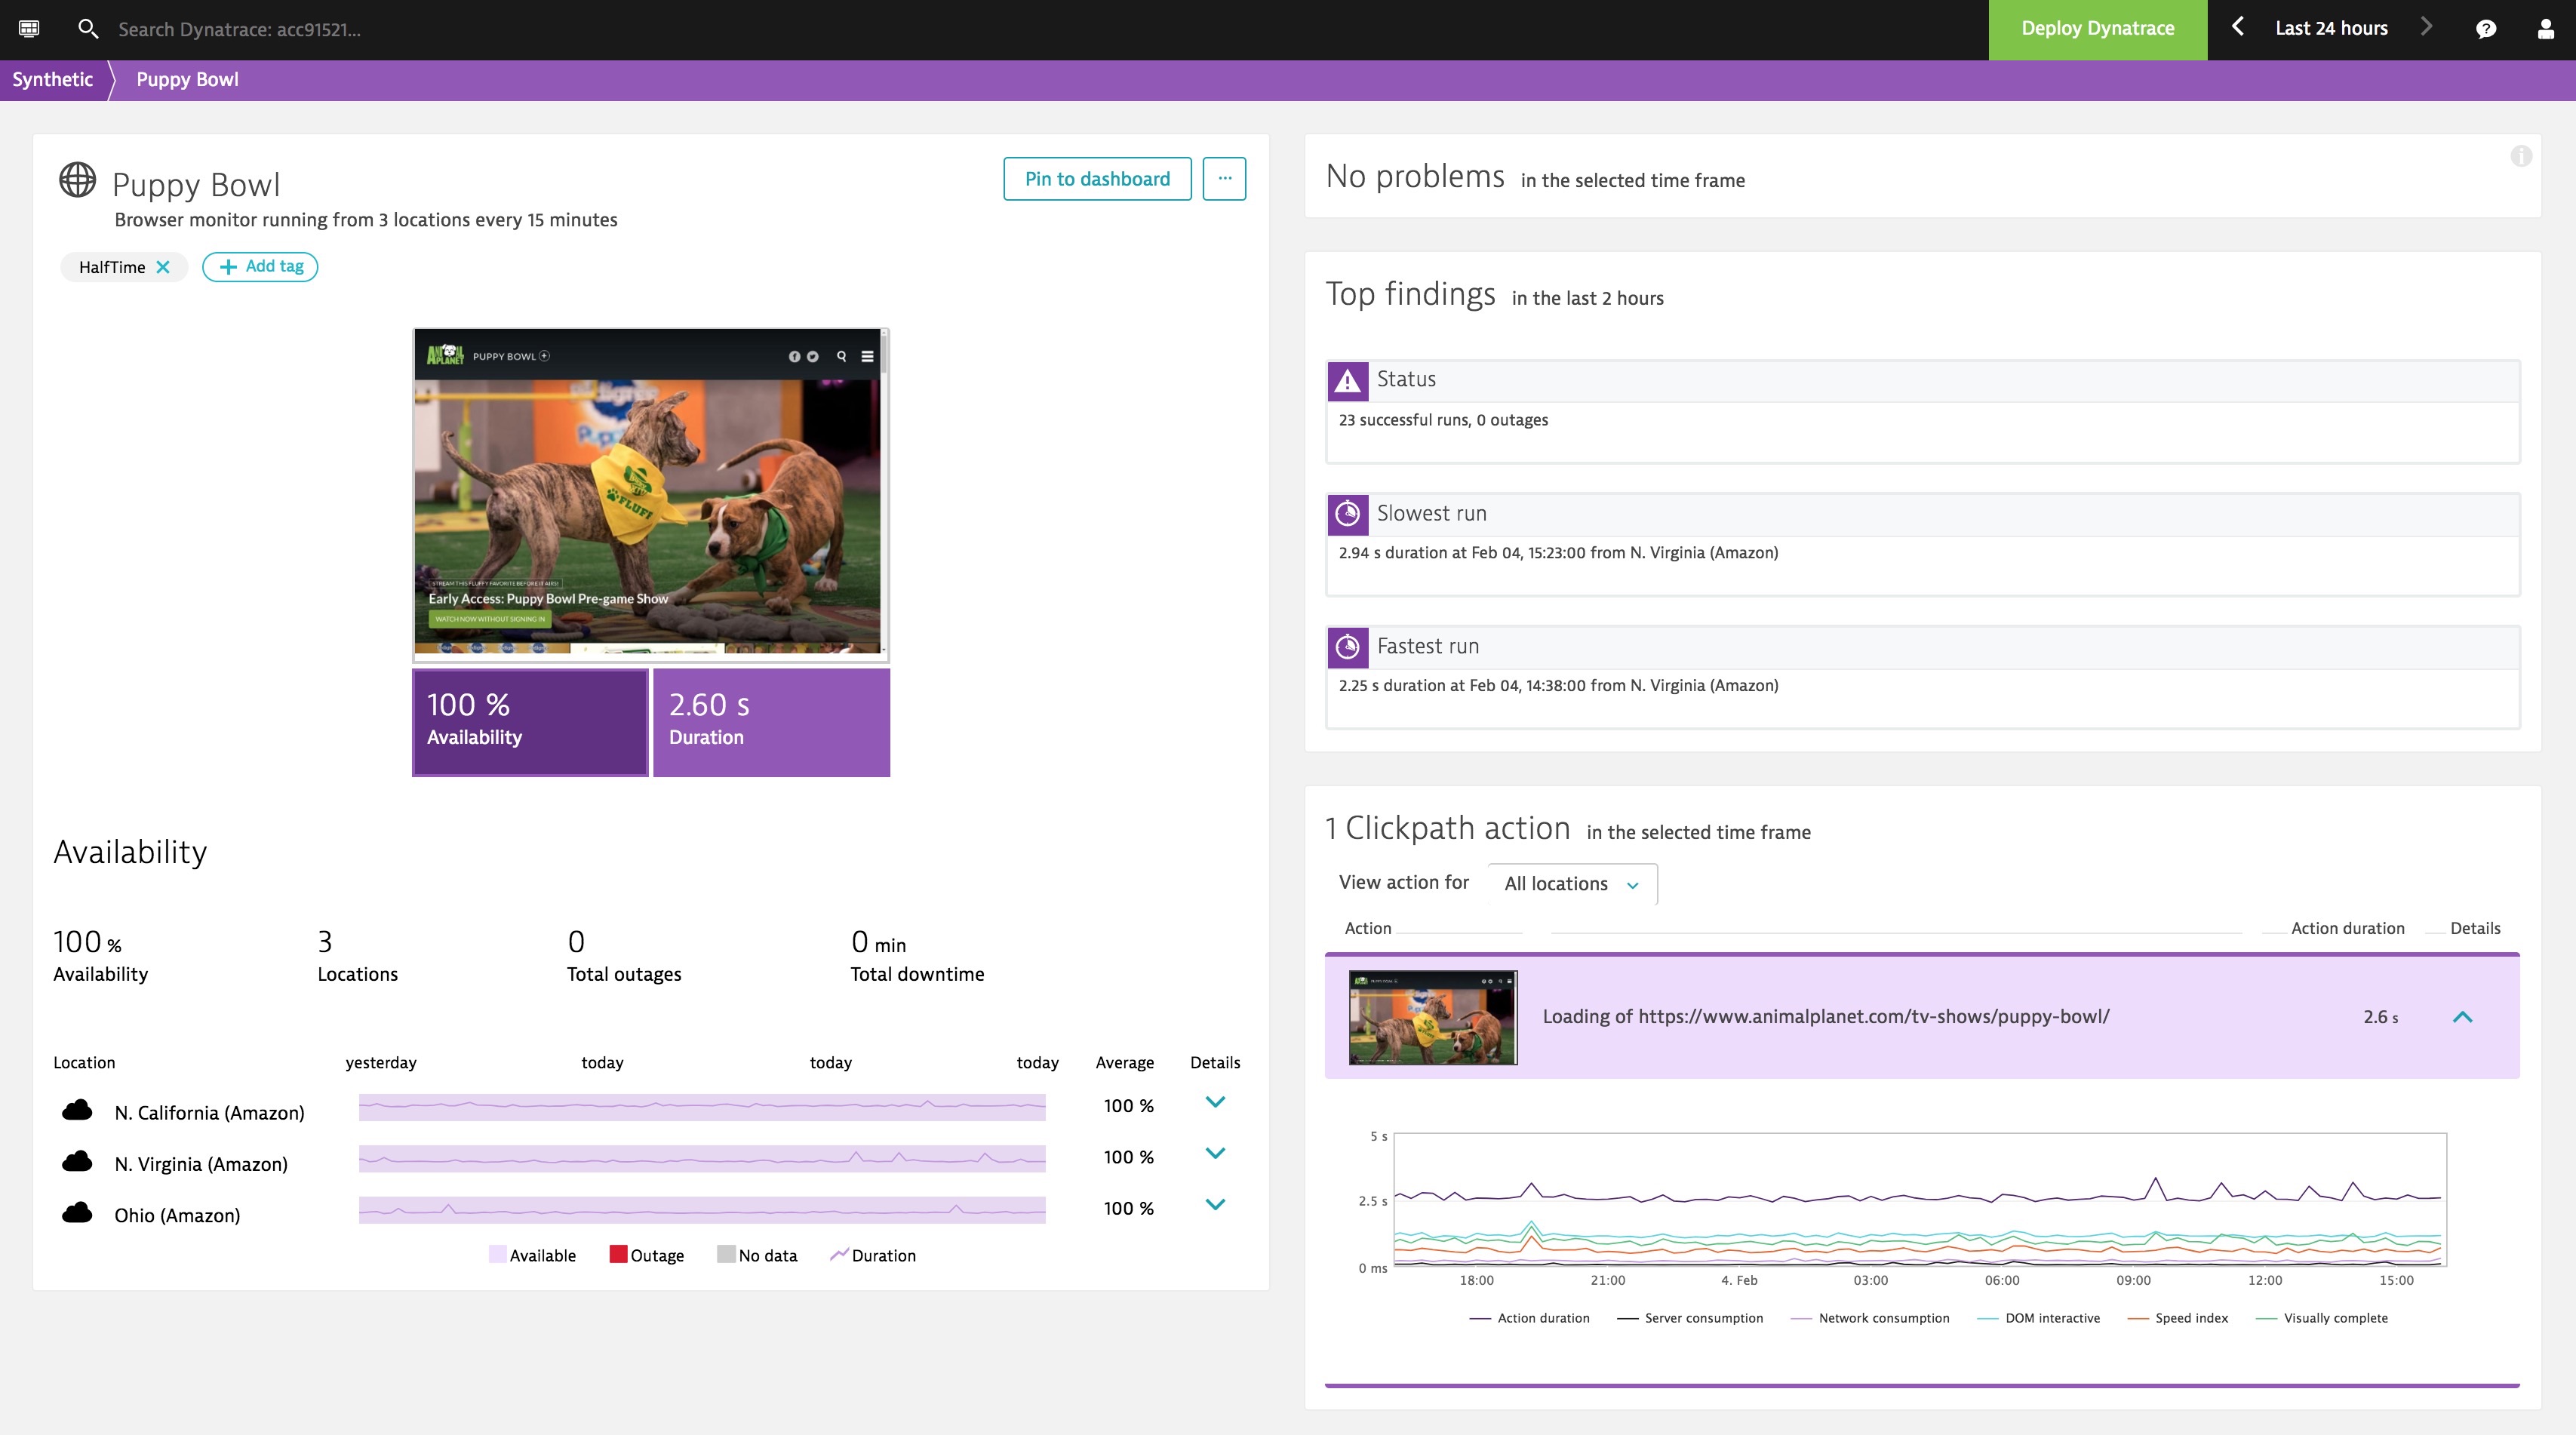
Here is a detailed view what we saw. The page loads quickly with an impressive 1.03 seconds for it to be visually complete.
Aw, Snap, Feb 4th 3:30pm
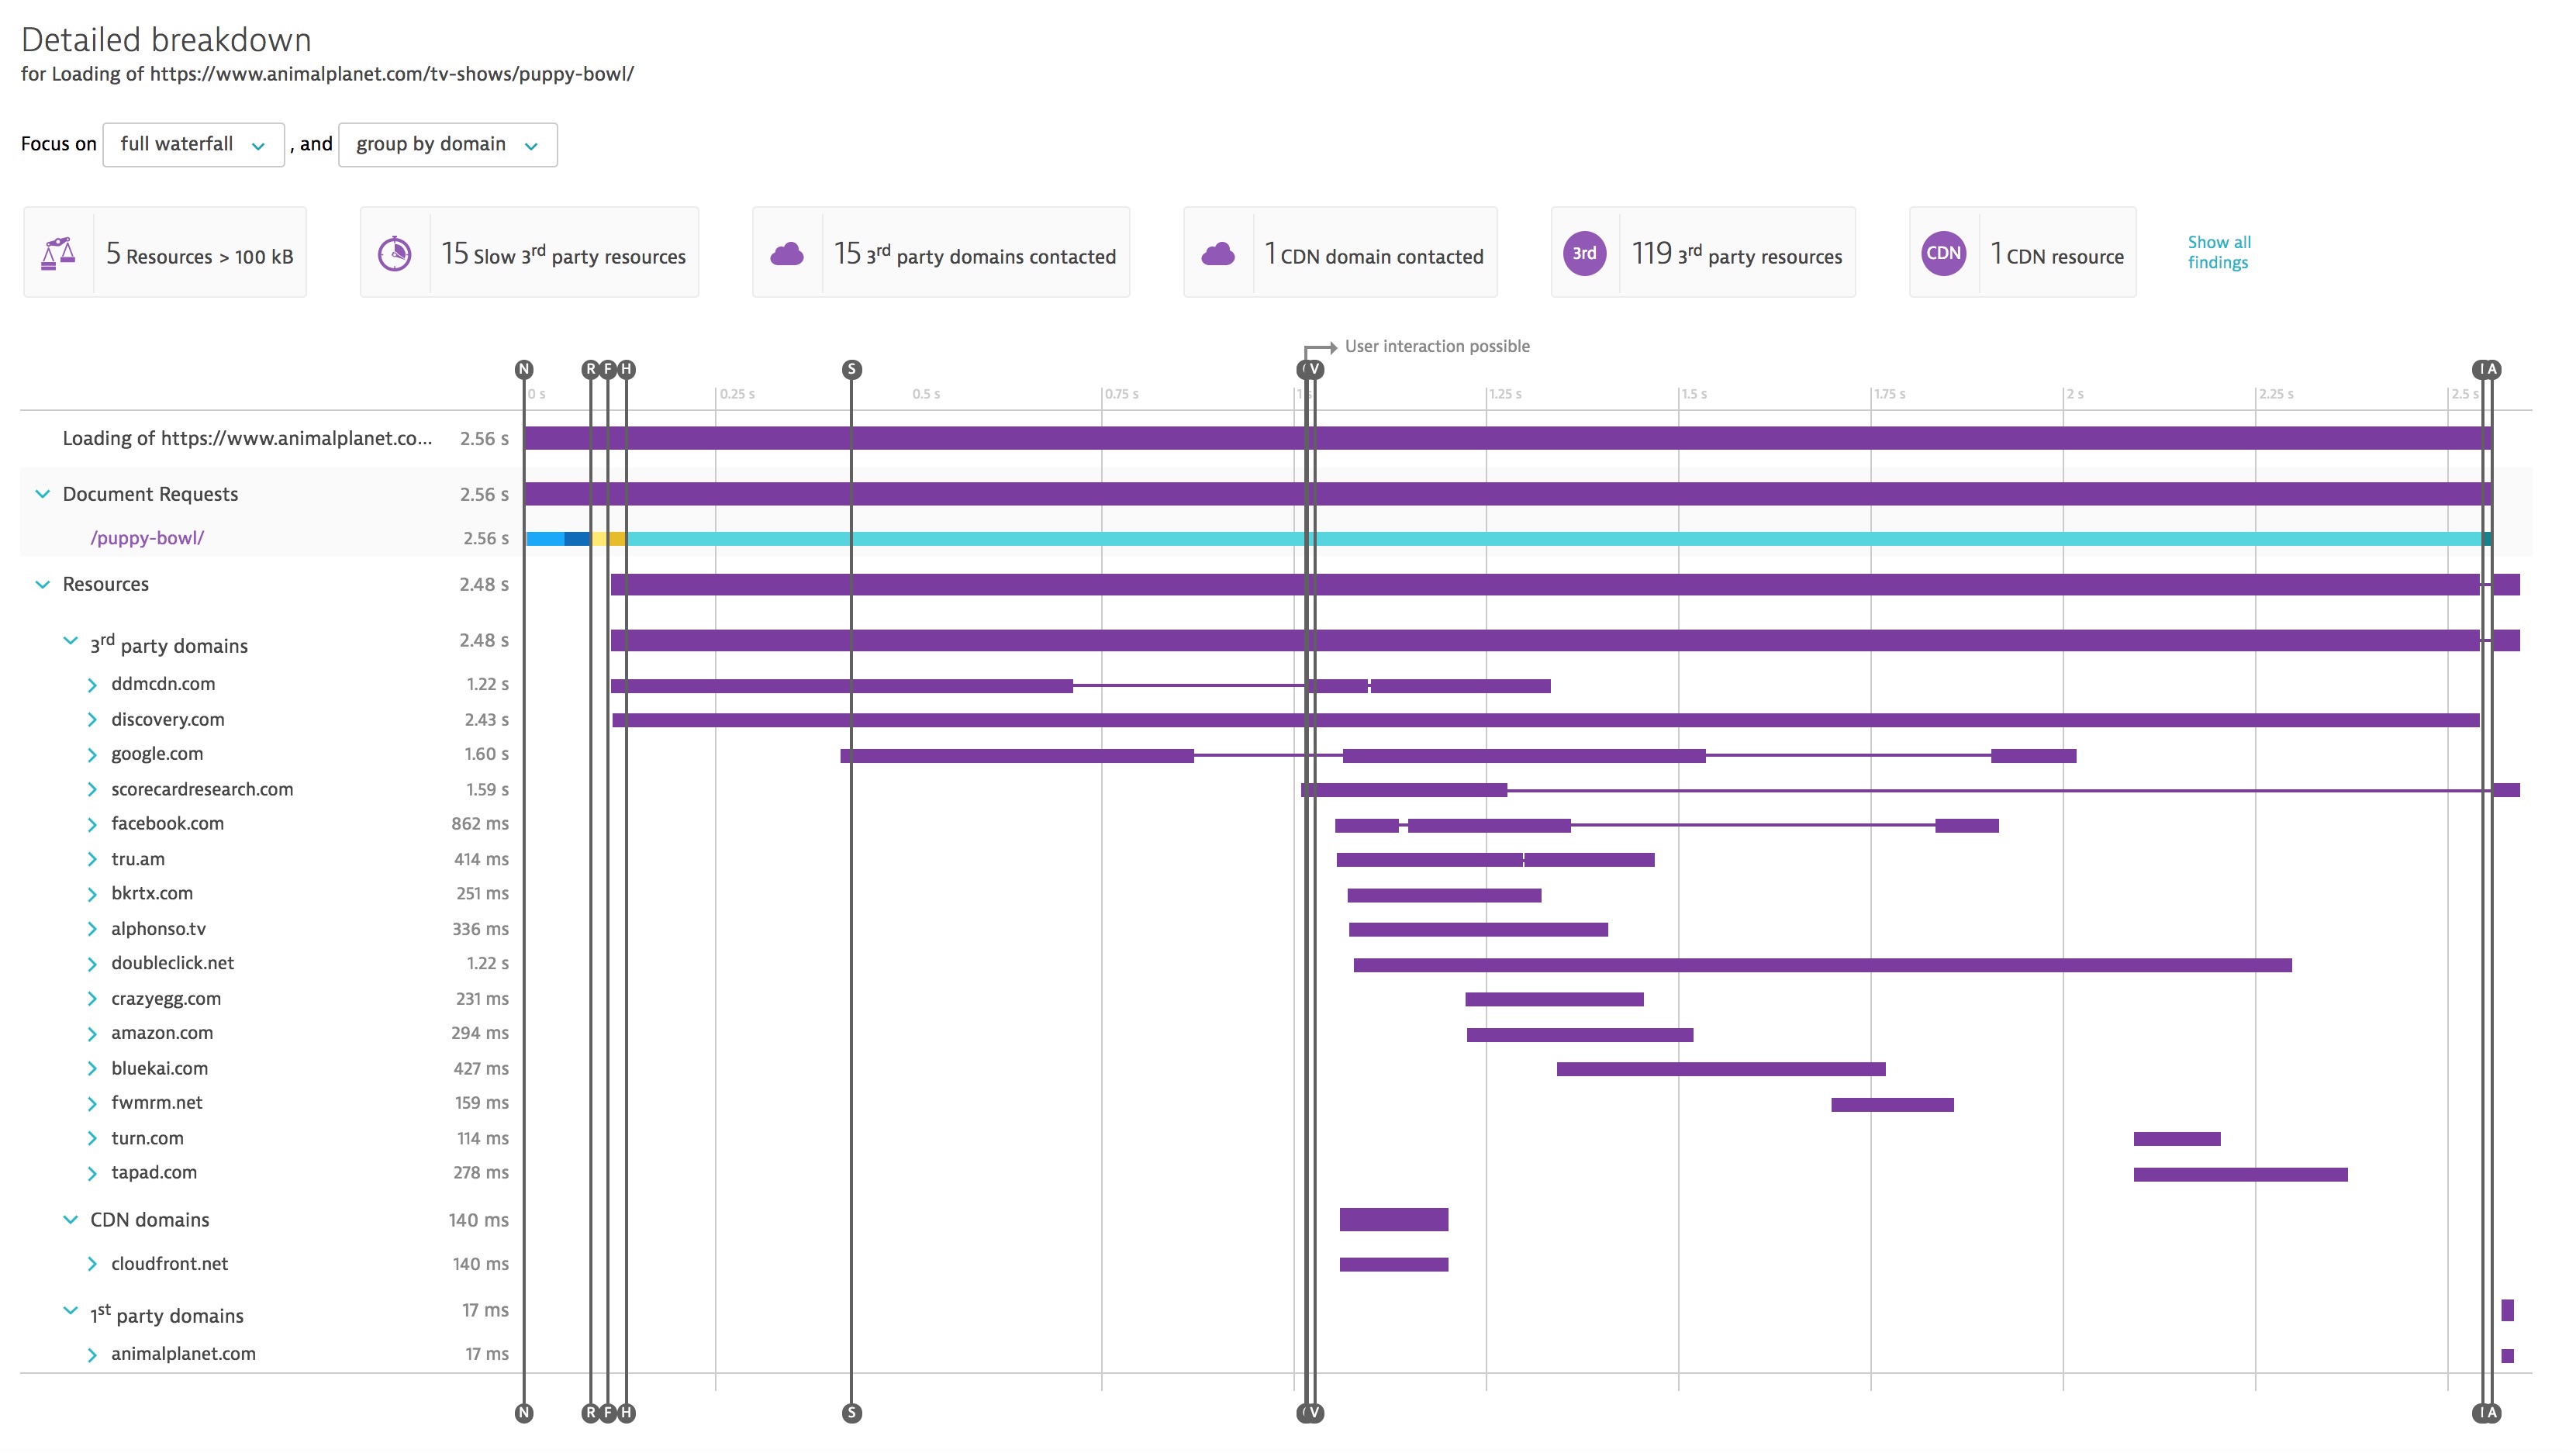
OK, some questionable decisions being made by an advertiser leading into the big game. This advertiser is delivering a page which loads almost 15 MB of data, making 118 network round trips across 51 connections from the browser to 20 different hosts (3rd parties).

Much of that page weight are image assets over 100KB and 2 of them are being delivered from slow CDN (Content Delivery Networks) with the rest being delivered directly from other 3rd parties.

The decision has resulted in some inconsistent performance results leading into the game.
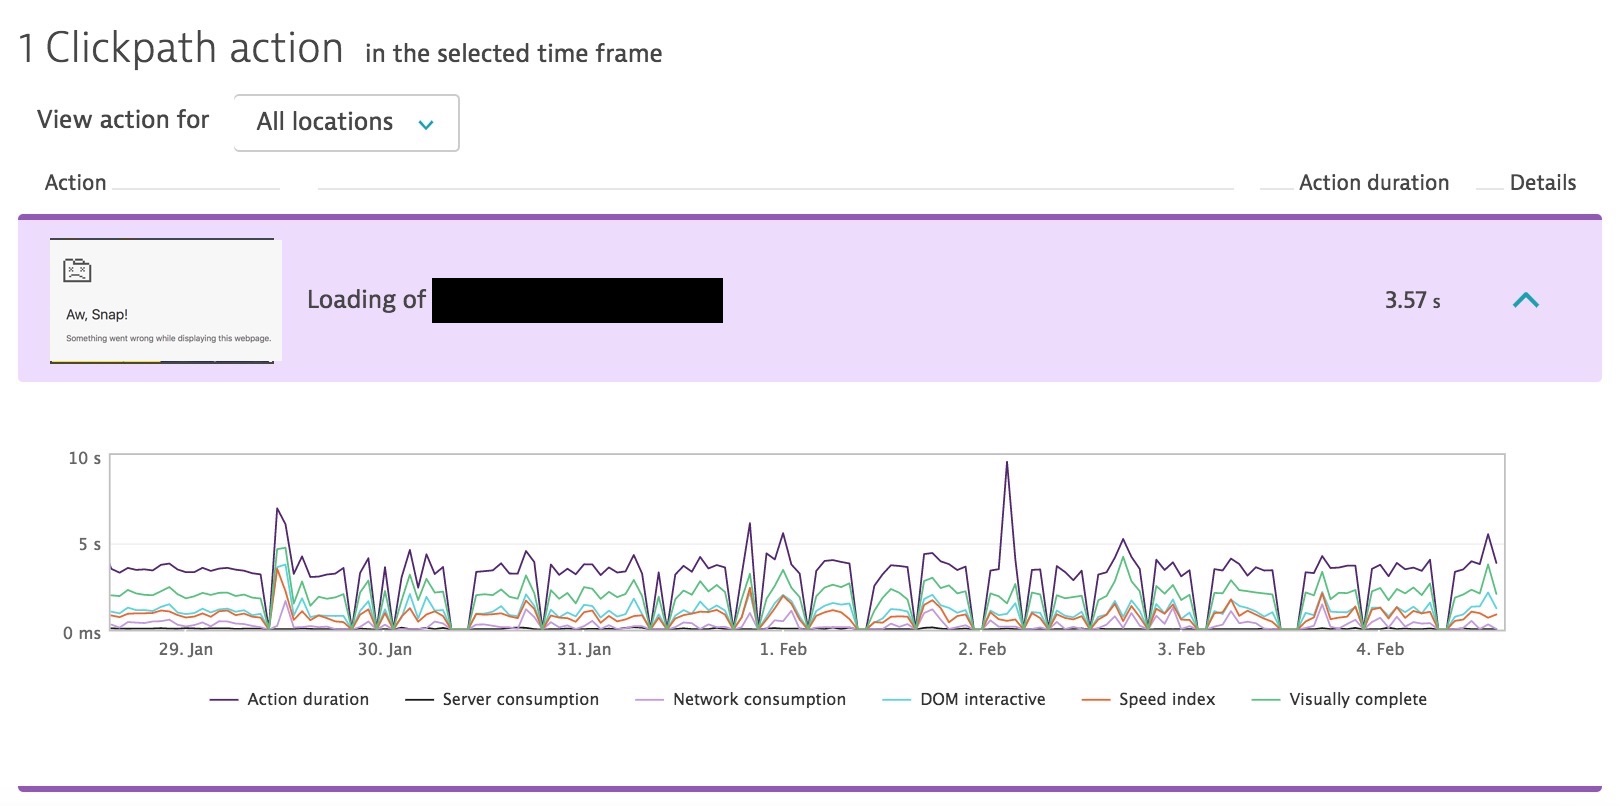
A quick check from my own browser confirmed the problem.
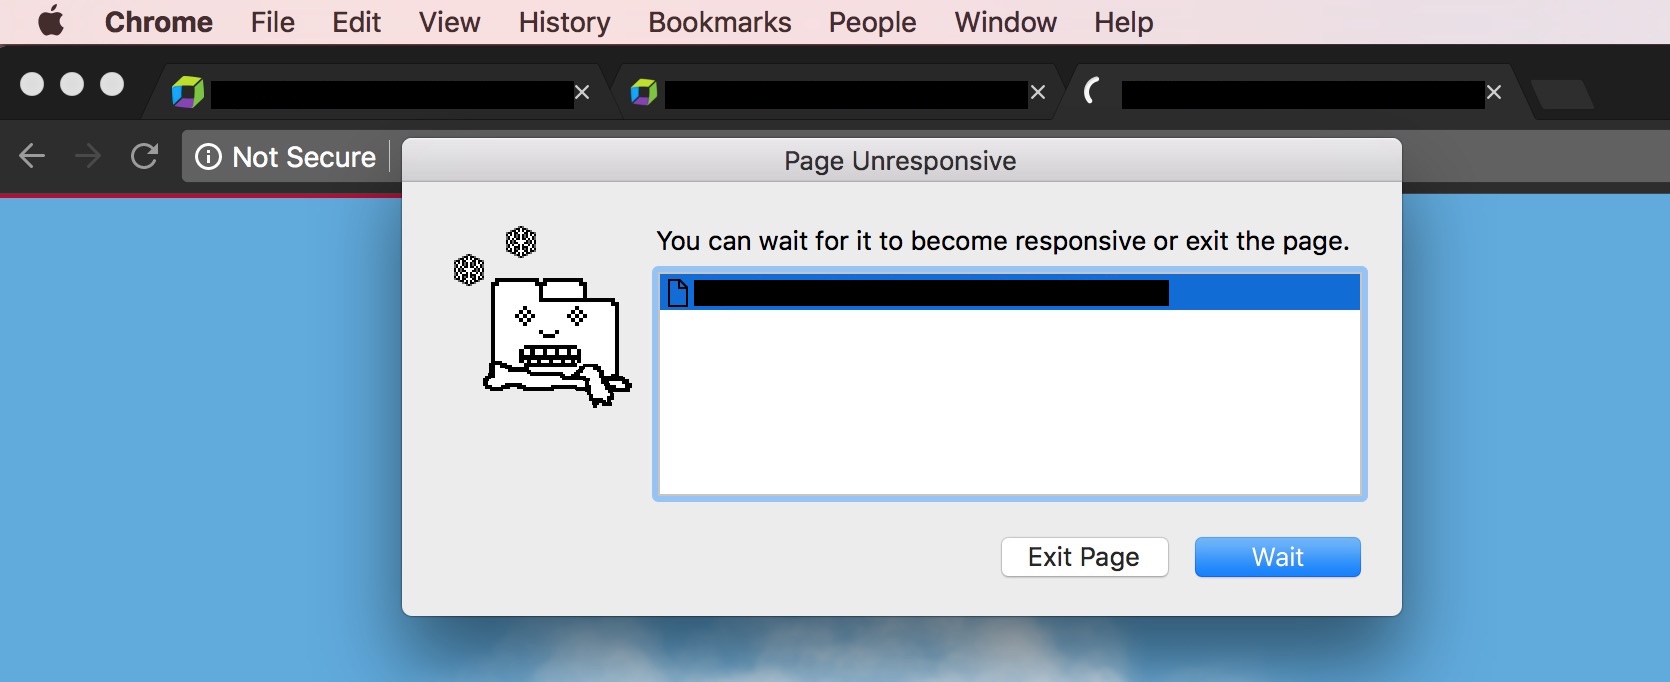
Which leads to…
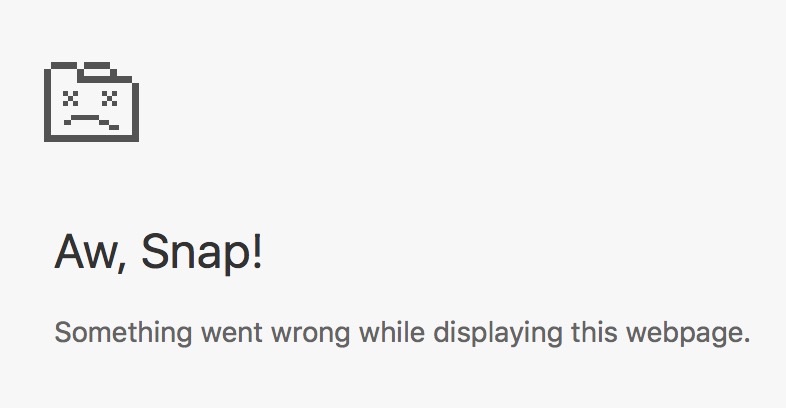
We hope this advertiser can make some changes before their ad airs tonight.
T-minus 4 Hours, Feb 4th 2:30pm
T-minus 4 hours and counting. Here is a view of one of the Dynatrace Dashboards we are using to track tonights game.
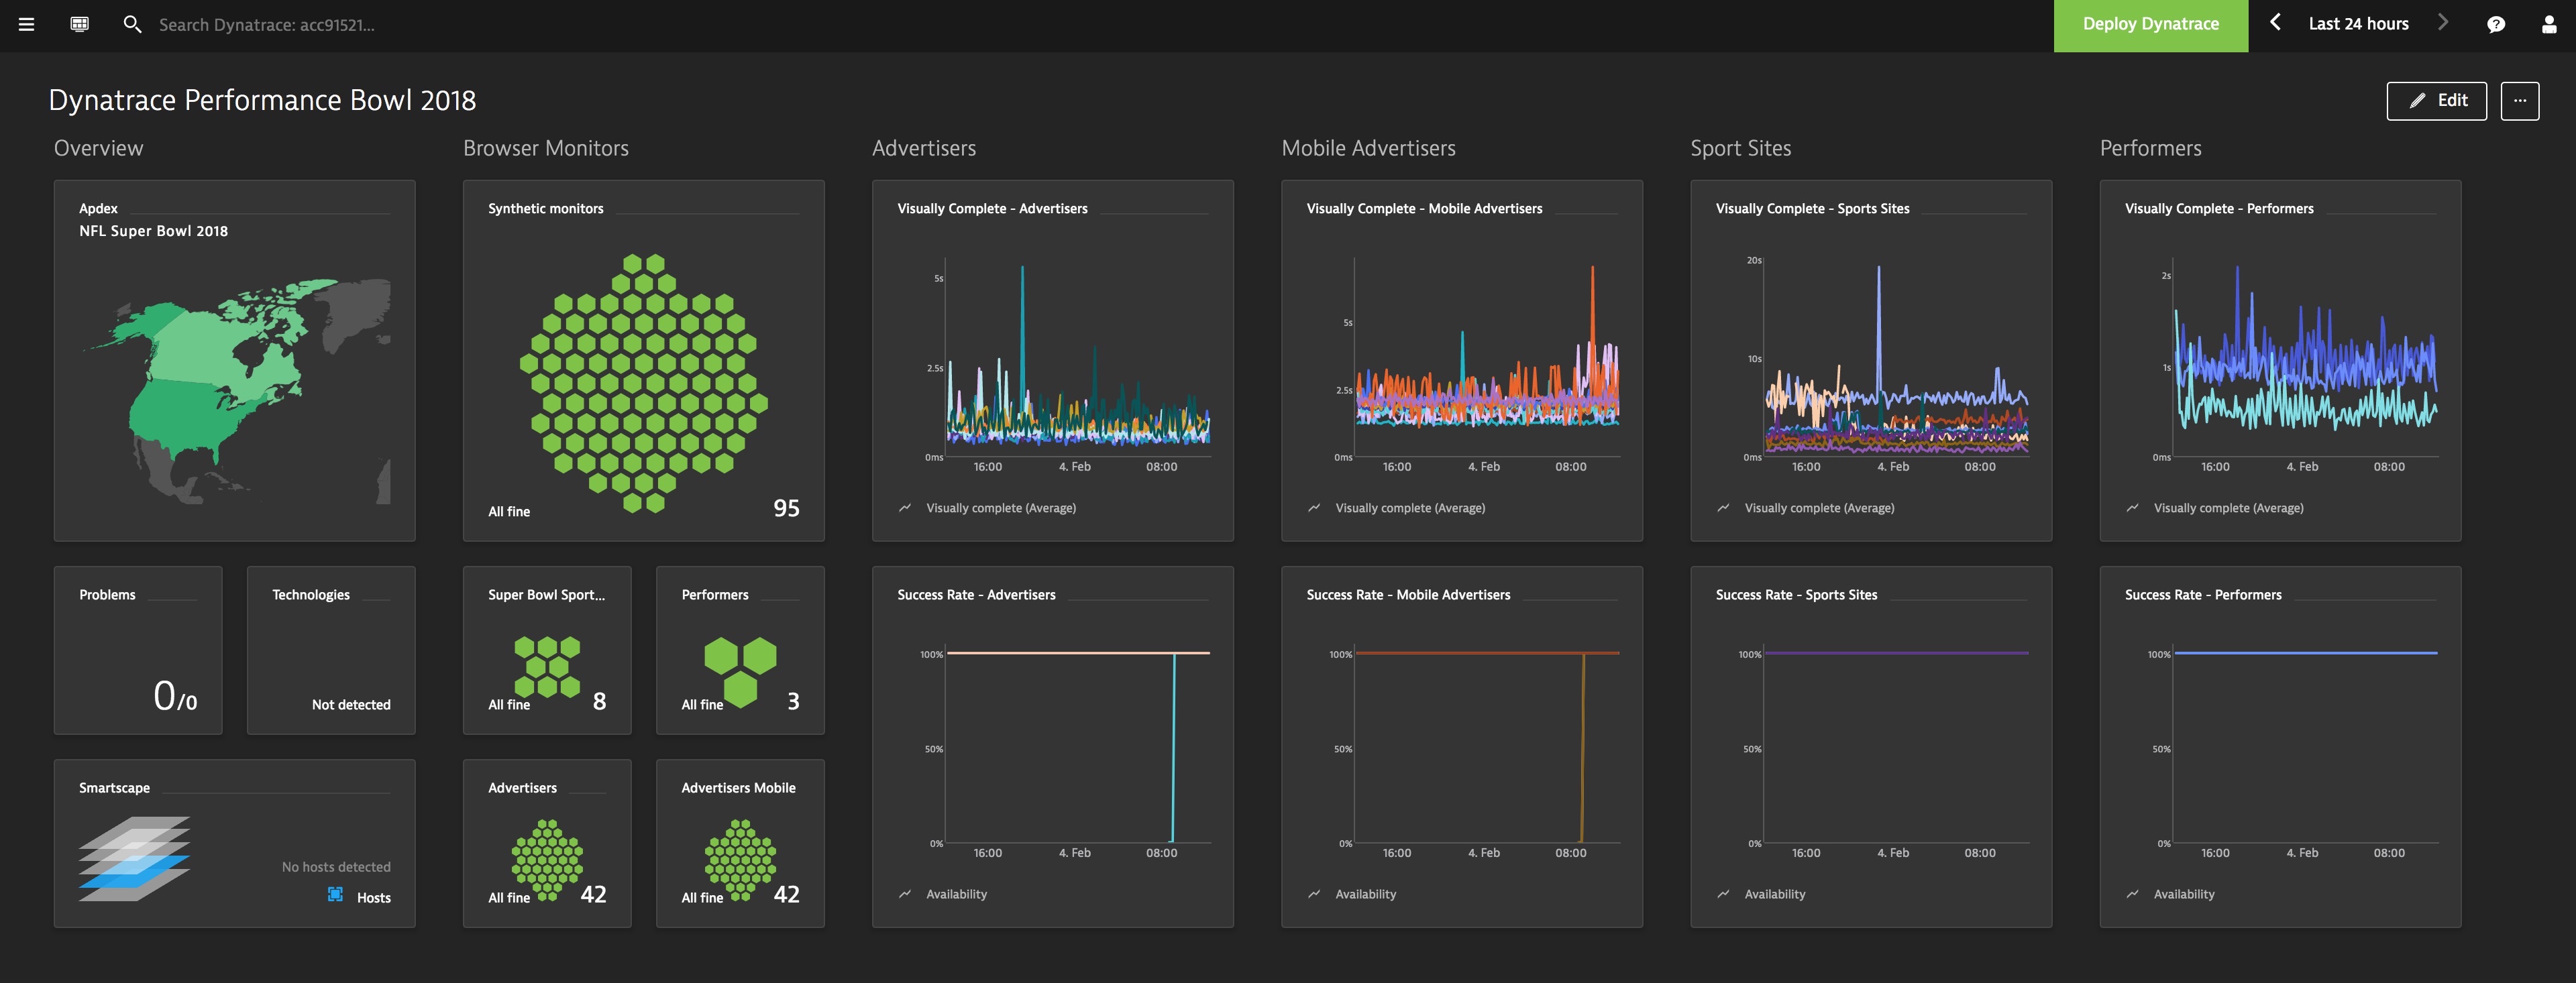
With the Dynatrace AI powering this, finding issues and outliers will mean I can enjoy some of the game coverage this Super Bowl as opposed to keeping my eyes peeled to dozens of dashboards.
How about some Instant Replay?, Feb 4th 1:30pm
For the NFL replay technology has been used since the 80’s and is now an inherent part of the game. Being able to go back and see exactly what the players did during a play changed the way we watch football. After the game the replays became the focal point of what we talked about around the watercooler. But how has this approach translated in the digital world? Sure, there are a couple of vendors who have tried to do this, but the cost to do this for every digital interaction has been for the most part cost prohibitive.
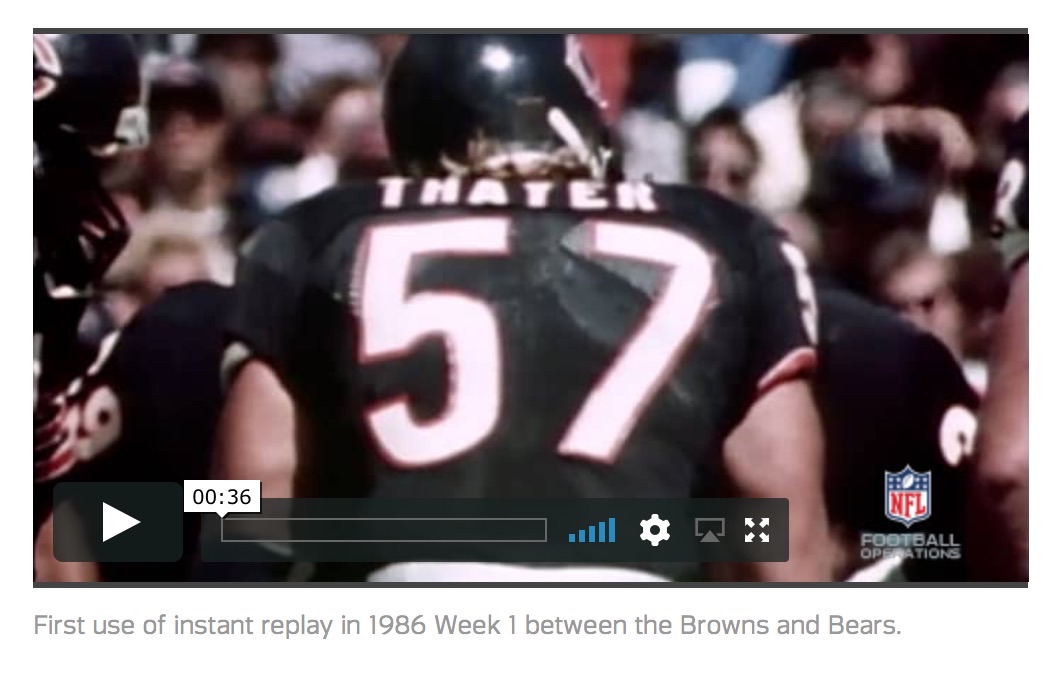
Now the NFL has a 360 replay technology allowing viewers to replay the action from any angle.
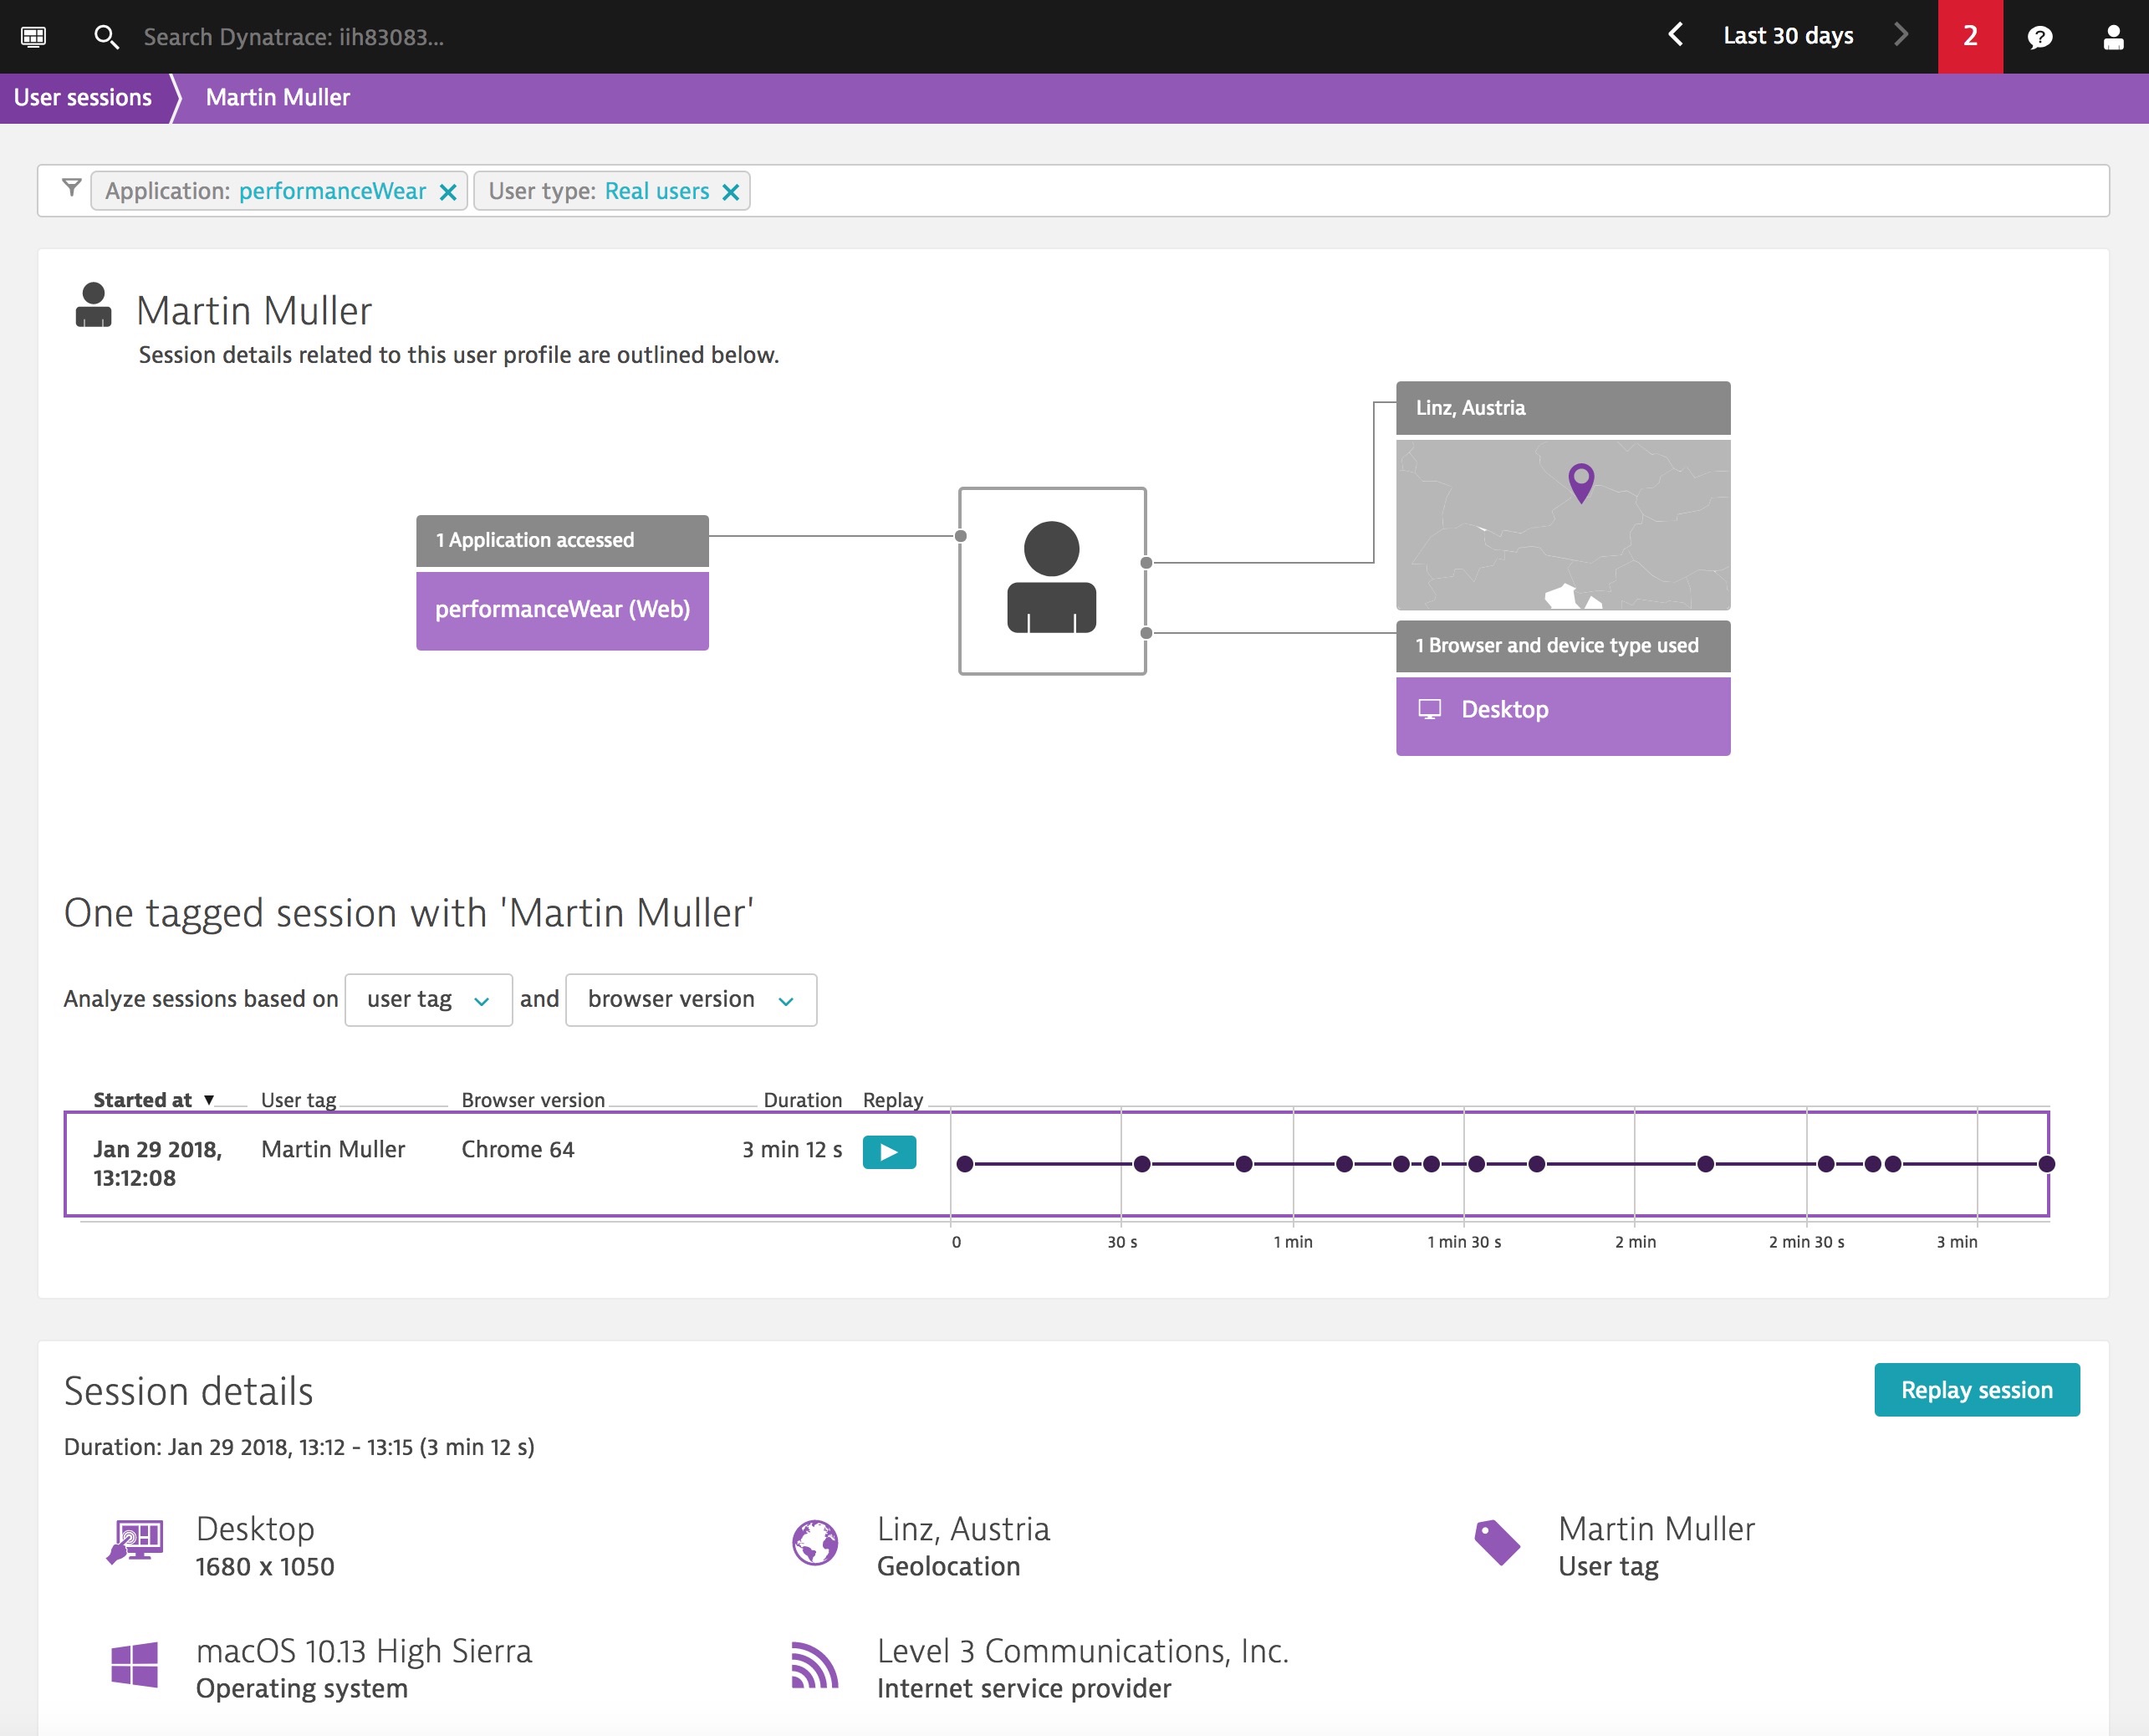
Last week at Perform 2018, Dynatrace announced a new capability to replay a web or mobile web session so that you could see exactly what the consumer/end user was doing during a session and see how the application they were using responded to their user actions. Now is the time for advertisers to be able to easily and cost effectively see and replay user sessions as they drive traffic to their site.
Here is a screenshot of a Dynatrace RUM User Session
And here is a screenshot of what that user saw during that session.
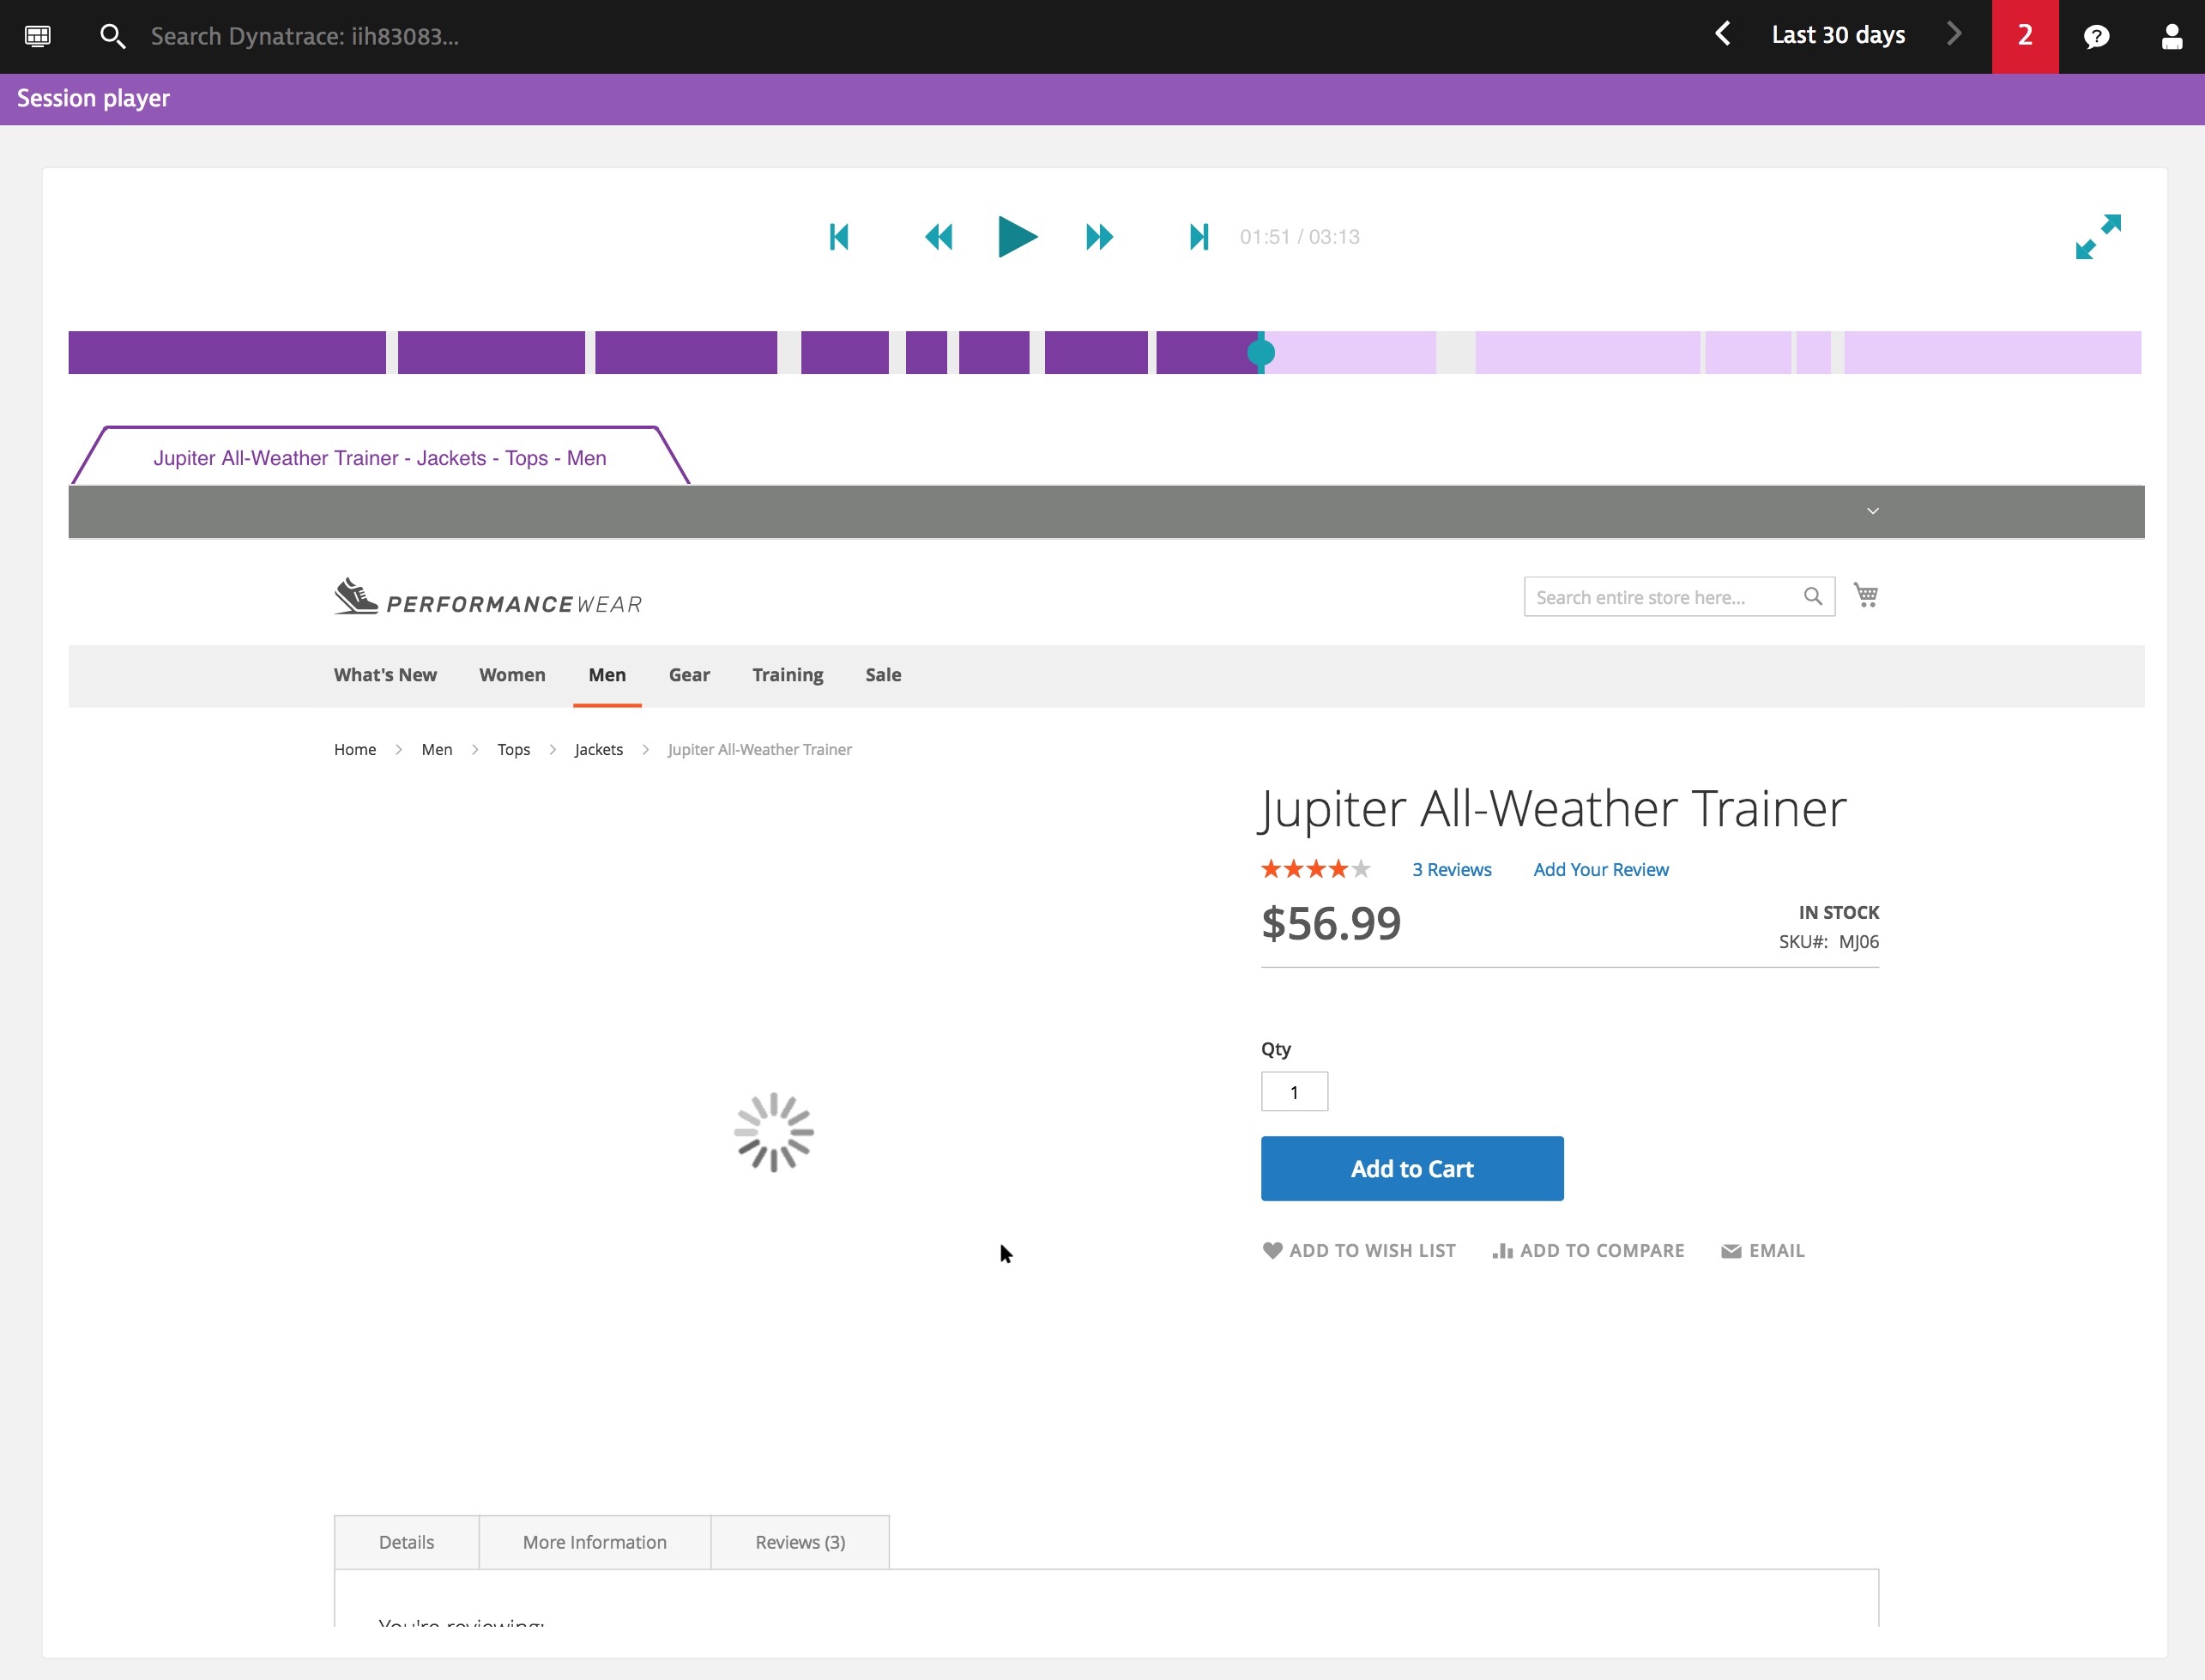
No more guesswork is involved, now not only can you visually see what happened during a session but you can trace that transaction all the way back to the server side calls being made to support it. Like the NFL’s use of replays to manage the game, this is an industry first for Dynatrace.
If you want to find out more about this, feel free to visit here.
The Super Bowl runs on technology, Feb 4th 12:00pm
This is a great article from CIODIVE by Alex Hickey, but it only scratches the surface on the real complexity involved in delivering the SuperBowl to fans and the ads to consumers. Alex reports that last year Extreme Networks logged 11.8 terabytes of data was transferred over networks at the event. That is just the traffic at the venue and doesn’t include the traffic which will be generated today by the millions of viewers watching the game at home.
Here is a tweet showing what the inside of the NFL ops center looks like during the game. There are dozens of applications being used to manage every last detail of broadcasting the game.
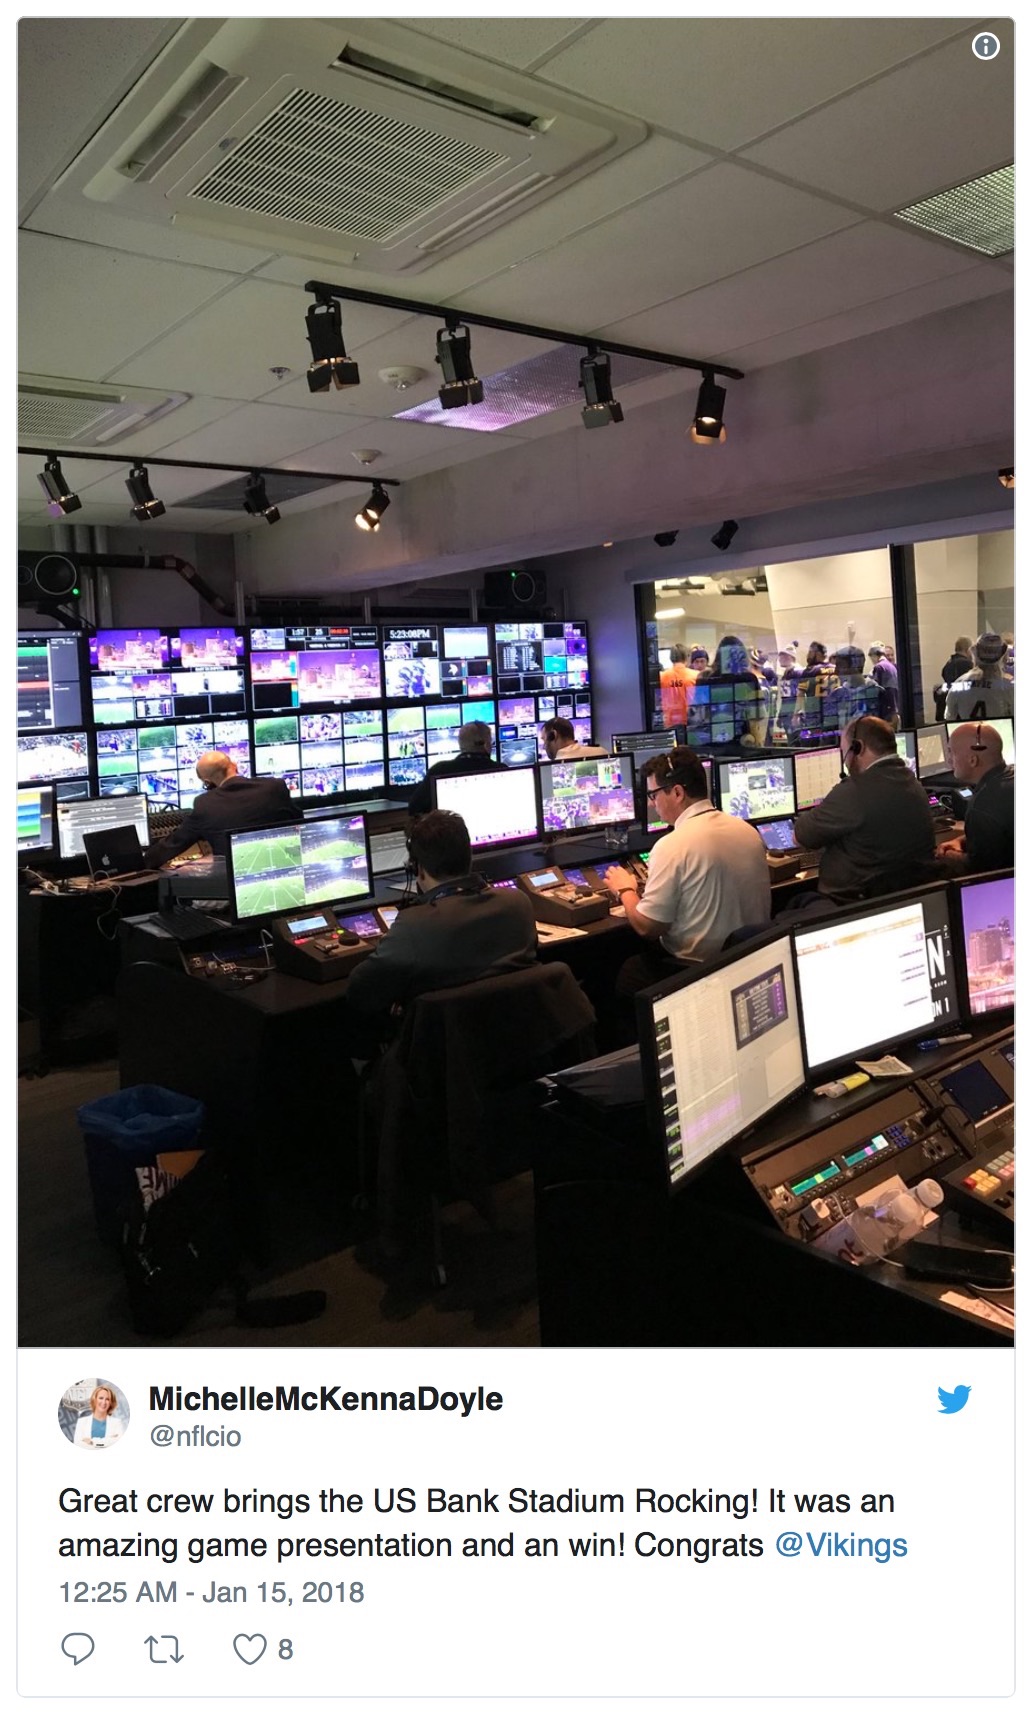
Now imagine operations centers for every broadcaster, every advertiser, every content delivery network, every ad network, etc… To say that the technology investment involved for today’s broadcast is immense is an understatement.
Last year we described the complexity involved in managing the web applications for these advertisers and that in many cases over 80 different technologies have to work perfectly in order for consumers and viewers to receive a satisfactory digital experience.
This is a typical example of a SmartScape which would represent the infrastructure behind the IT systems for any of the advertisers broadcasting today.
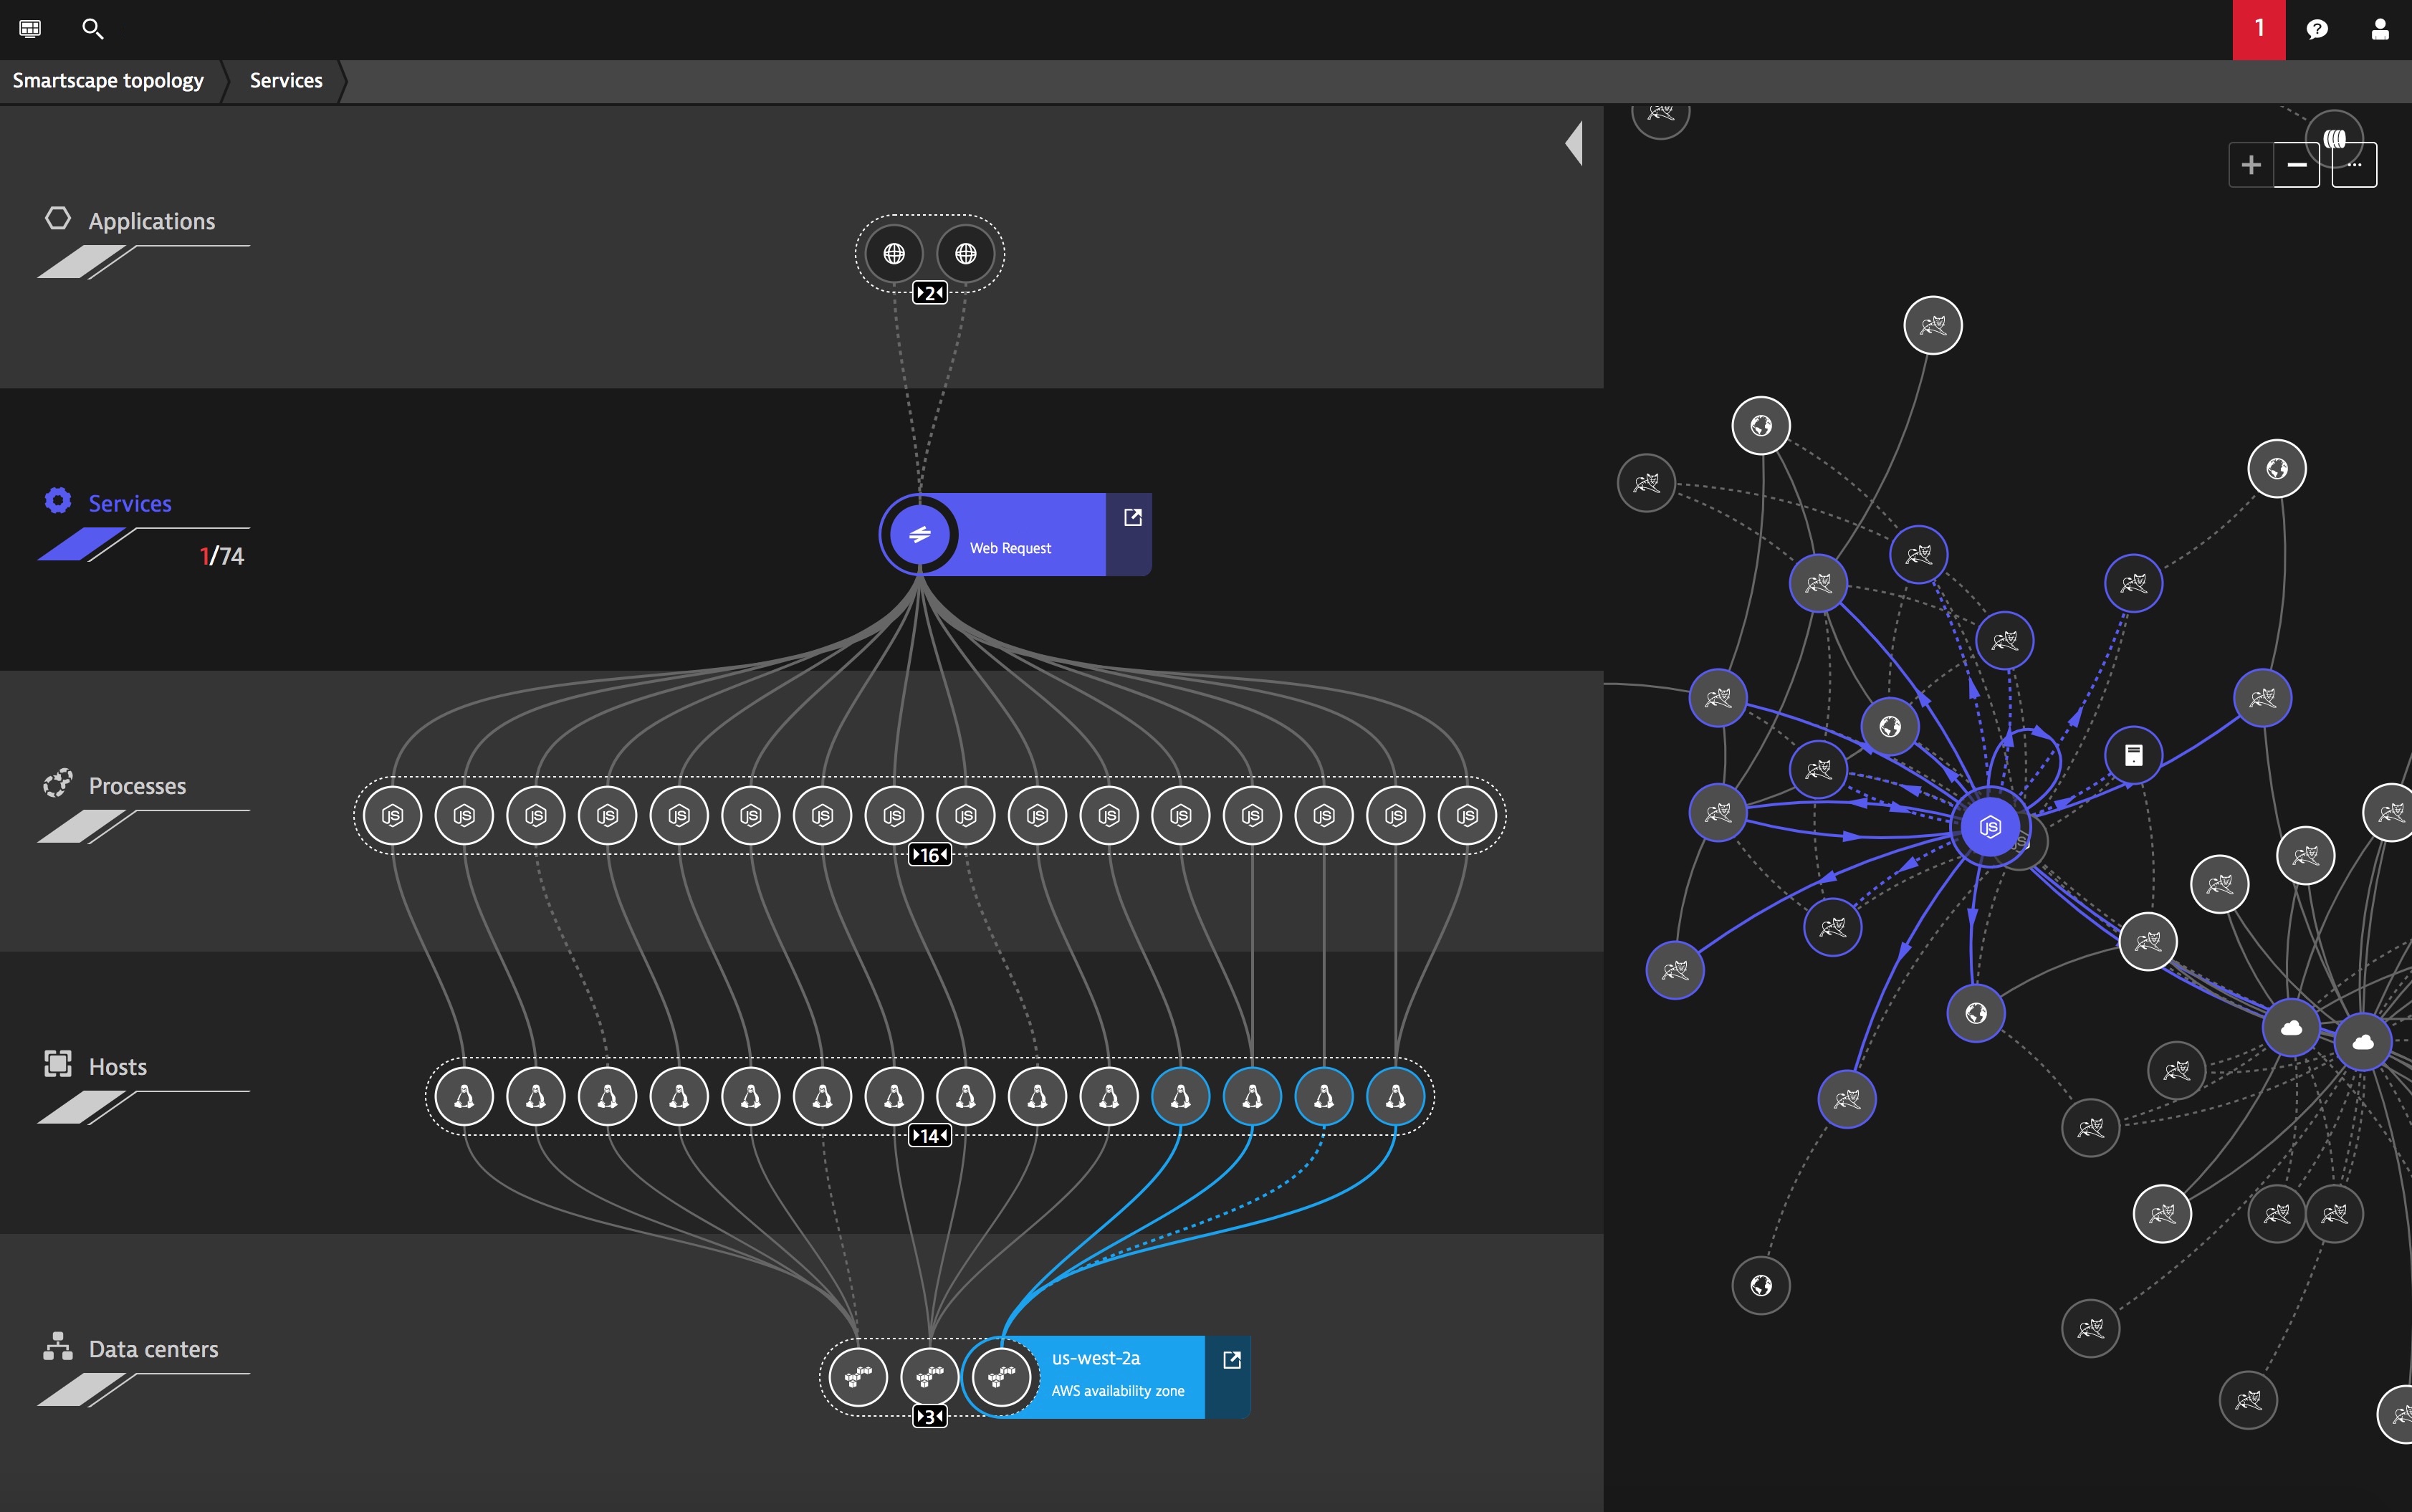
Managing this kind of complexity is pushing the boundaries of what humans can do by simply spending mountains more in terms money, time and infrastructure. Alex says “It takes a village – and a lot of time and money”, but there is a way to make managing some of this easier and more efficient. Investing in Artificial Intelligence is one of the ways to do this. Practical, deterministic AI can be quickly and a easily deployed to automate the management of the systems and infrastructure that all of this runs on. That frees CIOs to allocate scant resources into focusing on innovation to make the viewers and consumers digital experiences better and enhance their Brand. At the same time, this approach protects the investment the CIOs are making by first reducing problems which make their way into production and then being able to create self-healing applications to fix issues which do pop up in production.
New Players and New Plays, Feb 4th 11:15am
This year we are changing some of our players with most of our monitoring being done on the Dynatrace Platform as opposed to Classic Synthetics which we have used in past years. We will be using a combination of Browser Monitors and Real User Monitoring (Dynatrace RUM). The Browser Monitors allow us to run the tests using different device profiles. For example; this year for our mobile tests we will be using an Apple iPhone X device profile in portrait mode with a 4G connection. Some of the advertisers are using Dynatrace RUM this year and that will be providing us some insights into how consumers are accessing their digital channels from both desktop machines, mobile devices and tablets. We are looking forward to seeing that data.
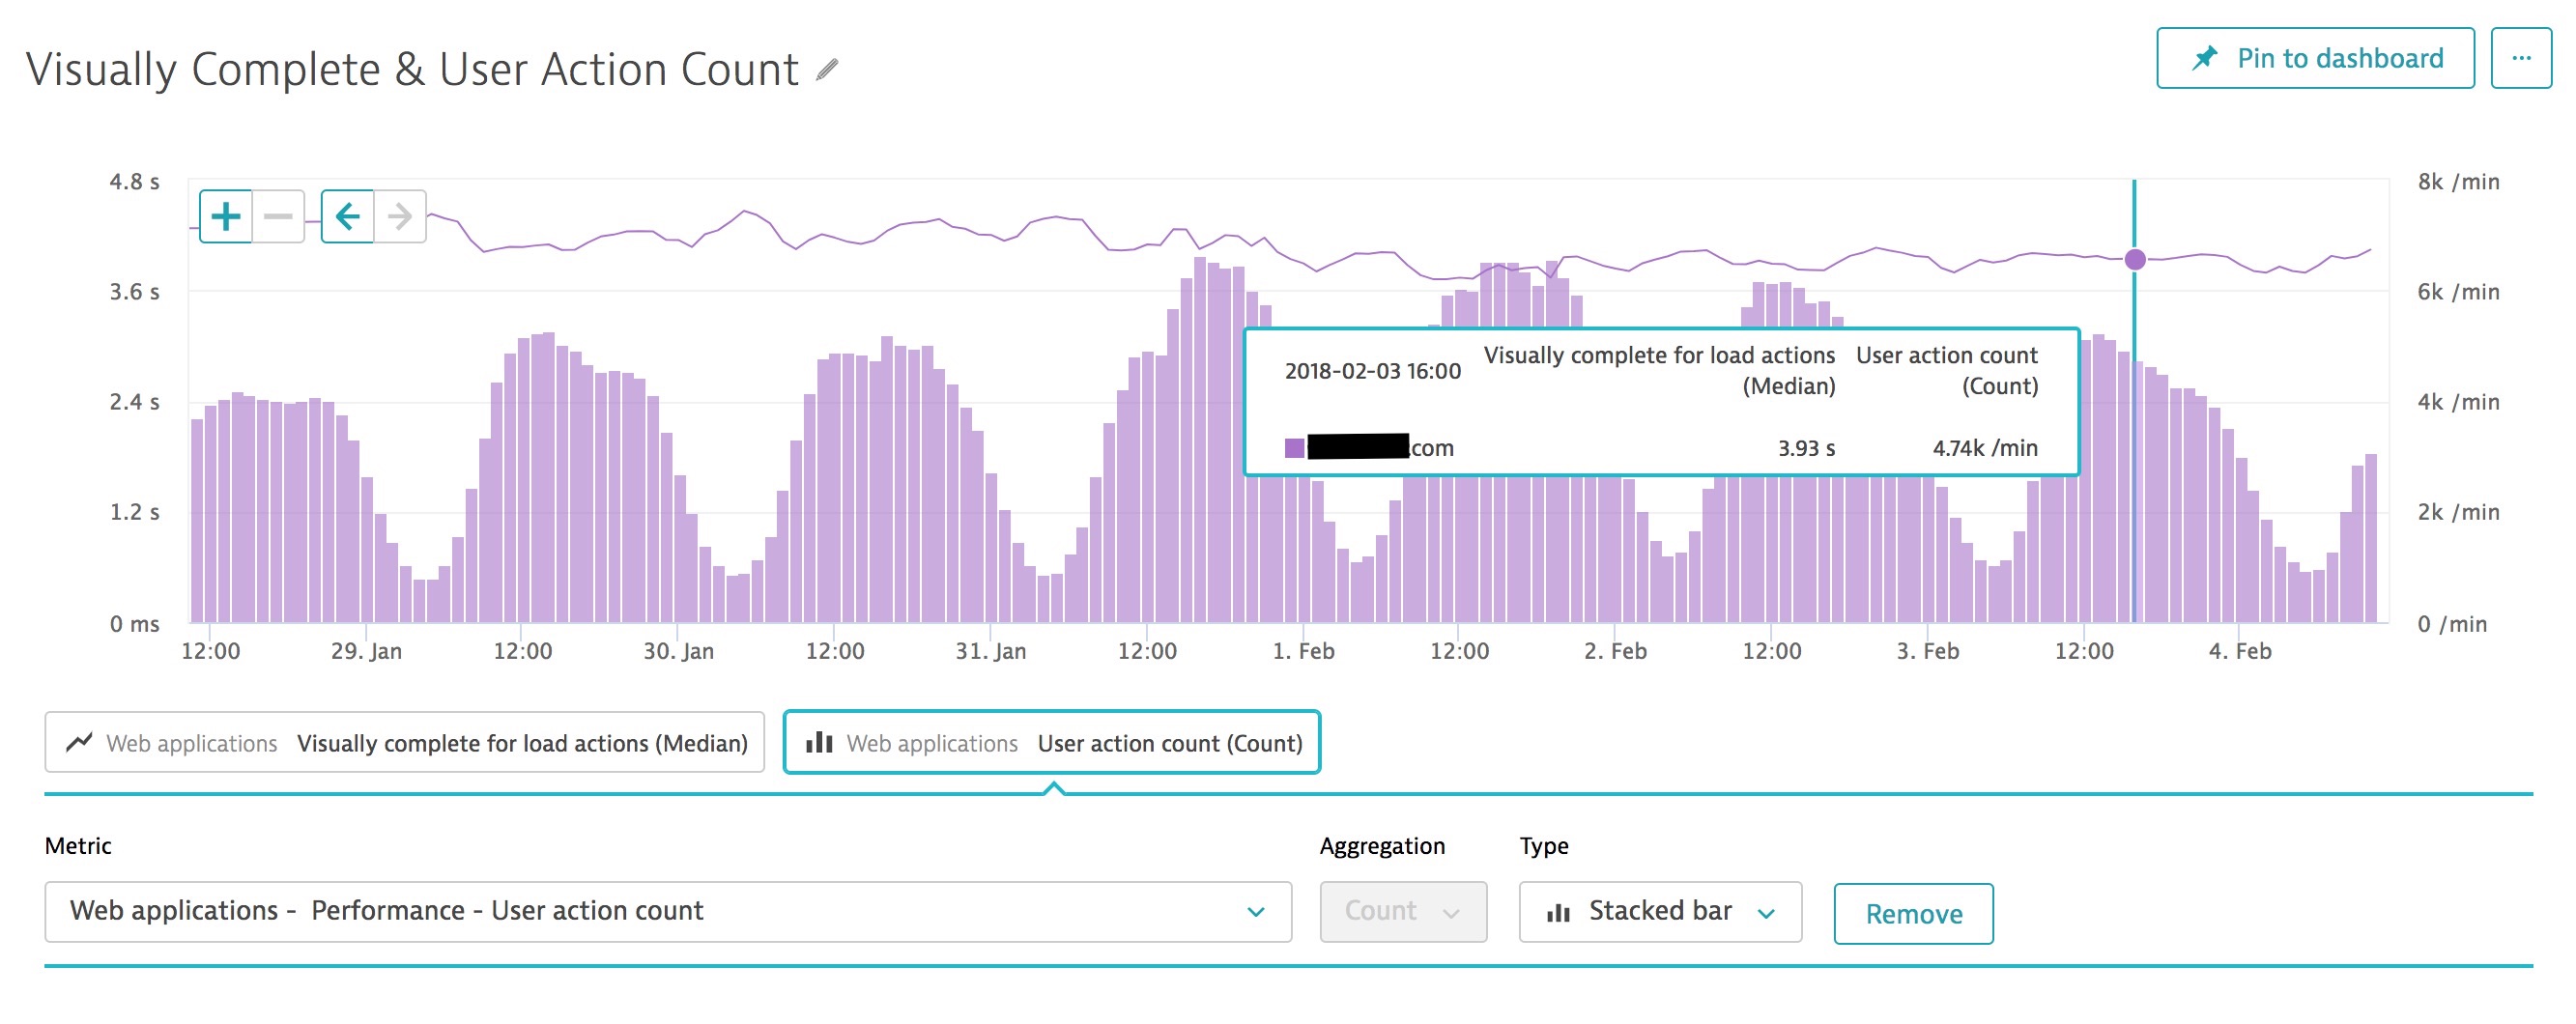
These new players coming on to the field this year will allow us to run and compare some new plays. For example; this year will be the first year we will be comparing advertisers based on their visual complete time. This is the amount of time it takes for the viewable window to complete rendering to the screen, the page may still be loading “below the fold” where you’d scroll but we are only measuring the viewable window. This is the best measure of performance for user experience there is.
One of the other plays this year will be to watch for client side (JavaScript) errors. These errors often go overlooked by most monitoring systems, but the Dynatrace platform allows us to trace end user experience end-to-end including from the client side.
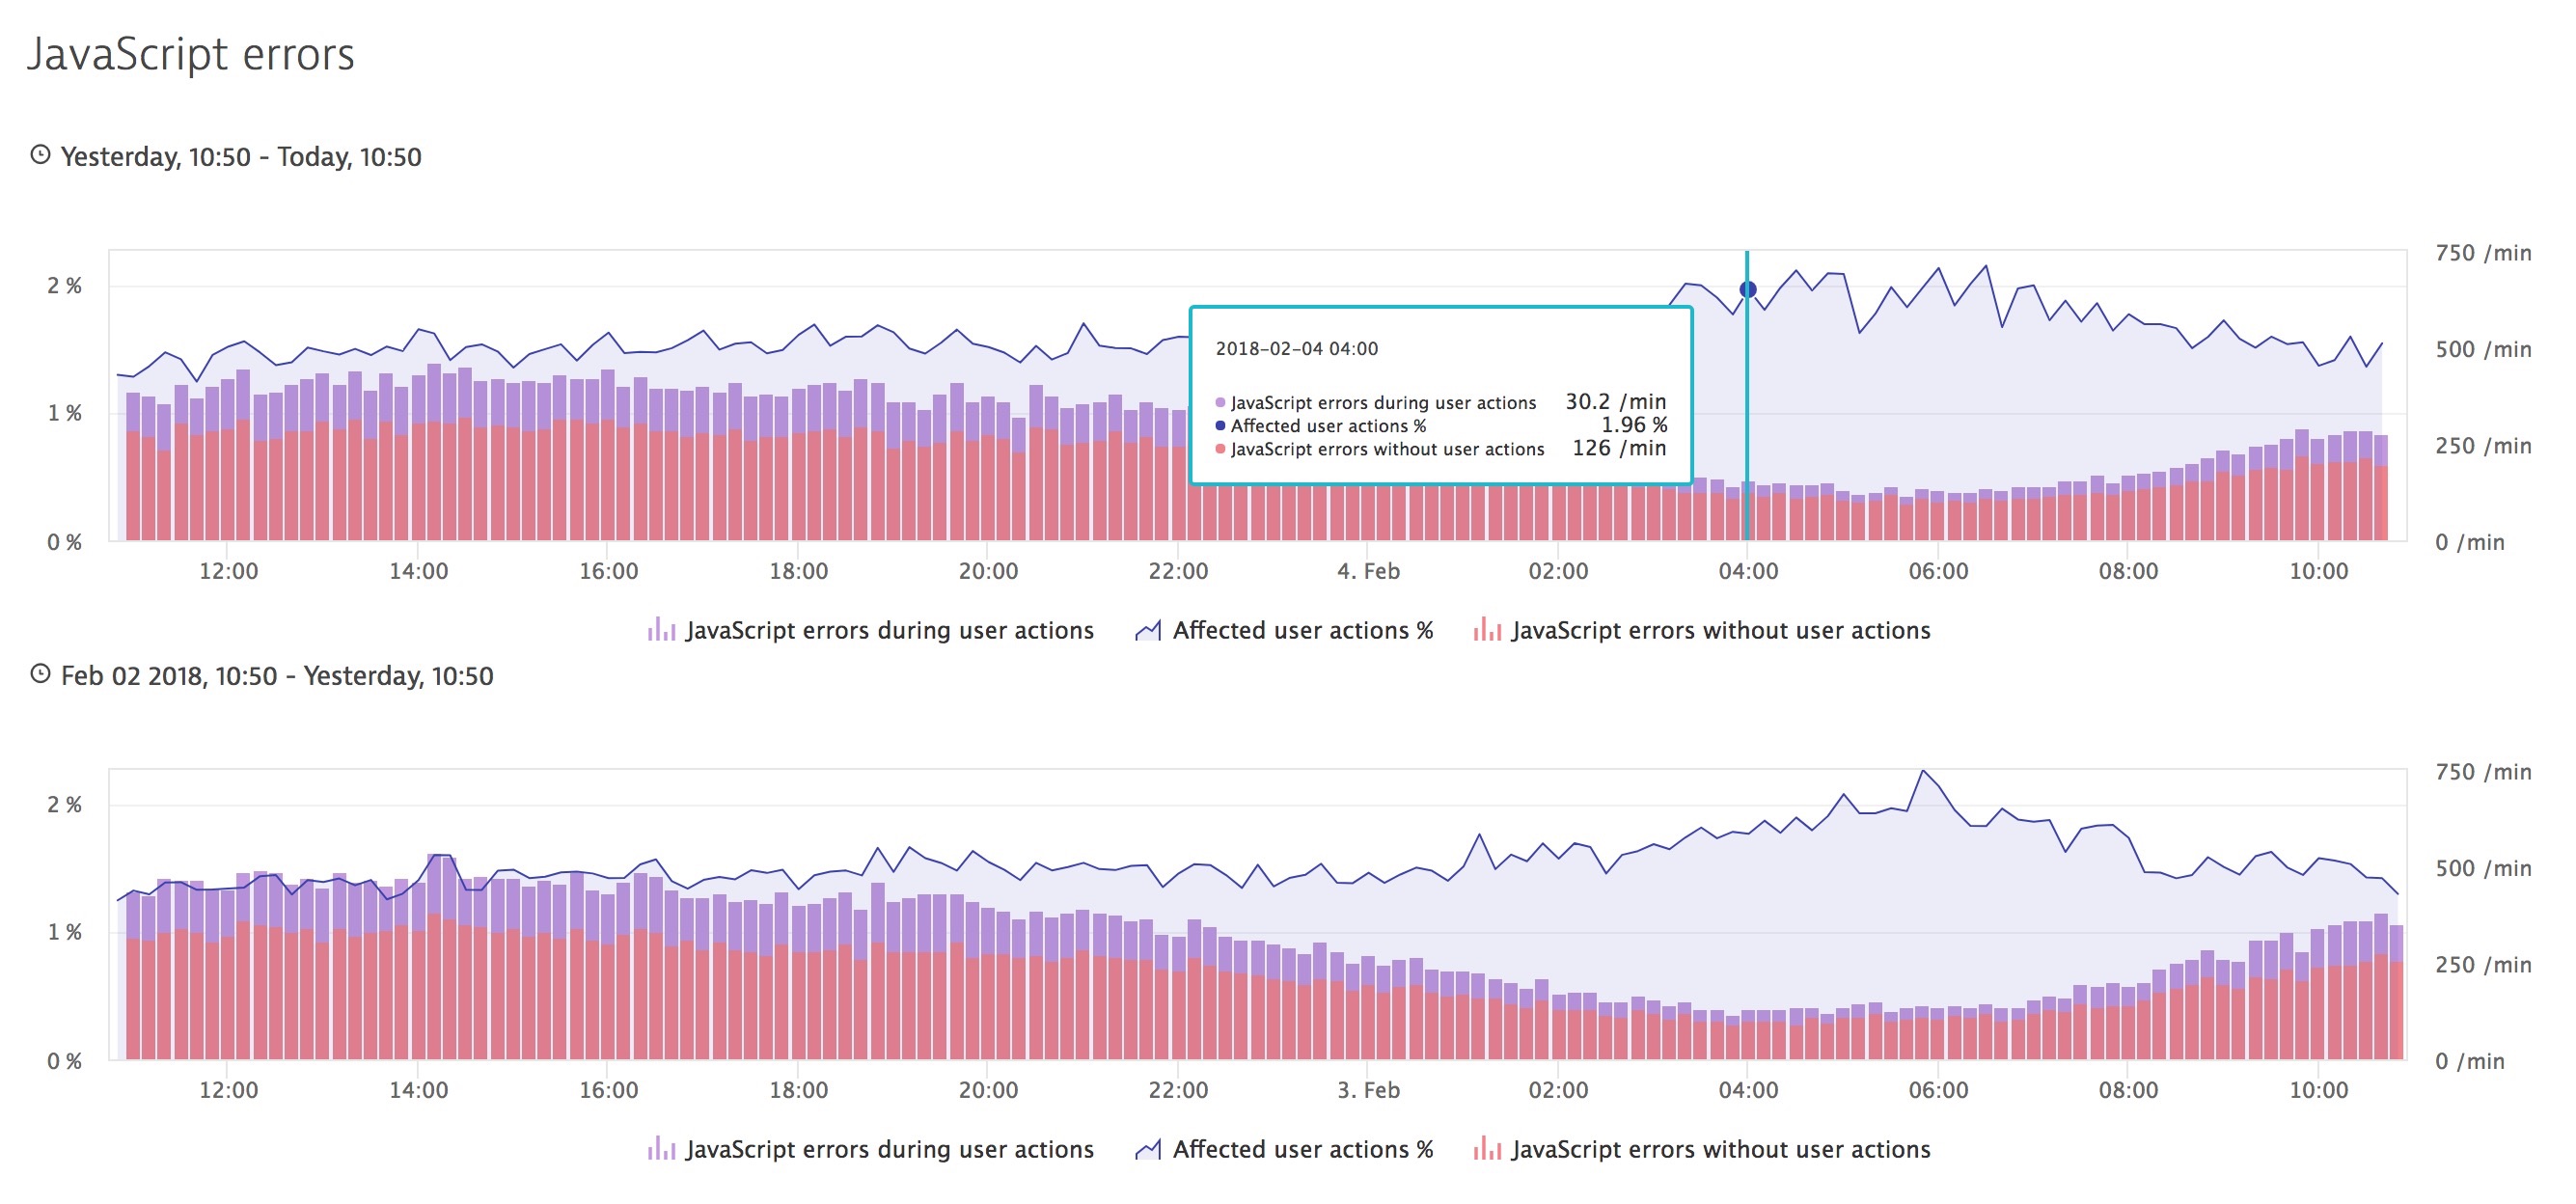
User experience doesn’t end with a single loading of a page and Dynatrace just announced something entirely new to its platform last week at Perform 2018, more on that in a bit.
Who’s advertising this year and what’s at stake, Feb 4th 10:00am
Just like the Patriot’s record breaking 7th appearance, this year we are seeing some advertising stalwarts make appearances again. Avocado’s from Mexico, Budweiser, Kia and more are returning to the Super Bowl. Pringles and Kraft are making first time appearances. We are using Adweek to provide the list of advertisers and have been adding them to our list throughout the week and even adding some new ones this morning.
This brings up a good point, in business being able to pivot and deploy at a moment’s notice is critical. Using platforms like Dynatrace allows our team to get eyes on advertiser’s digital experience in minutes.
As we saw in the playoffs leading up to the Big Game, seconds matter. That holds true for advertisers as well. Consumers will not wait for web and mobile pages to load slowly. Noted web performance guru Ilya Grigorik, showed (in studies from Google) that even after a second of waiting humans are already thinking of something else.
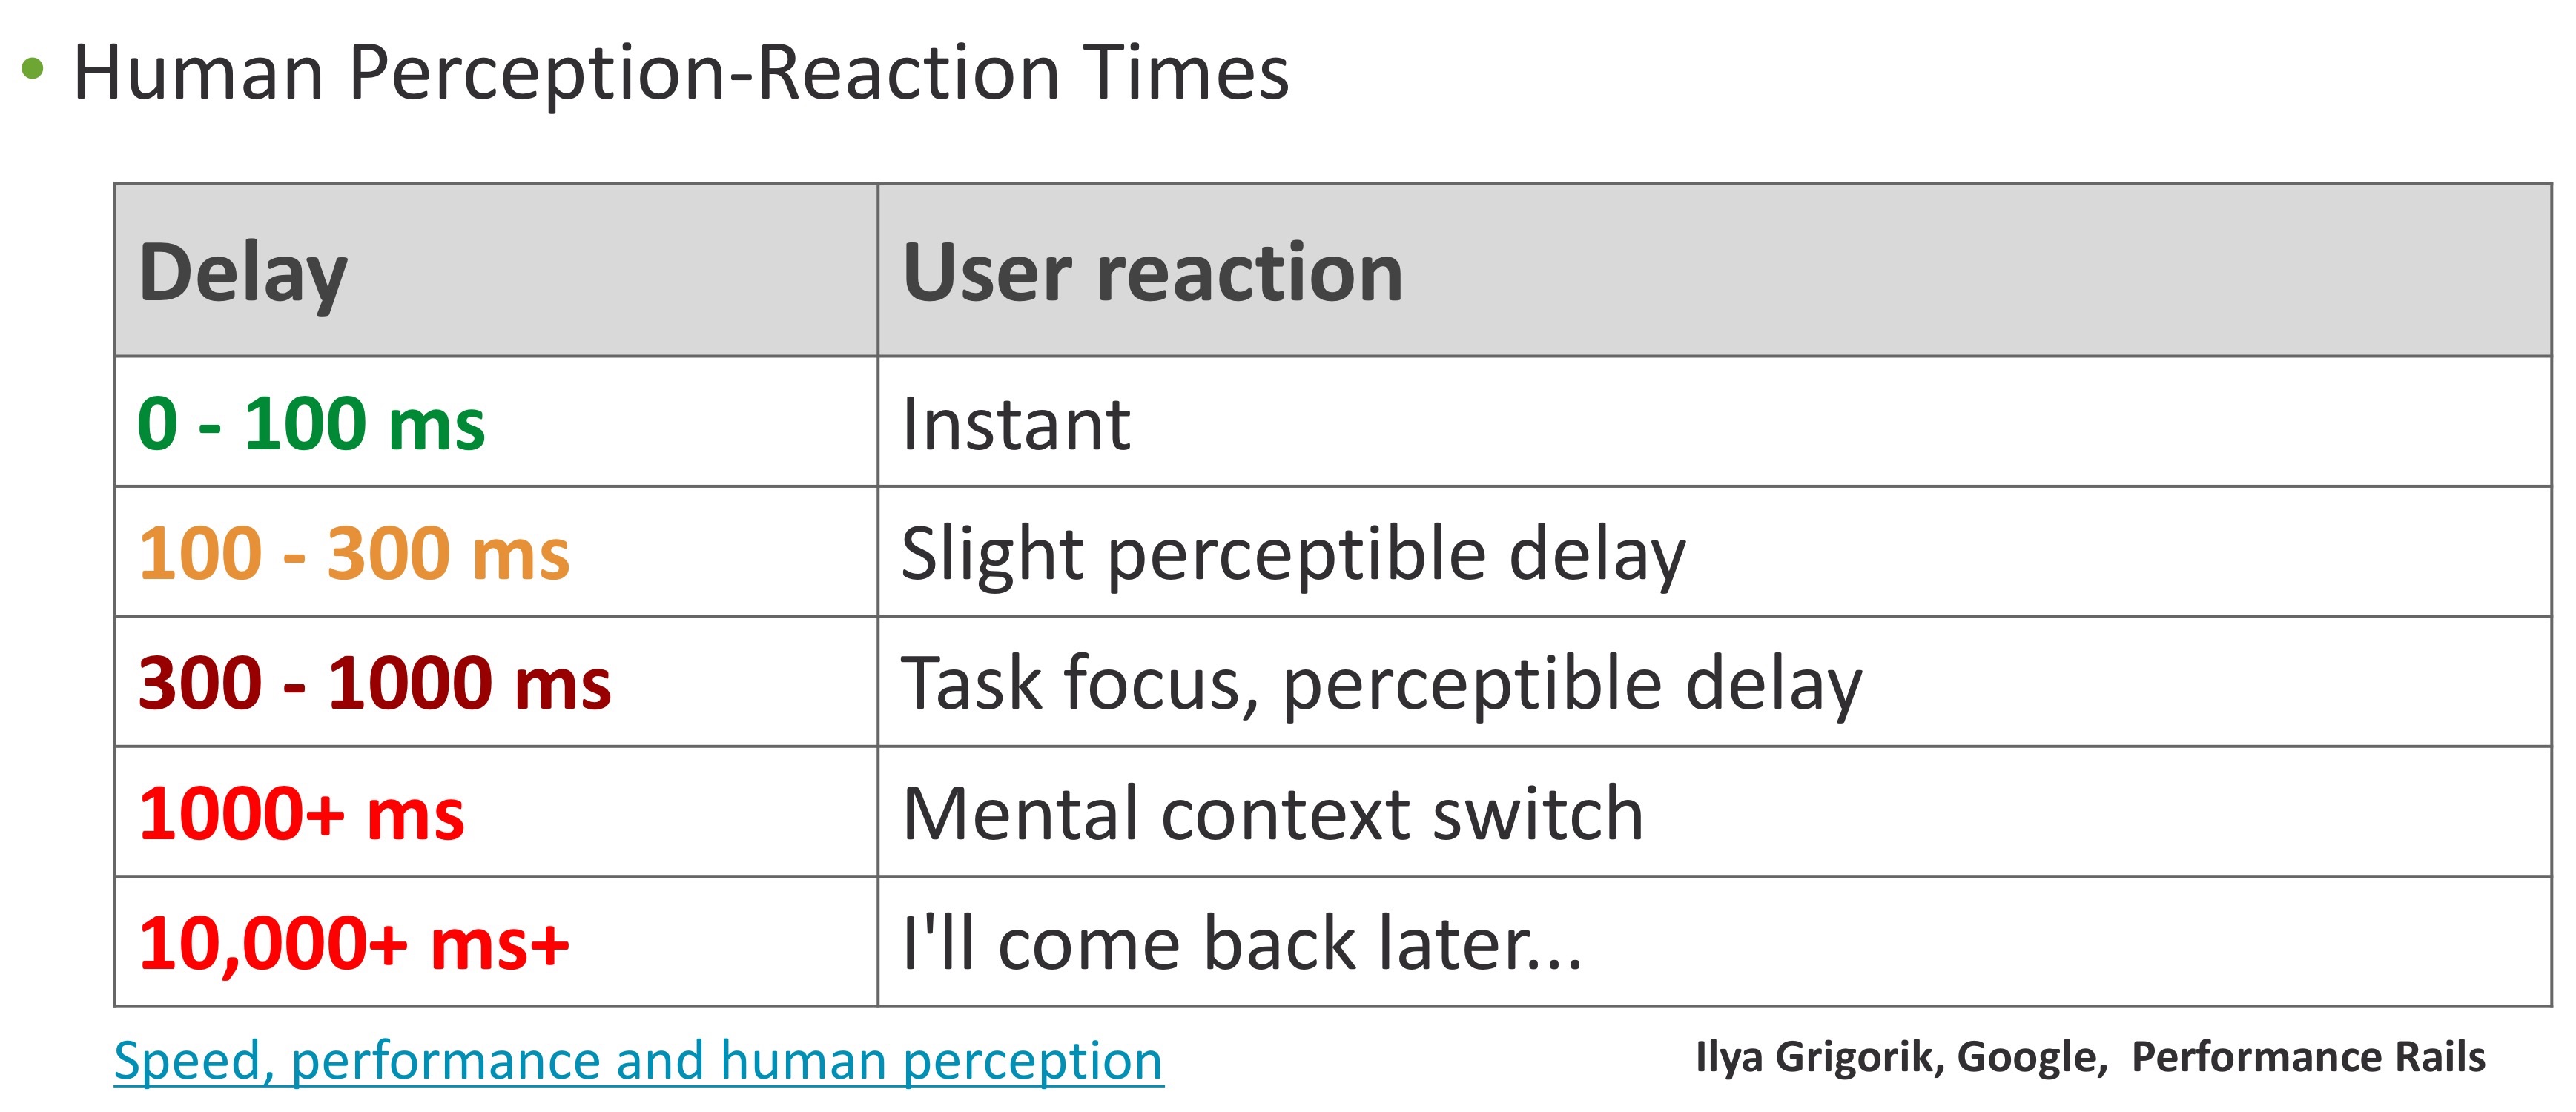
The experience the advertisers provide will help shape how consumers react to their brands. Brands today rely on technology more than ever to communicate with consumers, slow or frustrating experiences reflect poorly on those Brands. Brands which provide fast or good digital experiences are typically rewarded by the fact that the technology between them and the consumer is instant and invisible.
Simply put… Brands are digital experience.
Prepping for the digital tail gate party, Feb 3
We just wrapped up Perform 2018 and now it’s time to focus on this year’s Big Game. We are getting ready for tomorrow’s digital tail gate party where we will show you some details of what we are watching leading up to the big game. This year we have some new players and new plays which we will be using to compare which advertisers are providing the best digital experience during the Big Game.
This years Dynatrace “Performance Bowl” will be tracking the following:
- NFL websites
- Team websites
- Official broadcaster website
- Halftime entertainer websites
- Advertiser websites
- Advertiser mobile websites
We will be tracking these proactively using real browsers running from multiple locations across North America. As we did last year we will be providing a live blog before, during, and after the game. Keep checking in to see how the sites we are tracking are performing.
Last year, reports from Adweek had 30-second spots running $5 million USD, and reports this year are that ads are in the same price range. The ads aired during the Super Bowl represent the advertising brands best creative efforts and are substantial investments. The goal of these ads to is drive brand awareness and after the Super Bowl is over, the most cost effective way for these brands to interact with consumers is via their digital channels. Managing these digital channels is not easy and advertisers continue to struggle to make sure each interaction with their consumers is pushing their ball down the field for a successful conversion.


Looking for answers?
Start a new discussion or ask for help in our Q&A forum.
Go to forum