
Dynatrace introduced the Dynatrace Operator, built on the open source project Operator Framework, in late 2018. The Dynatrace Operator enables the deployment, configuration, maintenance, and upgrade of Dynatrace full stack observability in Kubernetes and Red Hat OpenShift clusters.
We’re delighted to share that IBM and Dynatrace have joined forces to bring the Dynatrace Operator, along with the comprehensive capabilities of the Dynatrace platform, to Red Hat OpenShift on the IBM Power architecture (ppc64le). IBM Power servers enable customers to respond faster to business demands, protect data from core to cloud, and streamline insights and automation. By leveraging the Dynatrace Operator and Dynatrace capabilities on Red Hat OpenShift on IBM Power, customers can accelerate their modernization to hybrid cloud and increase operational efficiencies with greater visibility across the full stack from hardware through application processes.
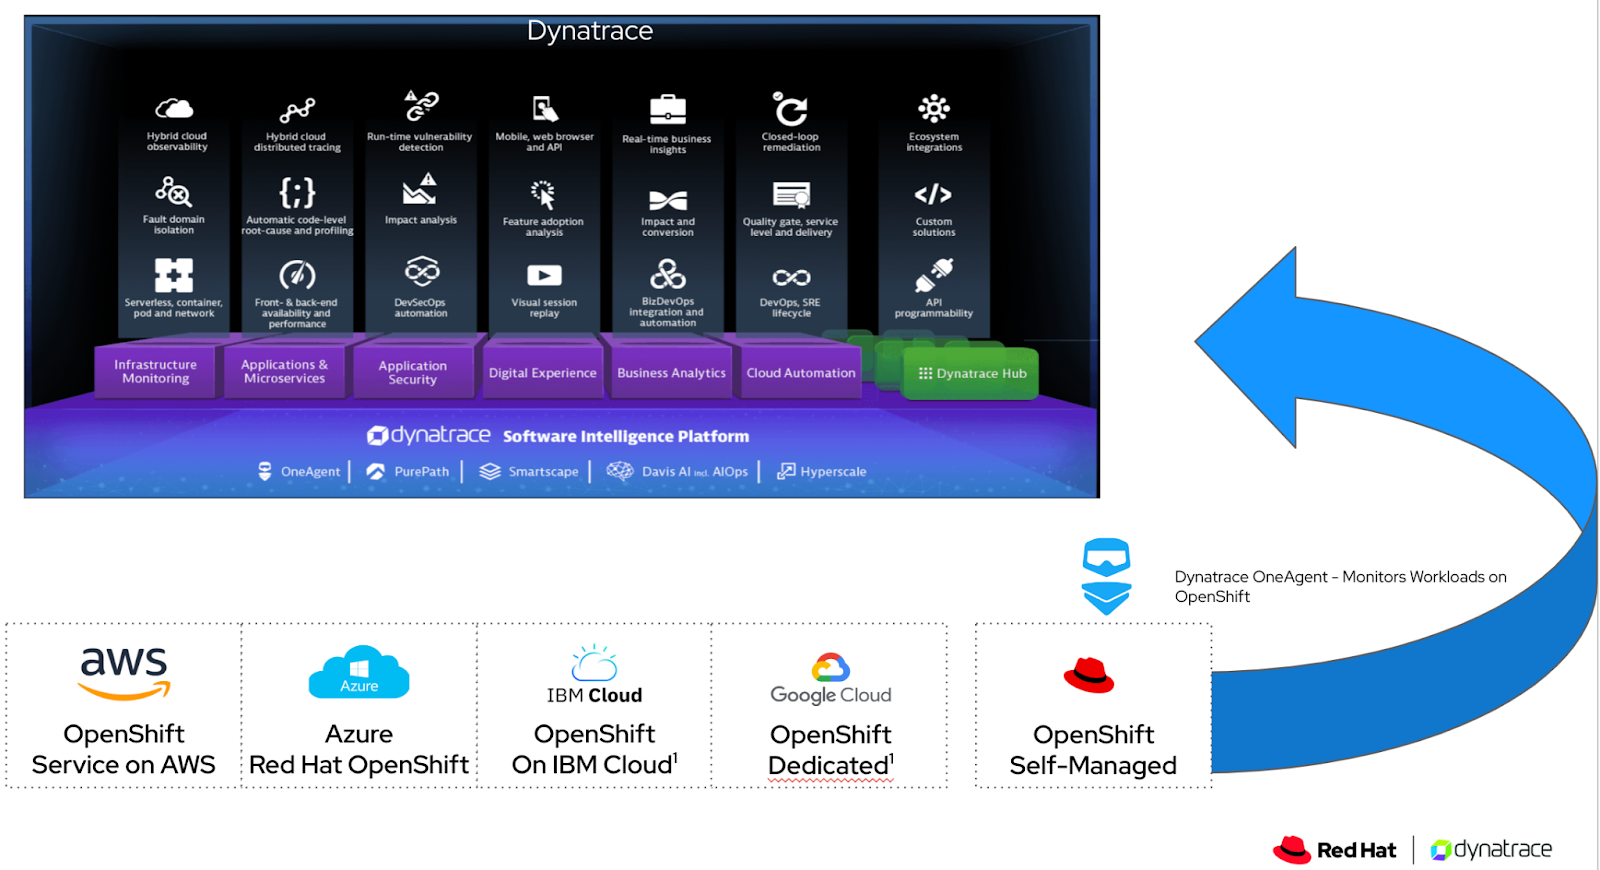
Dynatrace full stack Red Hat OpenShift observability
Dynatrace unifies platform engineering and application teams on a single platform, enhancing software quality and operational efficiency to drive innovation. Red Hat OpenShift monitoring with Dynatrace stands out due to the following key aspects:
- Infrastructure health monitoring and optimization: Assess the status of your infrastructure at a glance, understand resource consumption, optimize resource allocation for cost-efficiency, and track software versions running within the Kubernetes environment.
- Full stack observability: Gain comprehensive observability across the entire stack, including Kubernetes clusters, applications, and underlying infrastructure. Captures metrics, traces, logs, and other telemetry data in context. Additionally, Dynatrace integrates seamlessly with cloud-native technologies and services, such as Istio and Prometheus, further enhancing its monitoring capabilities.
- Smartscape topology mapping: Dynatrace uses its Smartscape technology to semantically map metrics, traces, logs, and real user data to specific Kubernetes objects, including containers, pods, nodes, and services. Having all data in context tremendously simplifies analytics and problem detection.
- Intelligent root cause analysis: Use Davis® AI to automatically detect and analyze performance issues across the entire tech stack. Davis can identify problematic components or configurations and provide insights into the root cause of issues, enabling faster troubleshooting and resolution.
- Scalability and cloud-native support: Dynatrace is designed to scale effortlessly in dynamic Kubernetes environments. Supporting GitOps practices, it can handle large-scale deployments with thousands of nodes and containers, making it suitable for enterprise-grade Red Hat OpenShift monitoring.
“Dynatrace offers a trusted and certified solution for monitoring applications running on Red Hat OpenShift using AI-powered root-cause analysis. Combining Dynatrace’s insights with Red Hat OpenShift, the industry’s leading hybrid cloud application platform powered by Kubernetes, allows organizations to more easily run decoupled services and applications, which can be a monitoring nightmare.”
Chris Morgan – Senior Director, Customer & Field Engagement, Red Hat Hybrid Platforms
Dynatrace Operator for OneAgent, API monitoring, routing, and more
The Dynatrace Operator leverages Kubernetes’ native capabilities to automate the deployment, configuration, and lifecycle management of Dynatrace components within Kubernetes environments. It simplifies the process of setting up and maintaining Dynatrace observability by encapsulating the necessary configuration and operational logic into a single entity.
The Operator acts as an intelligent controller that understands the desired state of the Dynatrace monitoring environment and takes actions to achieve the desired state. It automates tasks such as provisioning and scaling Dynatrace monitoring components, updating configurations, and ensuring the health and availability of the monitoring infrastructure.
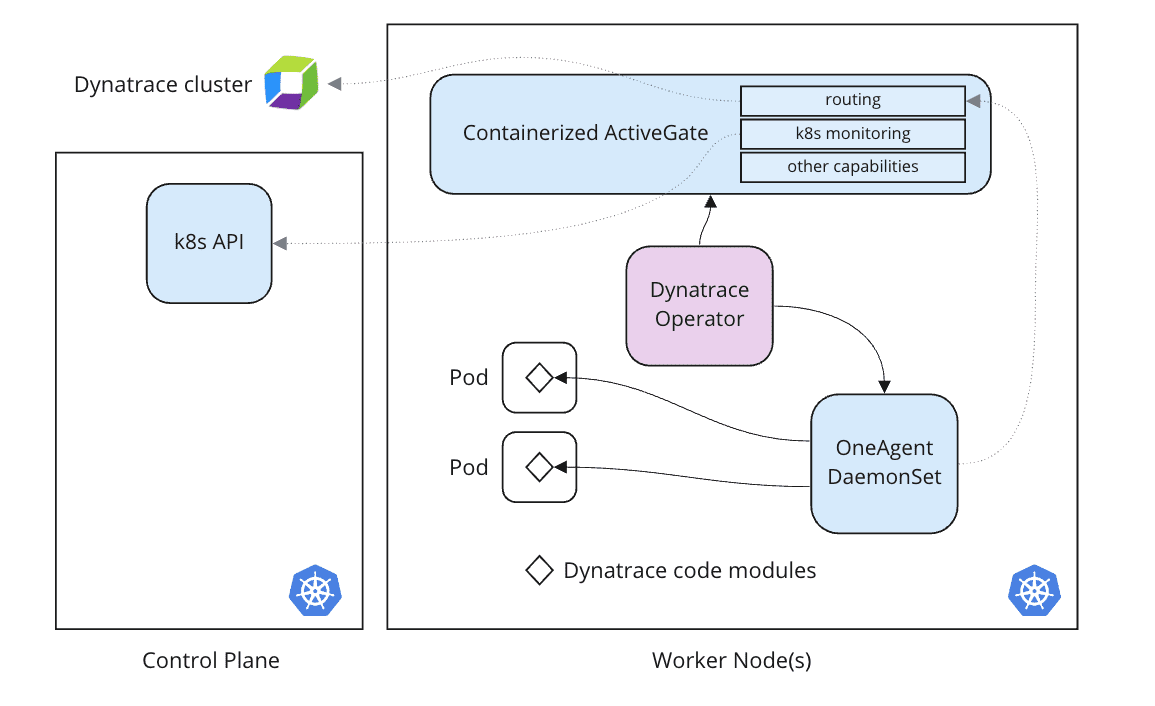
The Dynatrace Operator deploys and auto-configures the following resources:
- OneAgent, deployed as a DaemonSet, collects host metrics from Kubernetes nodes. It also detects new containers and injects OneAgent code modules into application pods.
- Dynatrace ActiveGate is used for routing, as well as for monitoring Kubernetes objects by collecting data (metrics, events, status) from the Kubernetes API.
- Dynatrace webhook server validates Dynakube definitions for correctness.
With this approach:
- Red Hat OpenShift infrastructure (control plan and worker nodes) and workloads are instrumented automatically without any manual code change.
- The scope of the automatic workload instrumentation is user configurable, for example, by namespace.
- Lifecycle management of Dynatrace components (ActiveGate, OneAgent) is automatic and secure.
“With Dynatrace, customers can leverage comprehensive, full-stack observability as they modernize applications with Red Hat OpenShift on IBM Power. These features can enable customers to take full advantage of the excellent performance of containerized workloads on IBM Power, optimizing resource utilization for maximum efficiency.”
Gina King – Director ISV Ecosystem and Alliances, IBM
Get Started with monitoring Red Hat OpenShift on IBM Power
- If you’re already a Dynatrace customer, refer to our updated Kubernetes deployment instructions.
- New to Dynatrace? Sign up for a fully-functional Dynatrace free trial.
Please reach out to the following contacts for additional insights and information.
Dynatrace
Tim Stensby, Senior Manager, Strategic Alliances
tim.stensby@dynatrace.com
Red Hat
Mark Vincent
mvincent@redhat.com
IBM
Sara Cohen
cohends@us.ibm.com


Looking for answers?
Start a new discussion or ask for help in our Q&A forum.
Go to forum