
As organizations embrace cloud-native transformation, Kubernetes has become the backbone of modern application deployment and management. However, the complexity and distributed nature of these environments pose significant monitoring challenges. Traditional tools fall short, leading to limited visibility, data silos, and prolonged issue resolution times. Dynatrace addresses these challenges with its end-to-end unified observability platform, offering comprehensive monitoring capabilities that ensure optimal performance and proactive issue resolution. By integrating telemetry data from various sources and leveraging AI-driven insights, Dynatrace simplifies log management, enhances developer observability, and automates workflows, empowering organizations to efficiently monitor their Kubernetes environments and ensure optimal performance.
With the wave of cloud-native transformation that’s been sweeping across the software industry in the past few years, Kubernetes has emerged as the backbone of modern application deployment and management.
However, as systems have evolved, traditional approaches to monitoring have struggled to keep up. To fill this gap, technologists have designed new tools and practices especially for modern, cloud-native environments. However, all this tooling and new workflows come with their own unique challenges.
Organizations now find themselves not only navigating the inherent complexities that come with the distributed nature of Kubernetes, but they’re doing it with a lack of unified data across their entire stack, especially when working in multi-cloud environments. Limited visibility into applications, a lack of full context, and data silos from multiple tools hinder their ability to get a comprehensive view of their systems and applications.
This is where the need for a unified platform becomes crucial, one that provides engineers with a full end-to-end view of their containerized applications, ensuring optimal performance, reliability, and proactive issue detection and resolution. Advanced monitoring capabilities, such as Dynatrace Kubernetes monitoring, are critical in achieving this performance.
The one-stop-shop for all Kubernetes observability needs
Dynatrace provides unparalleled end-to-end visibility across your entire Kubernetes stack. Gone are the days of gaps in visibility, lack of contextualized data, data silos, long resolution times, and inadequate context and alerts.
With Dynatrace Kubernetes monitoring, engineers gain unified observability across all their environments, the ability to drill down to pinpoint an issue, AI-driven insights, real-time data, and more.
We haven’t even discussed the best part yet, though. All of this is done end-to-end by utilizing the full power of the entire Dynatrace platform.
Dynatrace Kubernetes monitoring: End-to-end observability of your Kubernetes stack
End-to-end monitoring means having full visibility into every aspect of applications, from code and services to performance metrics. This awareness allows teams to quickly identify and resolve application issues, optimize performance, automate processes, and ensure a smooth user experience.
Dynatrace provides these capabilities in multiple ways.
Platform visibility
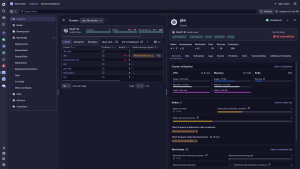
The Kubernetes application easily provides a comprehensive view of your entire Kubernetes inventory and the ability to drill down into individual clusters to eliminate blind spots. In a single view, engineers can easily see out-of-the-box health signals and resource indicators (including alerts), and easily explain warning signals, so they have real-time insights into the entire Kubernetes estate for easy and quick issue resolution.
Integrated observability
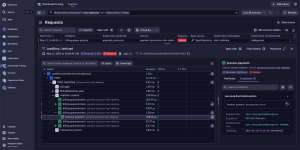
Dynatrace unifies telemetry data from all sources, including third-party data, providing a consolidated view of traces, metrics, and logs on a single platform. This integrated approach extends and adds value to the OpenTelemetry framework. With integrated observability, users gain deeper insights into application behavior and readily identify performance bottlenecks. Teams can monitor the golden signals—latency, traffic, errors, and saturation—to better understand the health and performance of applications in real-time. This allows teams to quickly pinpoint issues, leverage predictive AI-powered analysis, and ultimately ensure applications are running smoothly and efficiently across their entire Kubernetes stack.
AI-powered insights
The engine behind Dynatrace Kubernetes monitoring is Davis® AI, which is built into the Dynatrace platform. Davis redefines ‘modern monitoring’ by taking the guesswork out of troubleshooting. It detects anomalies and potential issues in real-time, providing proactive alerts before they become critical. Davis AI goes beyond alerting by performing data deep dives to pinpoint the exact cause of issues. This comprehensive analysis bubbles up the most important warning signals teams need to be aware of and provides clear, actionable insights to help users understand and resolve issues efficiently.
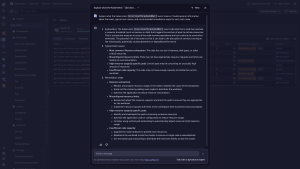
With the integration of Davis CoPilot™, teams can go a step further and navigate complex Kubernetes environments with confidence. CoPilot acts as a contextual guide to help teams of all levels understand Kubernetes-native concepts by explaining them in plain language and offering deeper insights into root cause and remediation options.
Log Management
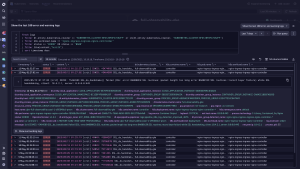
Logs are critical sources of insight into Kubernetes environments. With Dynatrace, logs are centralized, easily accessible, and connected with other signals from your Kubernetes environments to allow speedy troubleshooting and effective monitoring. For instance, you can inspect and understand logs from crashing application containers and other workloads using the Dynatrace Kubernetes app. With Notebooks and DQL, you can analyze log data alongside traces and Kubernetes topology. For security issues and data forensics, Dynatrace supports evidence-based investigations. Metrics and events can be derived from logs for dashboarding and prediction, automating remediations with log data in the Workflows app, and manually exploring surrounding logs and patterns using Dynatrace Logs.
Observability for Developers
The widespread adoption of Kubernetes has made it easier and faster for organizations to deploy and manage software. However, this also means that developers are now facing more difficulties troubleshooting and understanding their code’s behavior. Dynatrace provides developers with real-time data and capabilities to overcome the highly distributed nature of Kubernetes workloads.
In addition to cloud-native apps such as distributed tracing, error analysis, and log analytics, the Live Debugger provides developers with real-time snapshots from their running code without the need to reproduce, add code, or redeploy. This helps them optimize their code and debug issues faster.
Additionally, application profiling with CPU, memory, and thread profilers help developers pinpoint processes and containers that consume CPU, identify memory leaks or usage patterns in order to solve issues and optimize their performance.
Users can also quickly understand why service requests are failing and identify root causes of increased failure rates with error and failure analysis.
Customization, automation, and ease-of-use
Managing Kubernetes workloads and clusters traditionally requires a lot of manual work that is often repetitive and time-consuming. Doing so at scale requires efficient resource management and automation to handle dynamic demands. Dynatrace’s automated workflows simplify this by predicting resource needs and scaling workloads accordingly. This allows you to manage your environments without constant oversight.
Workflow automation in Dynatrace allows for custom scaling events, based on Davis AI forecasting, enabling automated, predictive resource scaling for Kubernetes. This lets you manage your environments without the need for constant oversight, ensuring proactive issue detection and resolution.
Support for GitOps with automated observability, automatic anomaly remediation, and performance optimization are just a few ways this can be achieved.
With Dynatrace automation capabilities, monitoring your Kubernetes clusters becomes a seamless experience.
Dynatrace Kubernetes monitoring for seamless automation
In the dynamic world of cloud-native and Kubernetes, having integrated observability, AI-driven analysis, and automation is crucial for success—and Dynatrace is the answer. Let Dynatrace manage the dynamic intricacies of Kubernetes so your teams have the intelligence they need to automate and optimize.
Utilize the full power of the Dynatrace platform to gain unparalleled observability of your entire Kubernetes stack, ensure optimal performance and reliability, and proactively detect issues and automate resolution.


Looking for answers?
Start a new discussion or ask for help in our Q&A forum.
Go to forum