
Your on-call engineer is looking at intermittent HTTP 500s from a service running on a virtual machine that was perfectly healthy twelve hours ago. Nothing changed in the application. No recent deployments. Logs show connection timeouts — but only under load, and only to external services. The app itself looks fine.
This is the signature of SNAT port exhaustion: Azure’s most reliably invisible production failure. It masquerades as an application bug while the root cause sits quietly in your networking configuration. Left unresolved, it degrades under load, confuses your developers, and burns investigation hours on symptoms instead of causes.
With the general availability of Azure Cloud Platform Monitoring, Dynatrace now ships a pre-built alert that catches this exact failure — before your engineers are paged, or the moment they are. This is the story of how that plays out.
What is SNAT exhaustion?
Source Network Address Translation (SNAT) is how Azure allows resources in a virtual network to make outbound connections to the internet without exposing a public IP on each instance. When a backend instance behind an Azure Load Balancer initiates an outbound TCP connection, the load balancer performs SNAT: It maps the source IP and port to one of its frontend IPs and a port from a shared pool.
The trap: Azure allocates a limited number of SNAT ports per backend instance. The exact number depends on how many instances are in the backend pool — smaller pools get more ports per instance (up to 1,024), while larger pools get fewer (as low as 32 per instance). Each active outbound connection consumes one port for the duration of the connection plus its TIME_WAIT period — typically up to four minutes. Under normal load, this is plenty. Under burst traffic — or when an application makes many short-lived outbound calls without connection pooling — those ports vanish fast.
When the pool is exhausted, new outbound connections fail with a generic network error. The application logs a 500 or a timeout. Developers stare at their code. The infrastructure looks healthy in Azure Monitor… unless you know exactly which metric to watch and where.
12:03 PM — The alert fires
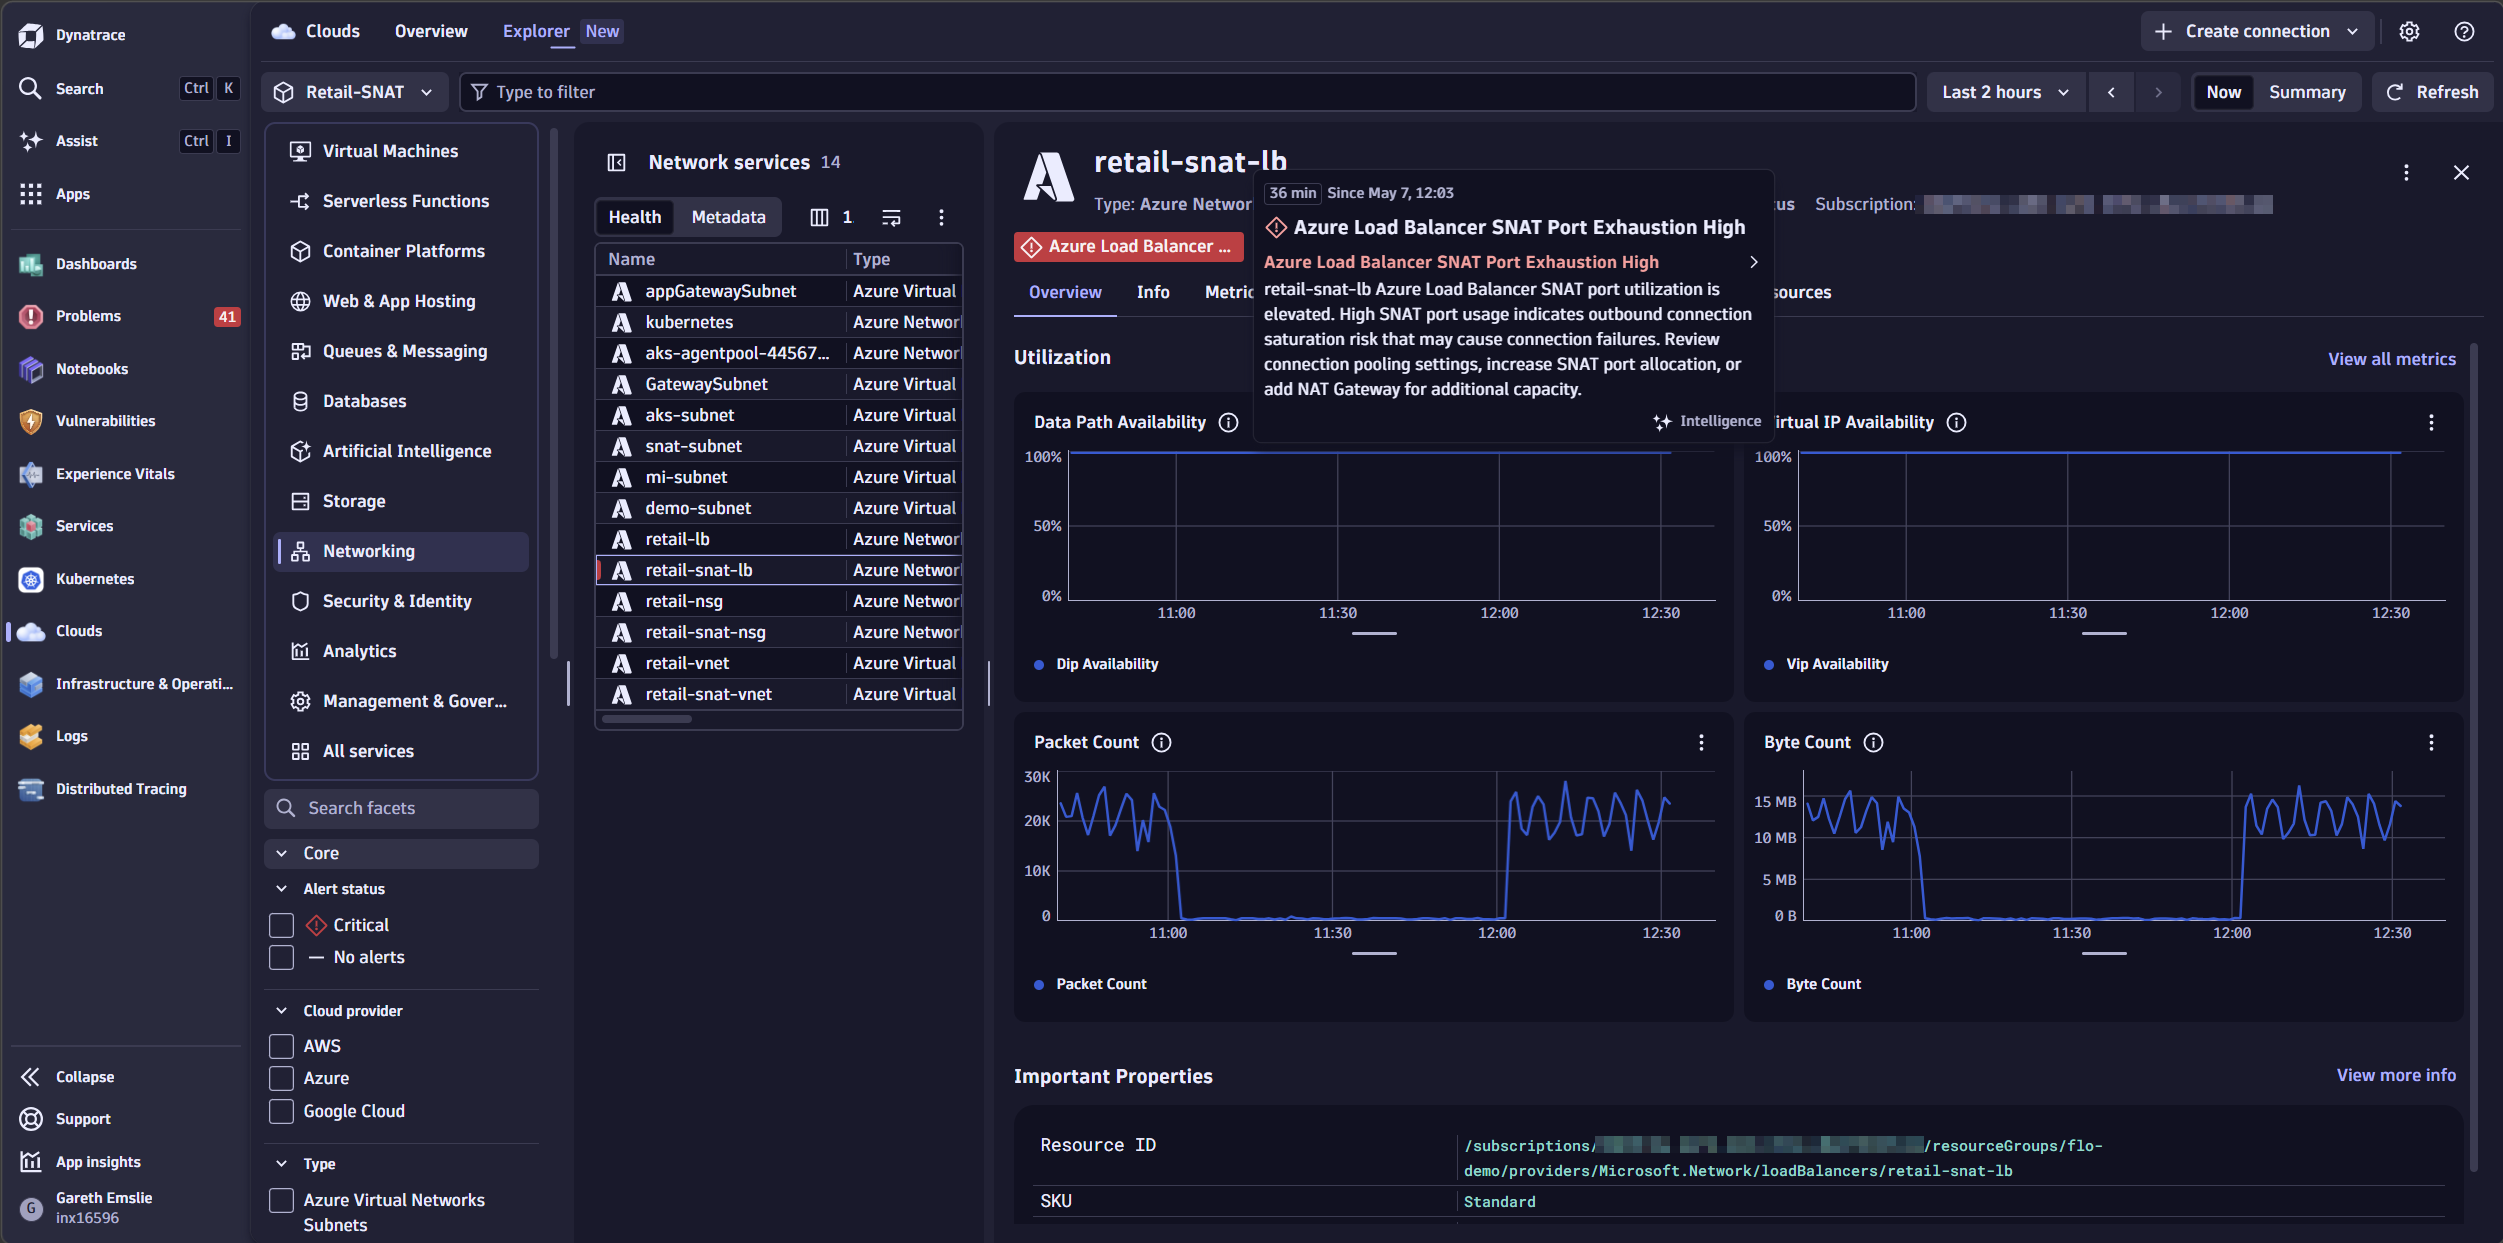
At 12:03 PM, Dynatrace fires a problem notification: “Azure Load Balancer SNAT Port Exhaustion High” — one of the pre-shipped health alerts that comes with Azure Cloud Platform Monitoring.
The alert details show the affected resource: retail-snat-lb, a production Load Balancer in the prod-eastus subscription, with SNAT connection counts climbing rapidly toward the allocated port ceiling. The problem card surfaces the backend IP addresses approaching exhaustion — in this case, two instances already above 75% of their allocated ports — alongside the duration, the severity trend, and a direct link into the Clouds app to investigate.
What’s going on?
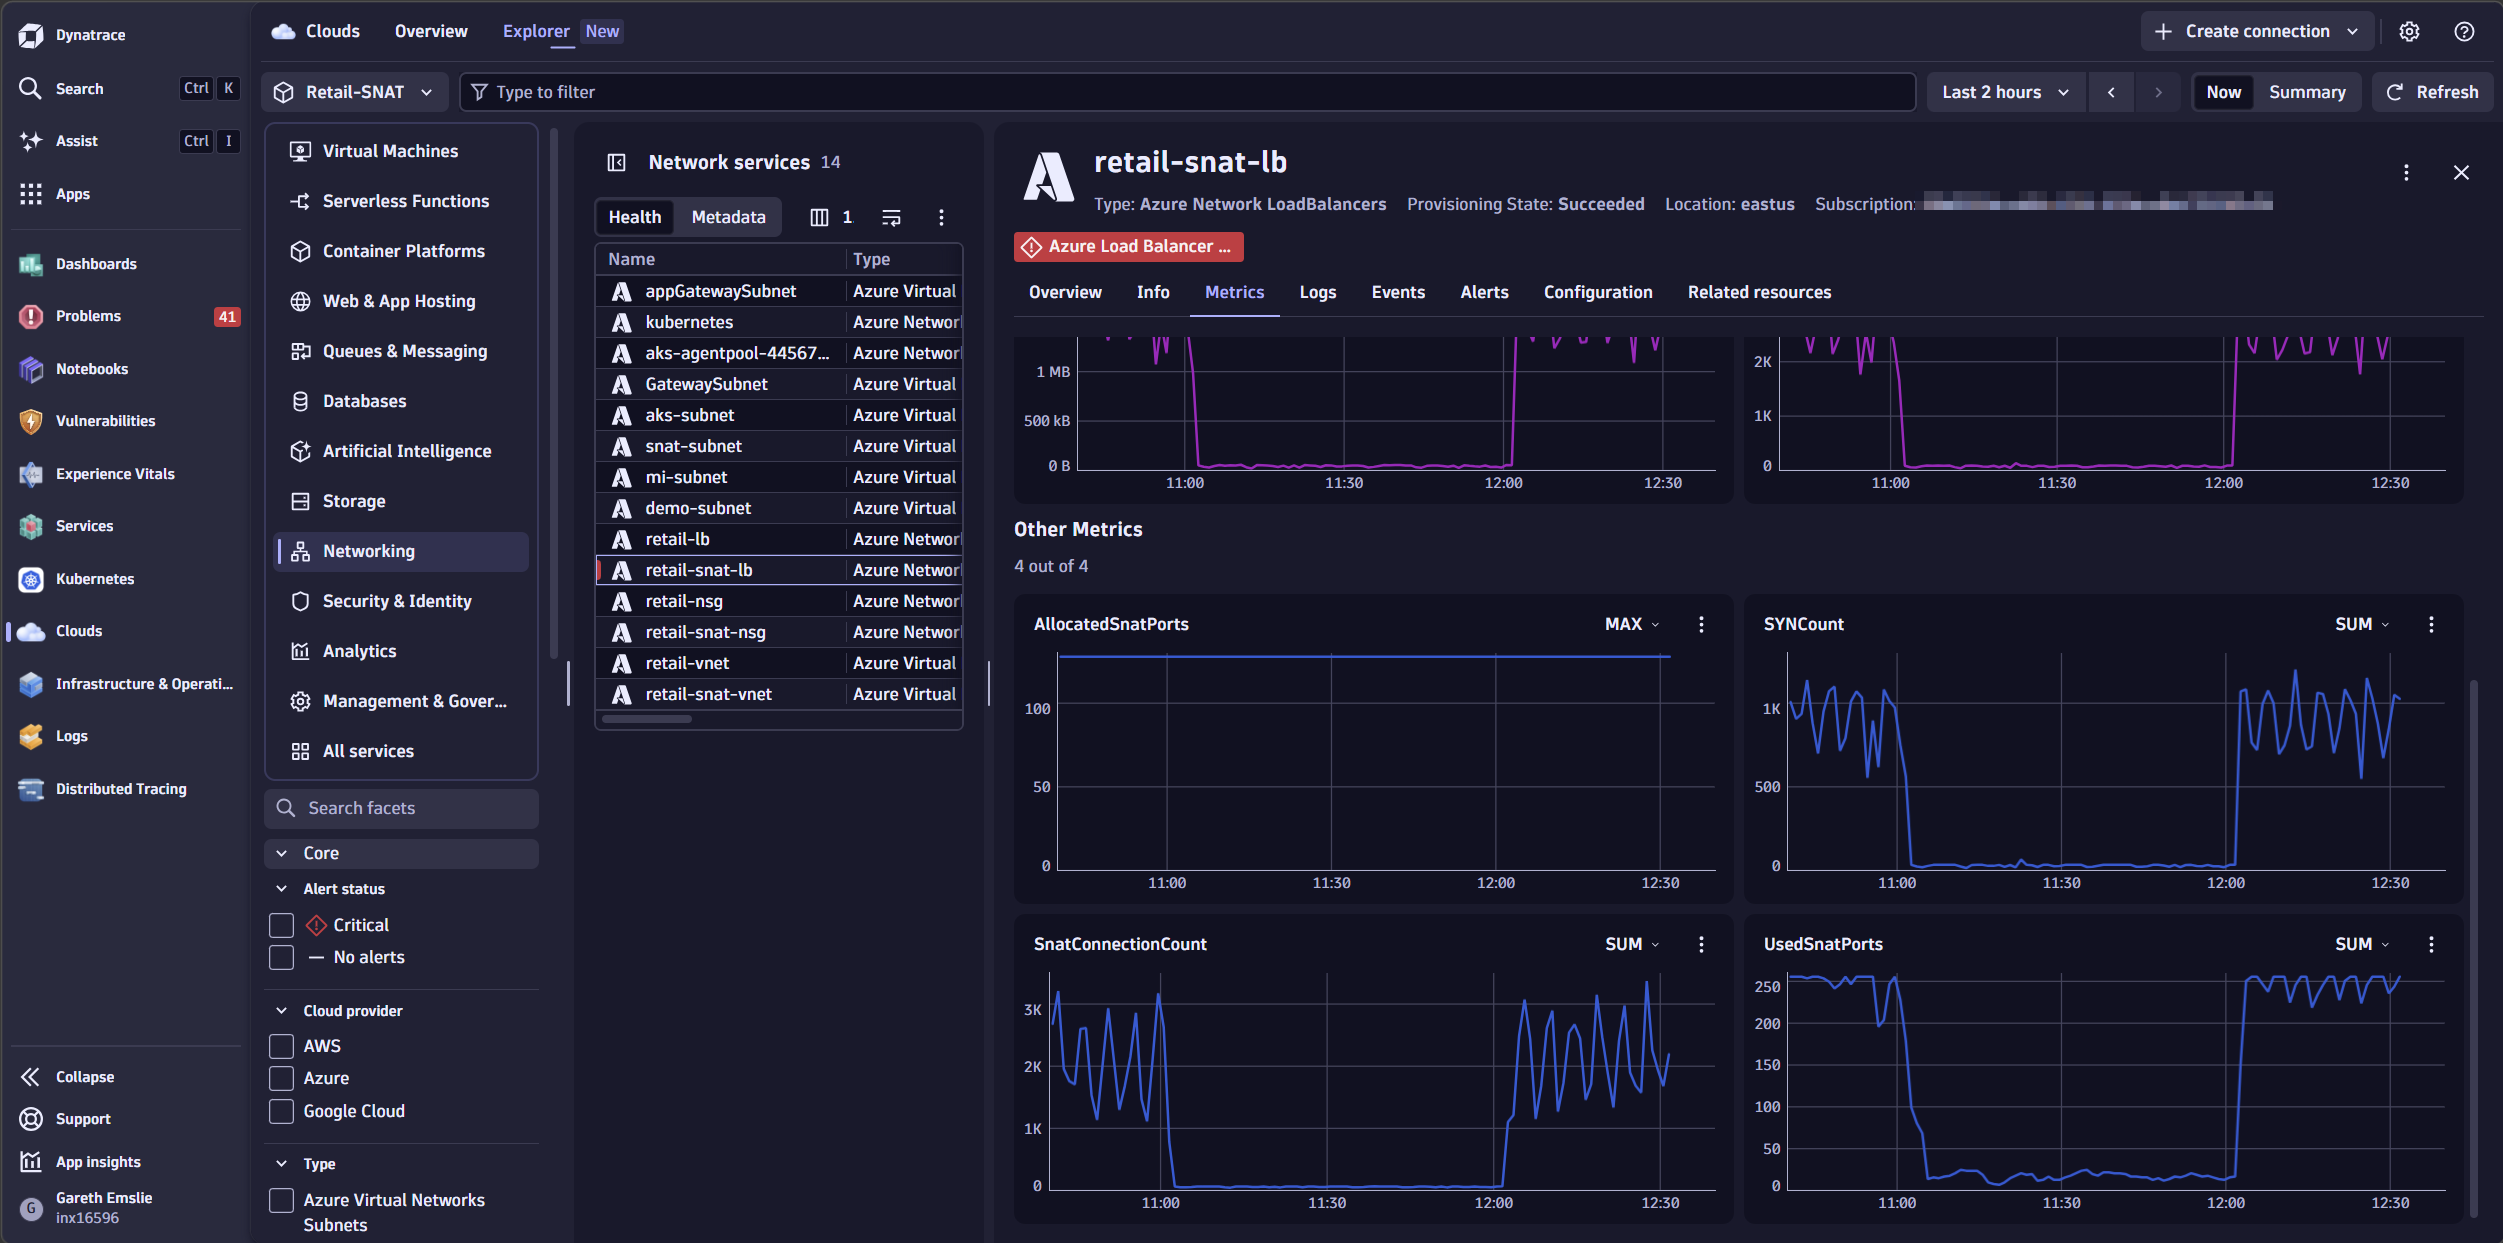
Opening retail-snat-lb in the Clouds app, the metrics make the problem immediately clear. UsedSnatPorts is peaking at 256 — against an allocated ceiling of 128 ports per backend instance. That is 100% utilization, and it is not a one-off spike. The pattern repeats with every traffic wave hitting the backend.
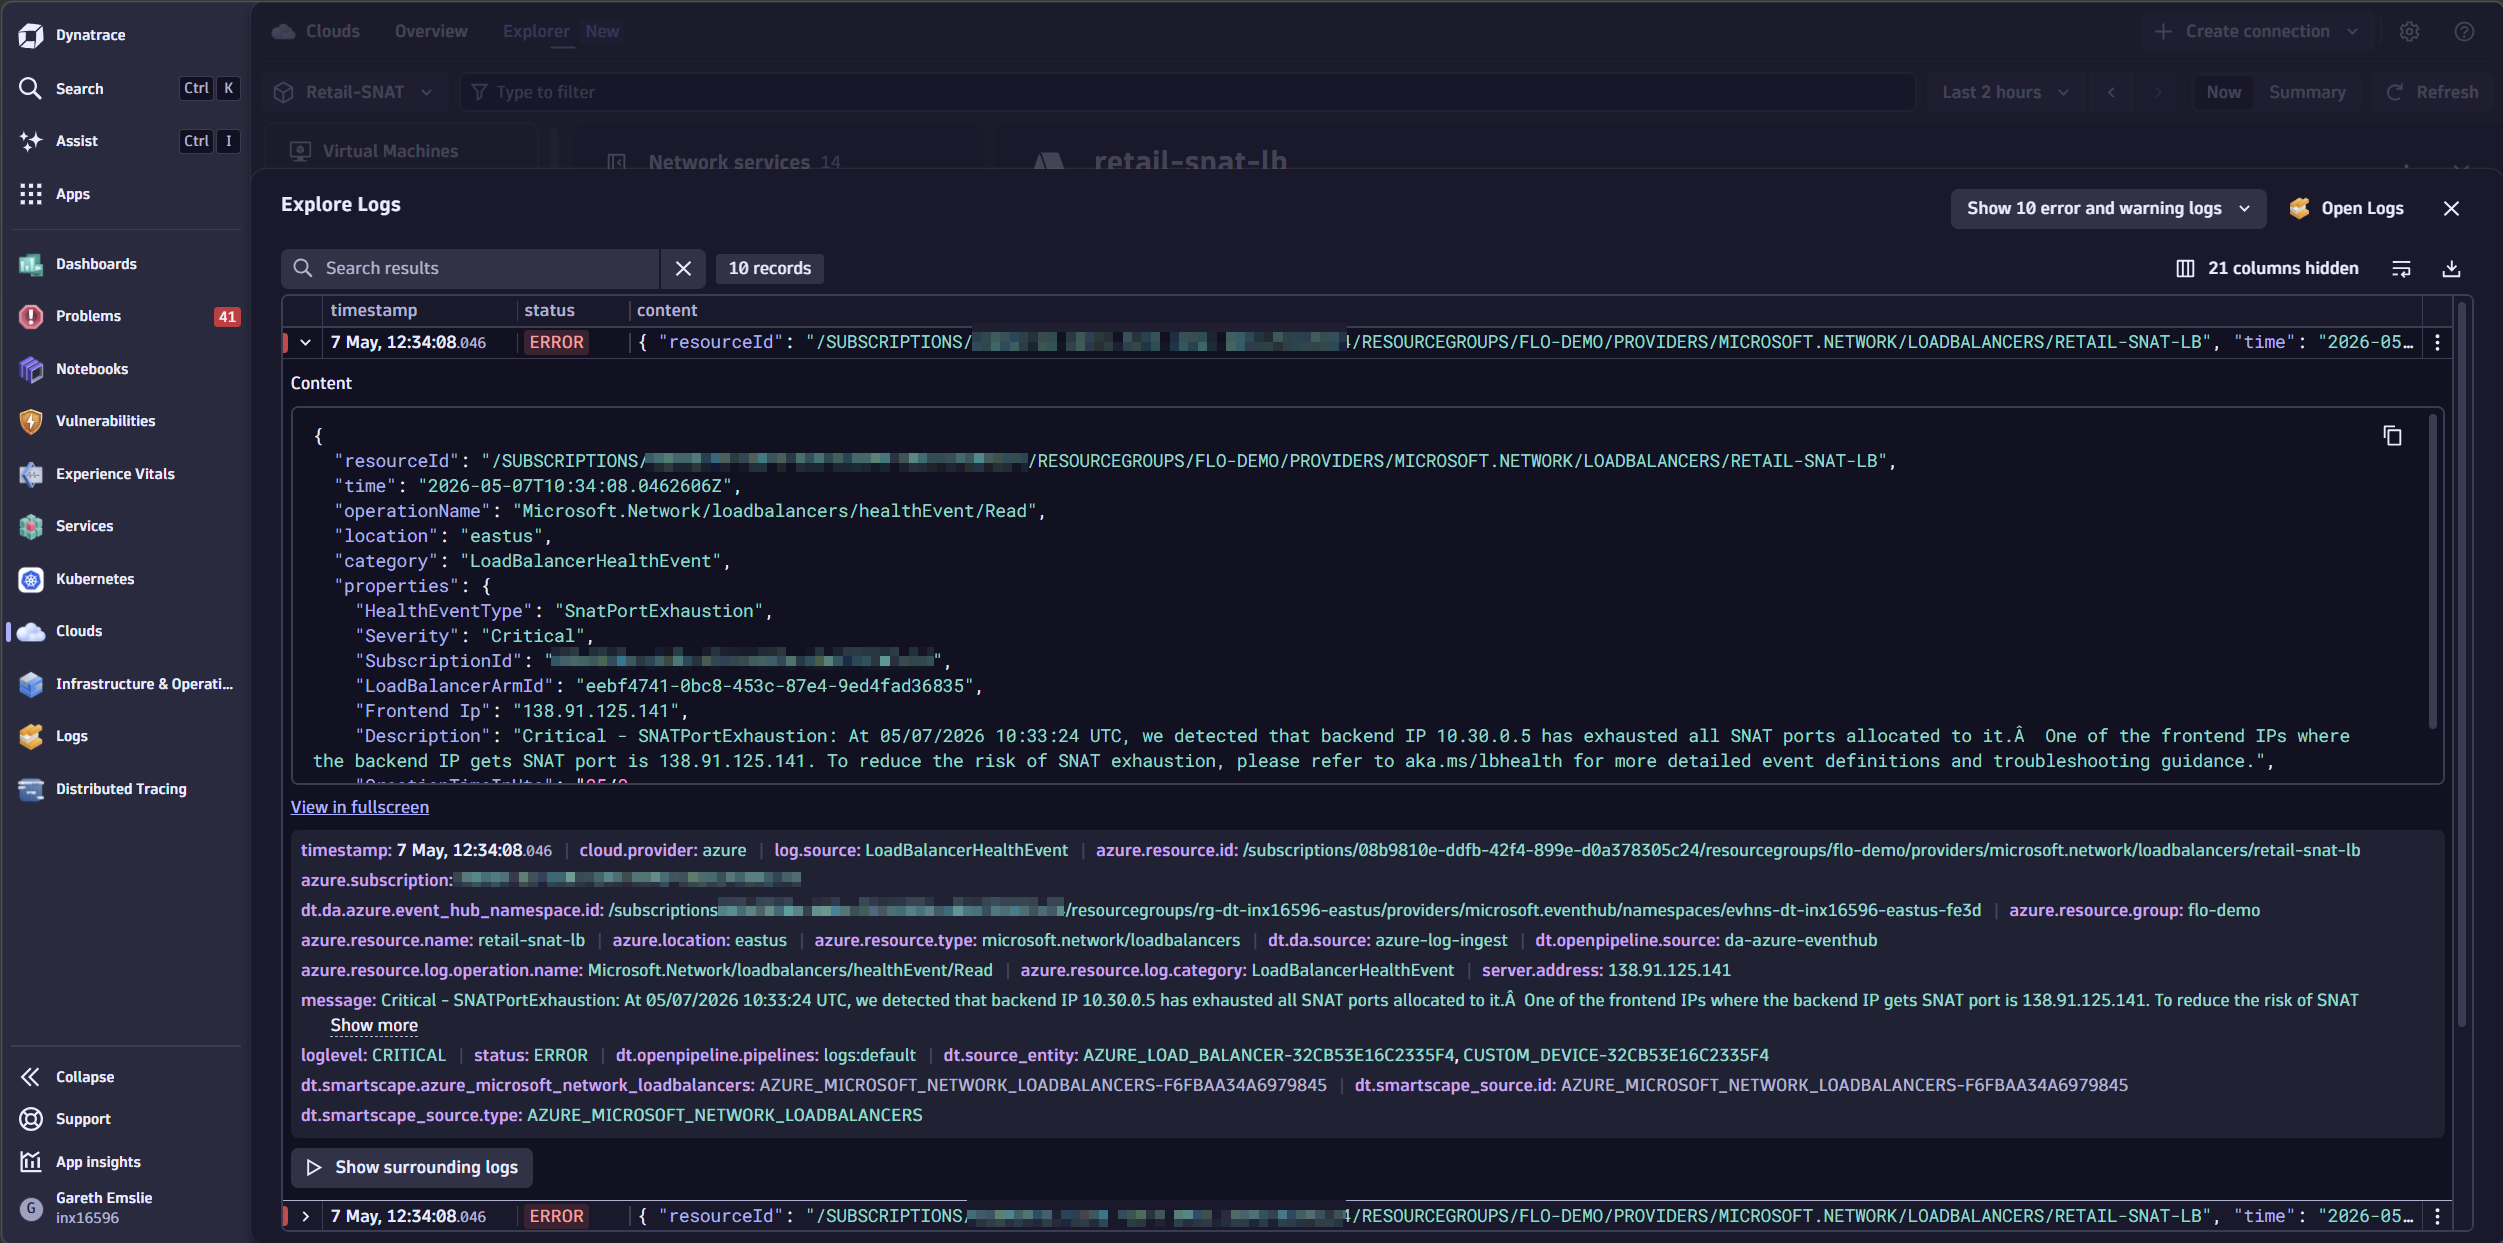
Metrics tell the story, but logs confirm it. With Azure resource (diagnostic) logs ingested into Dynatrace, we can corroborate what the SNAT metrics are showing.
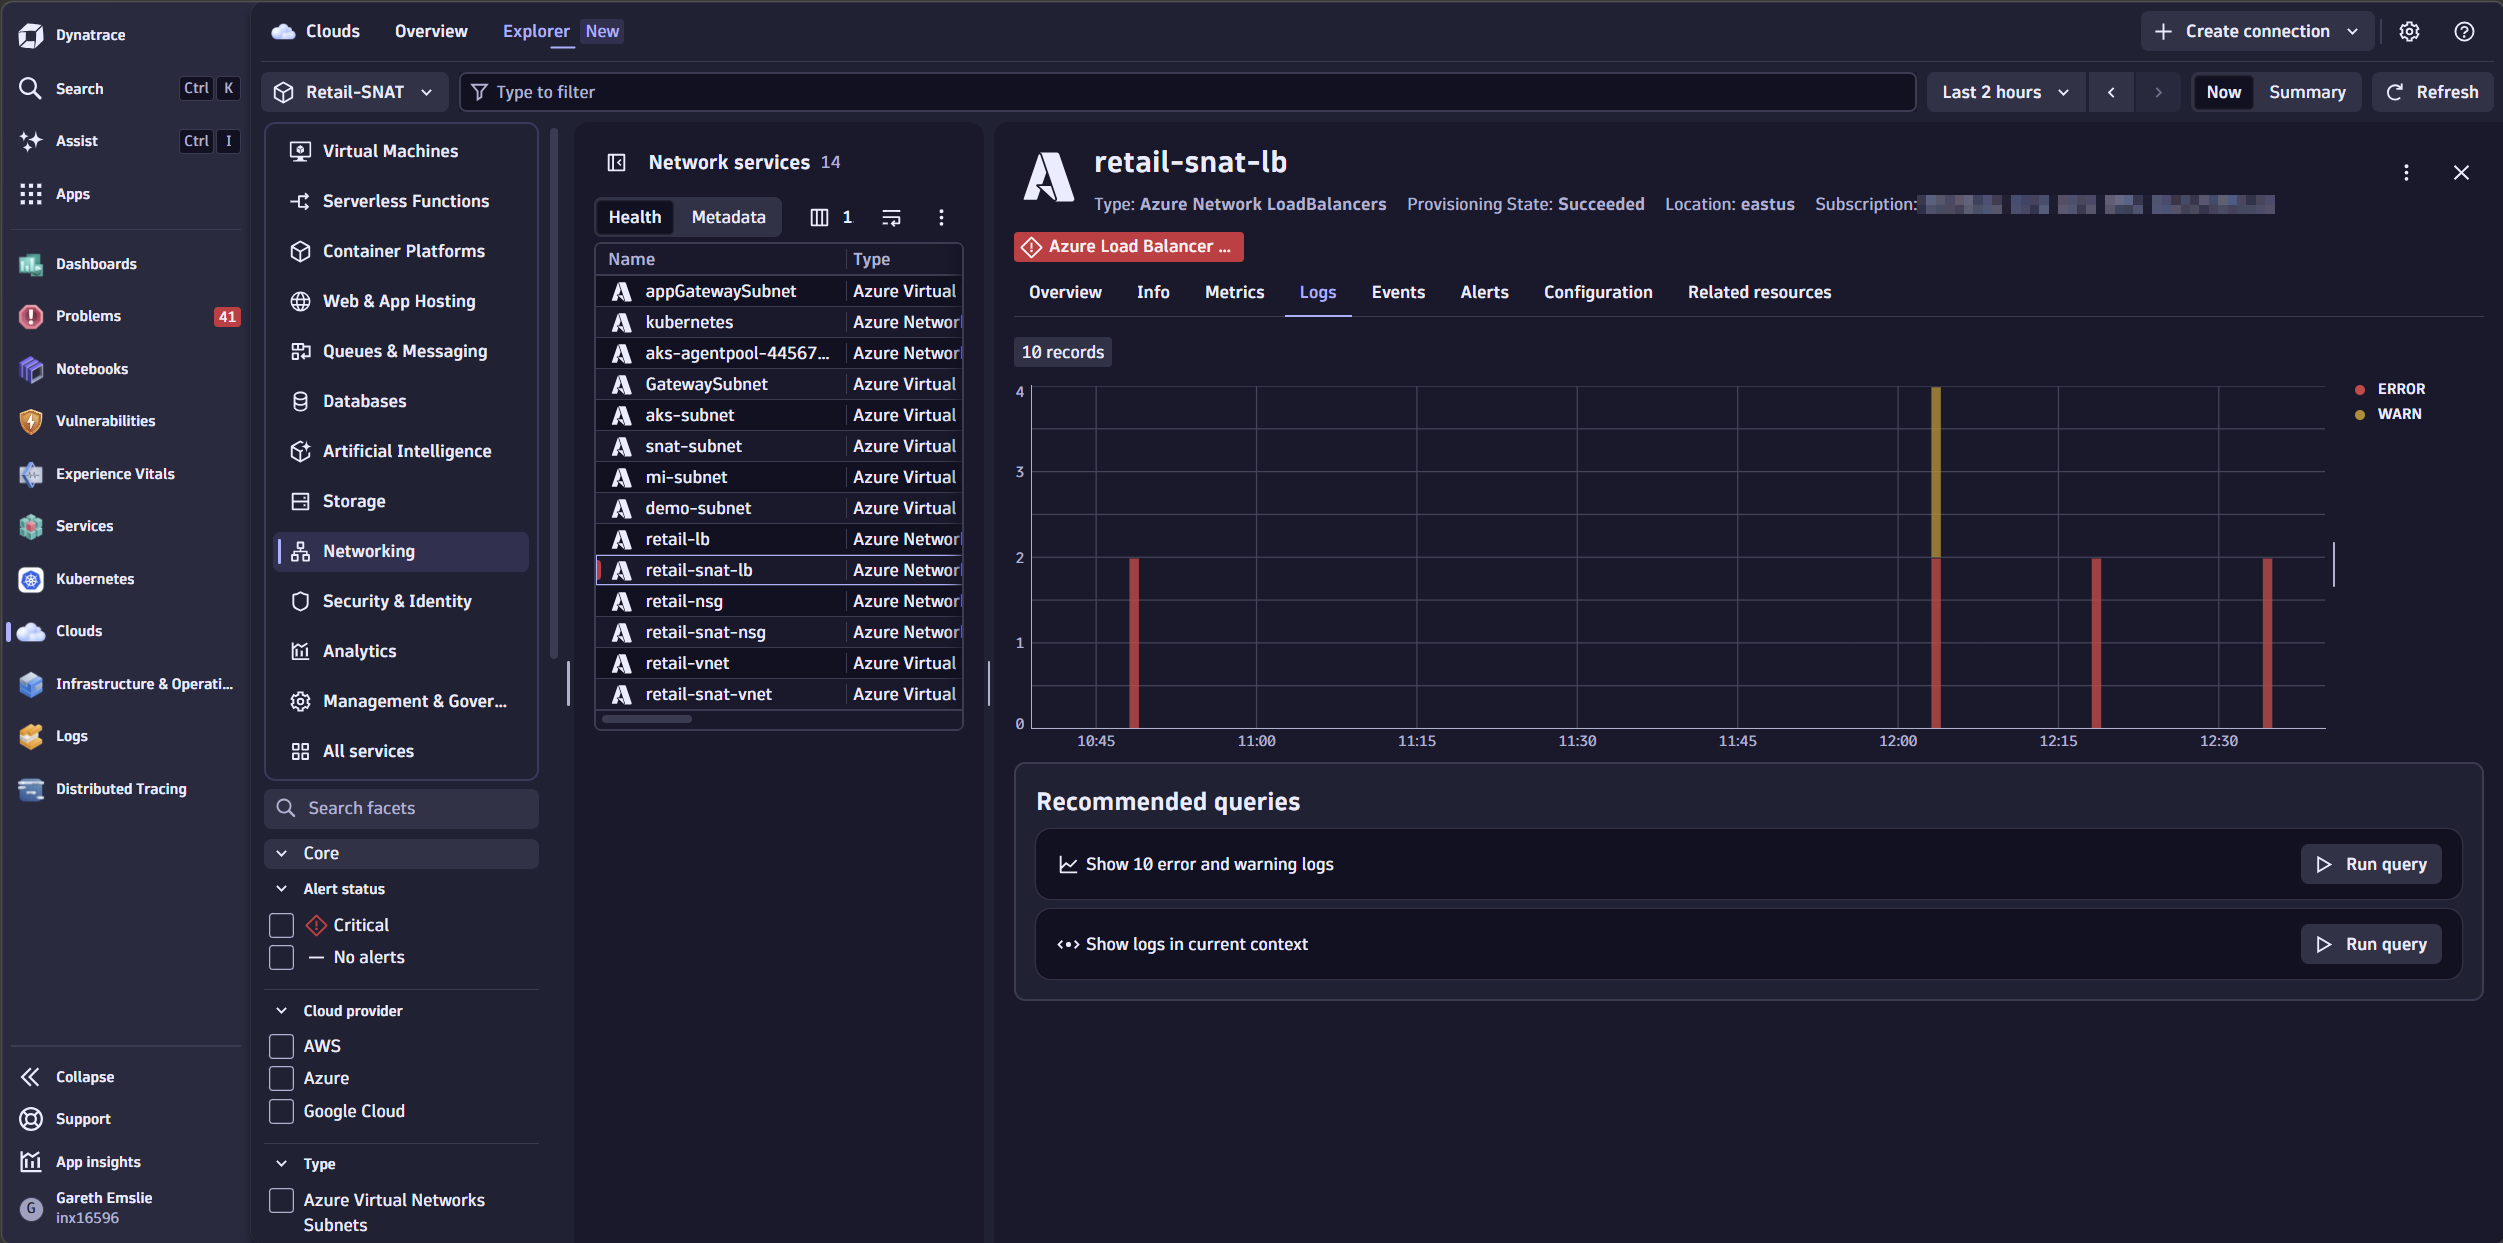
The last 10 error and warning log entries confirm it: the Azure Load Balancer is experiencing SnatPortExhaustion.
Azure Cloud Platform Monitoring continuously maps your cloud topology and persists it in Smartscape® as nodes. Dynatrace discovers relationships between Azure resources and creates Smartscape edges for the relevant nodes.
From the related resources tab, we can drill into the outbound rule configuration for this Load Balancer.
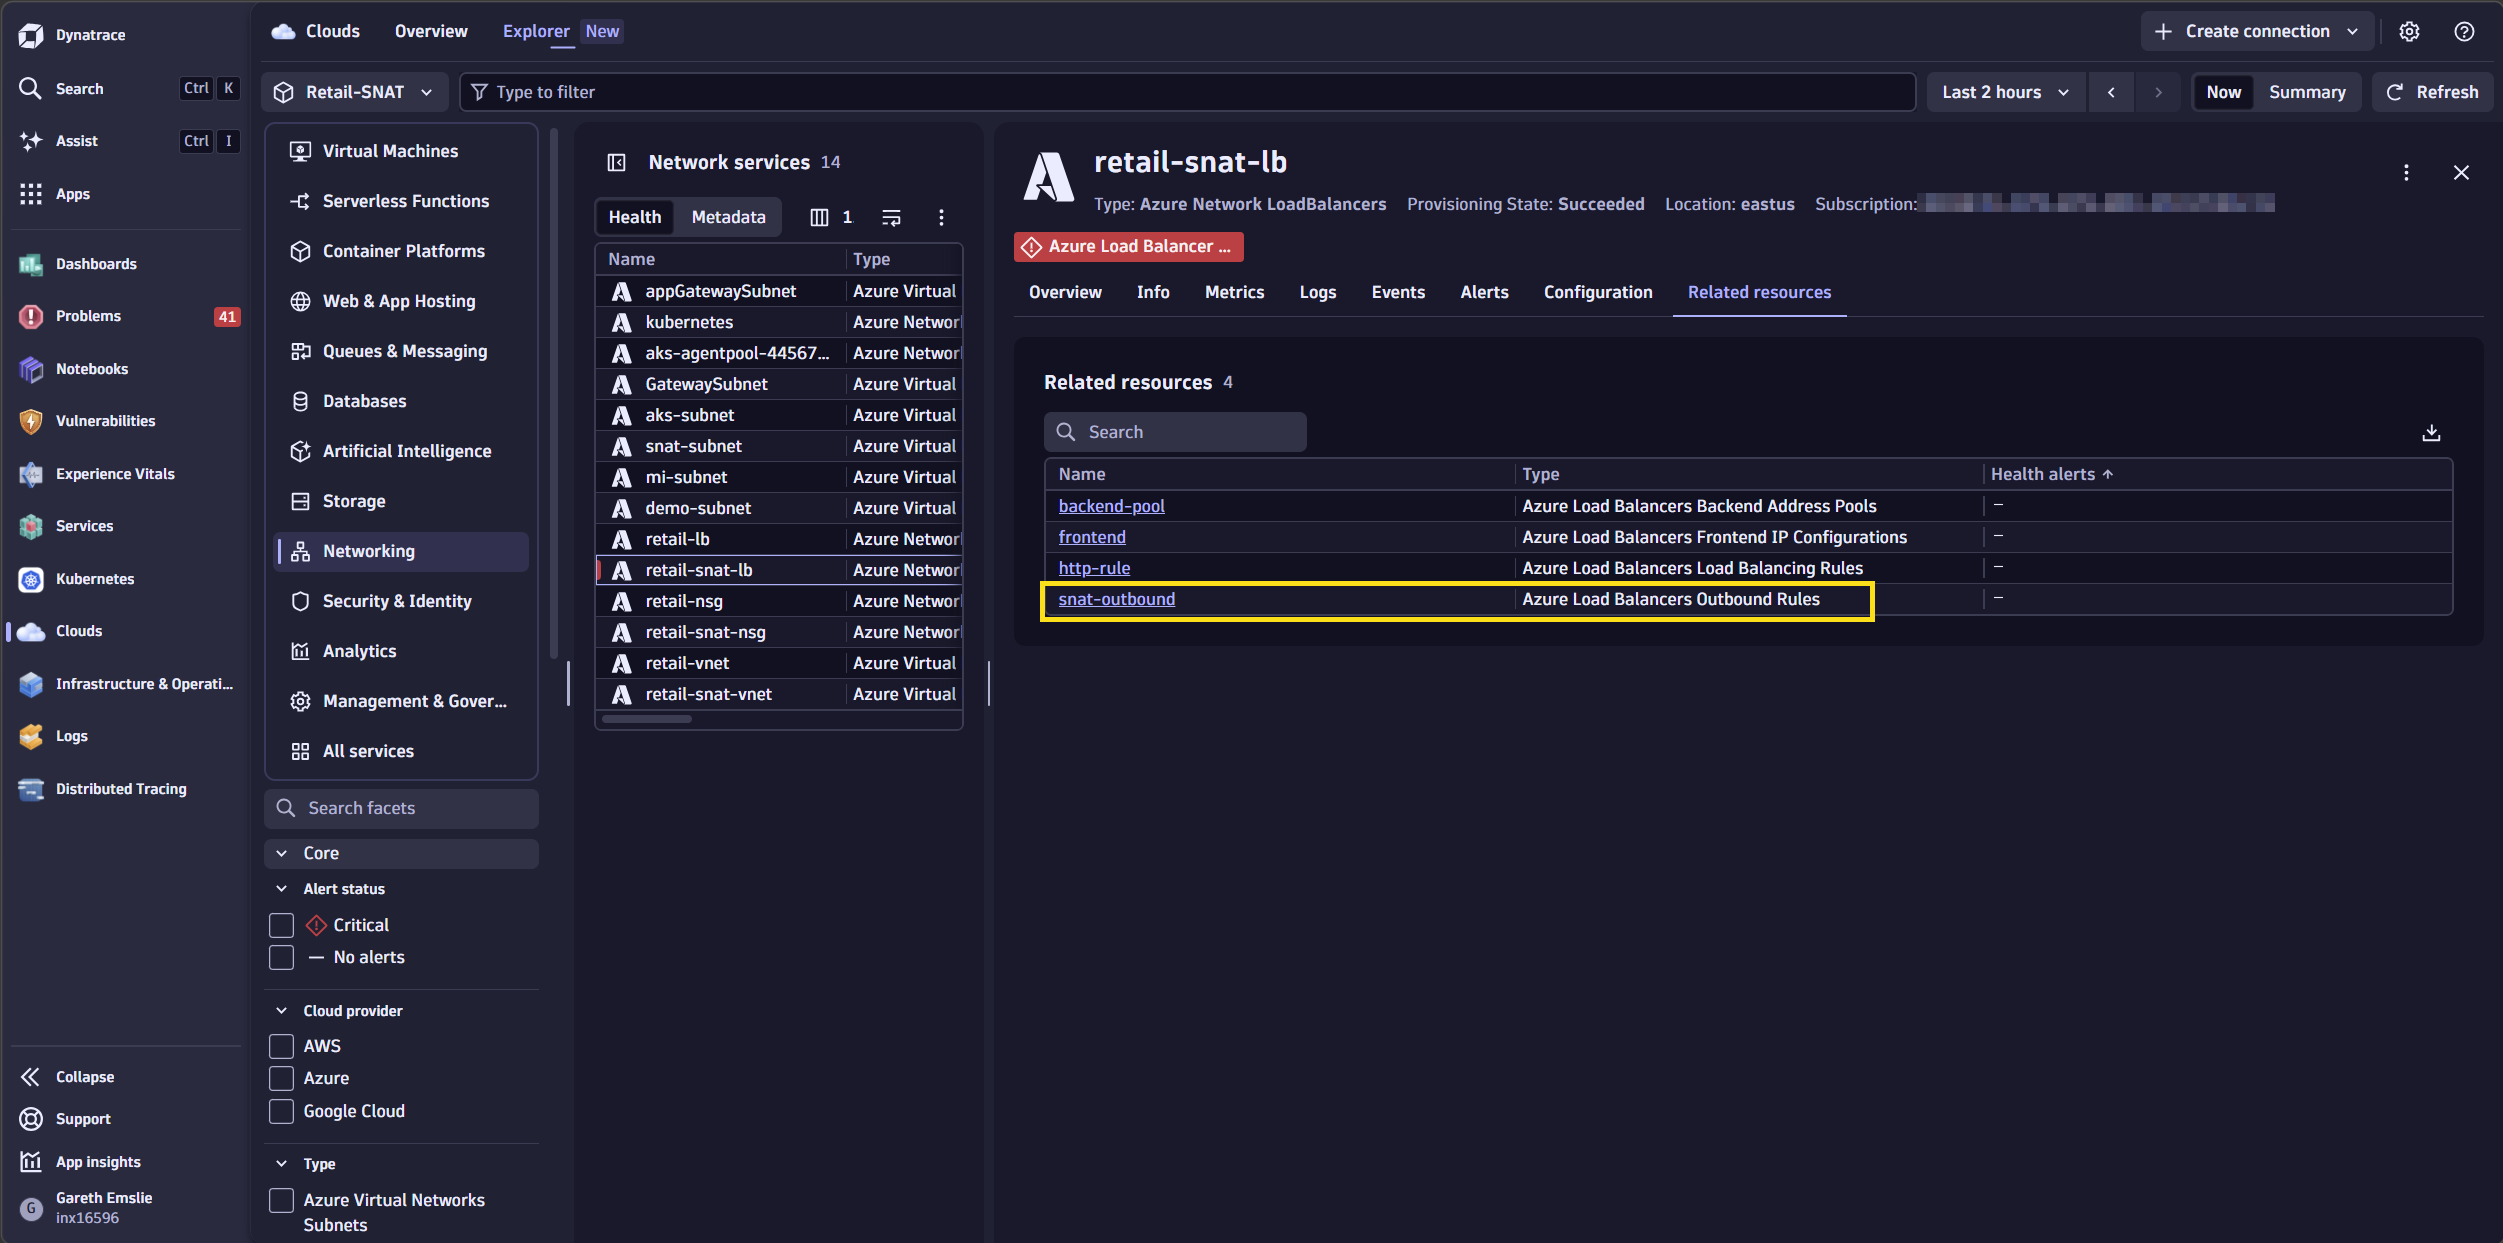
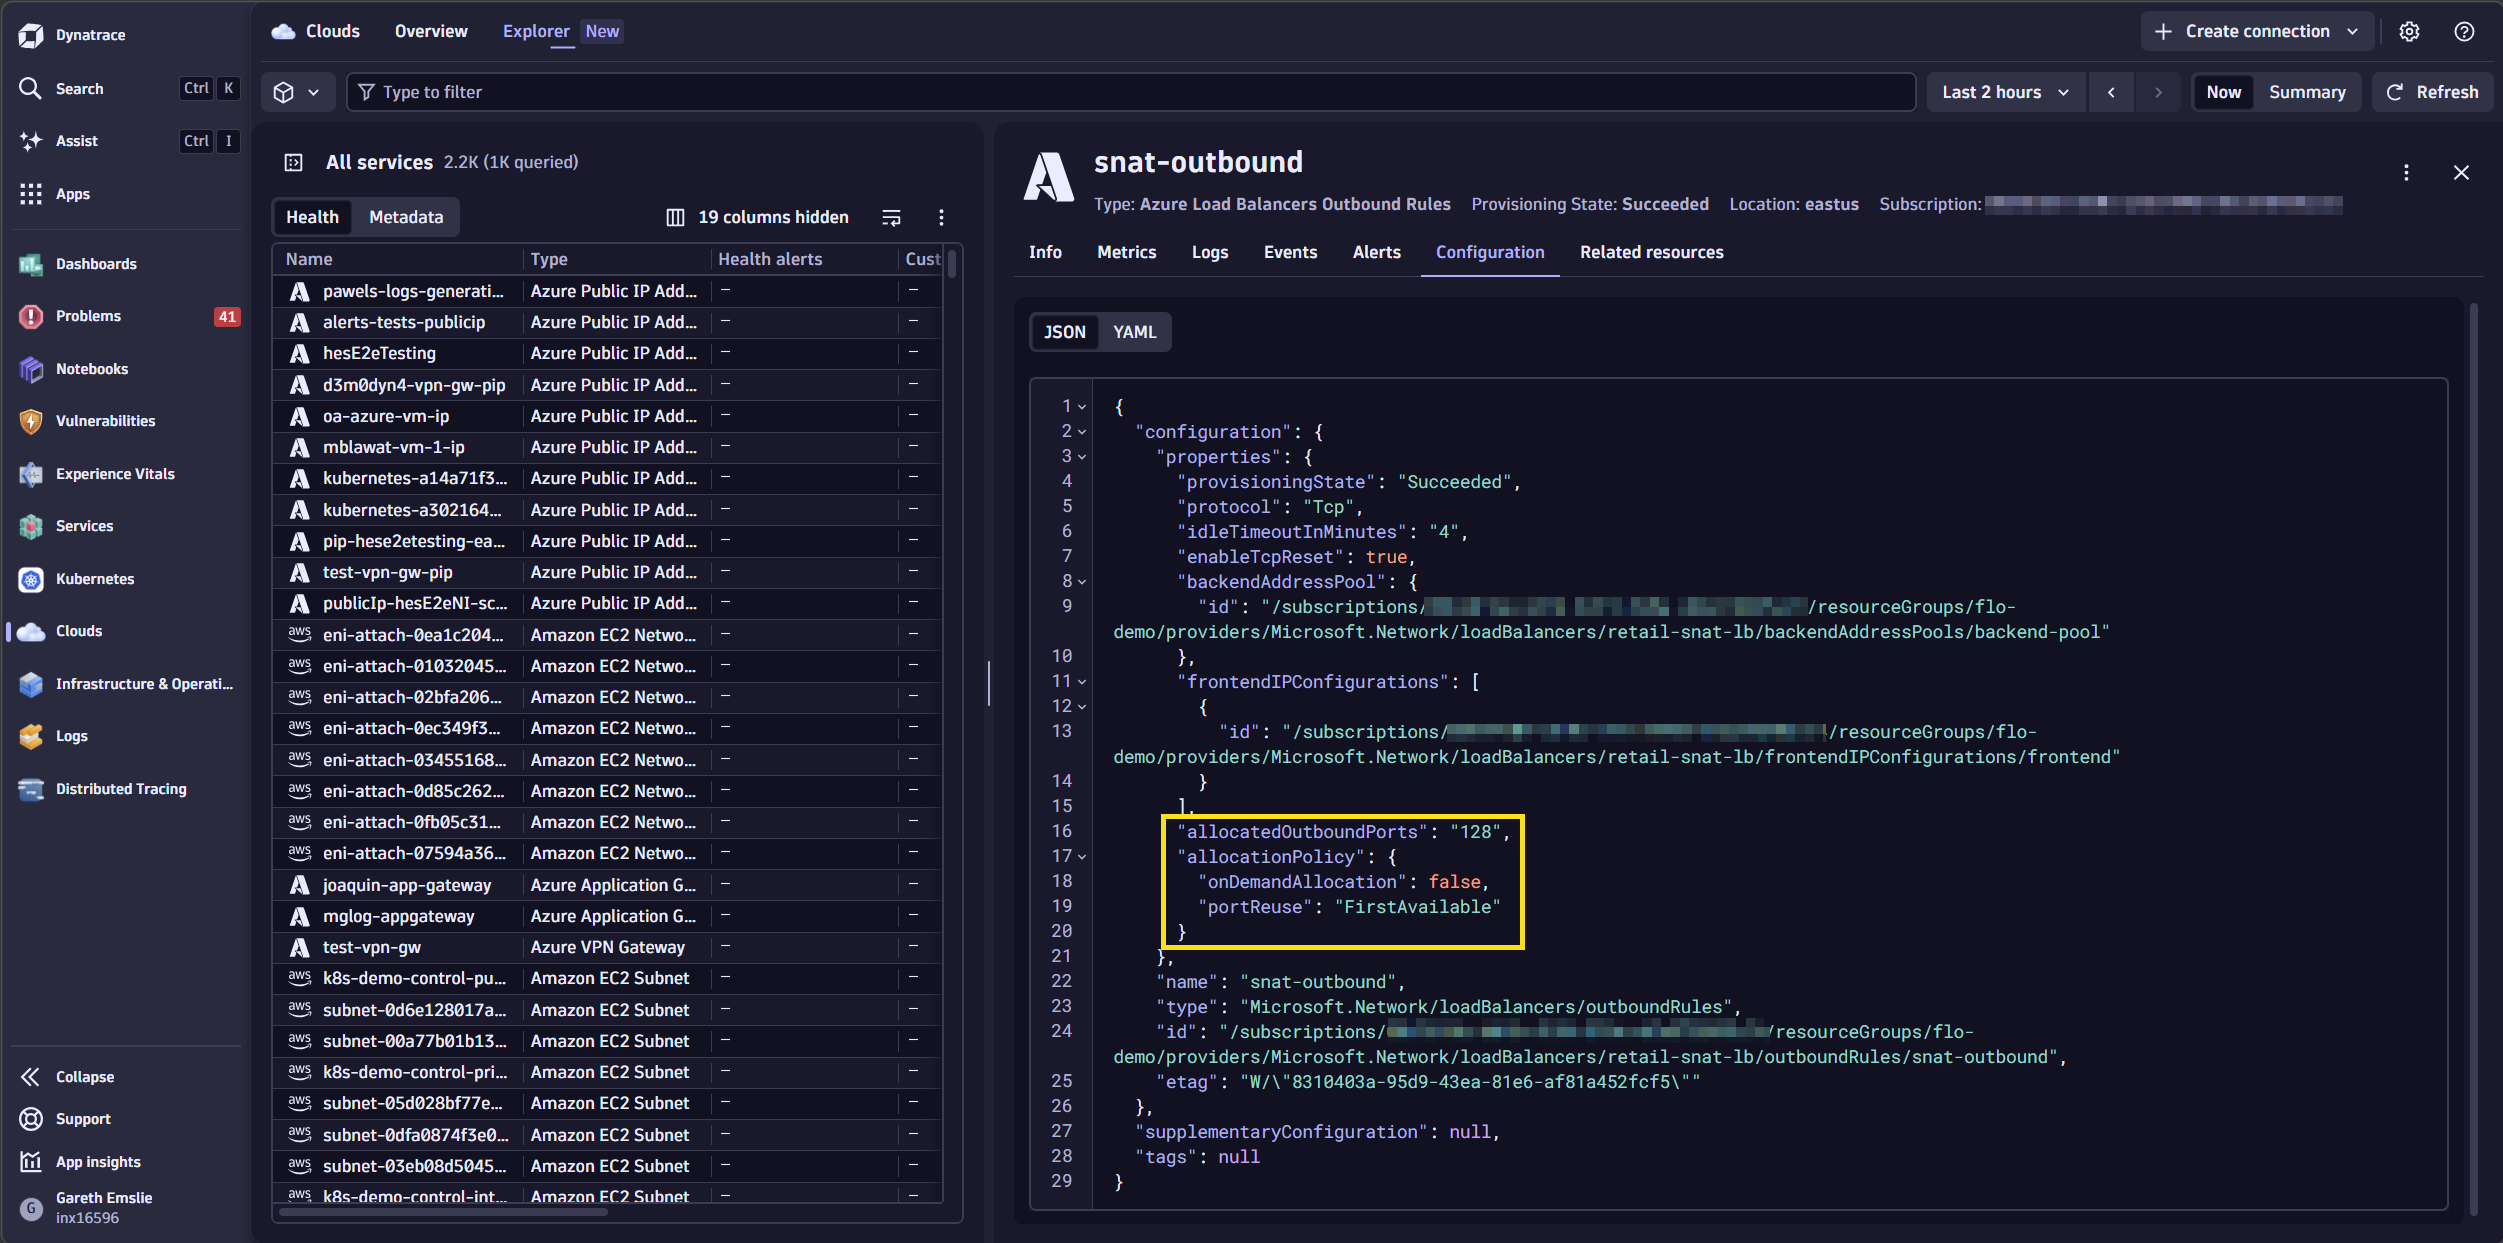
We can see that allocatedOutboundPorts is currently set to 128. This is the custom number of SNAT ports which are pre-allocated per backend instance for outbound connections. If a VM uses all its allocated ports — due to many concurrent or short-lived outbound connections — new connections fail with SNAT exhaustion errors.
Increasing allocatedOutboundPorts reduces this risk, but there is a tradeoff: More ports per instance means fewer instances per frontend IP. With a single frontend IP (64K ports), setting 1,000 ports per instance supports roughly 64 instances; setting 128 ports per instance supports roughly 500 instances.
But what backend instances are serving traffic? We can query Smartscape topology using DQL to understand exactly which Azure Network Interfaces are associated with the Load Balancer’s backend pool.
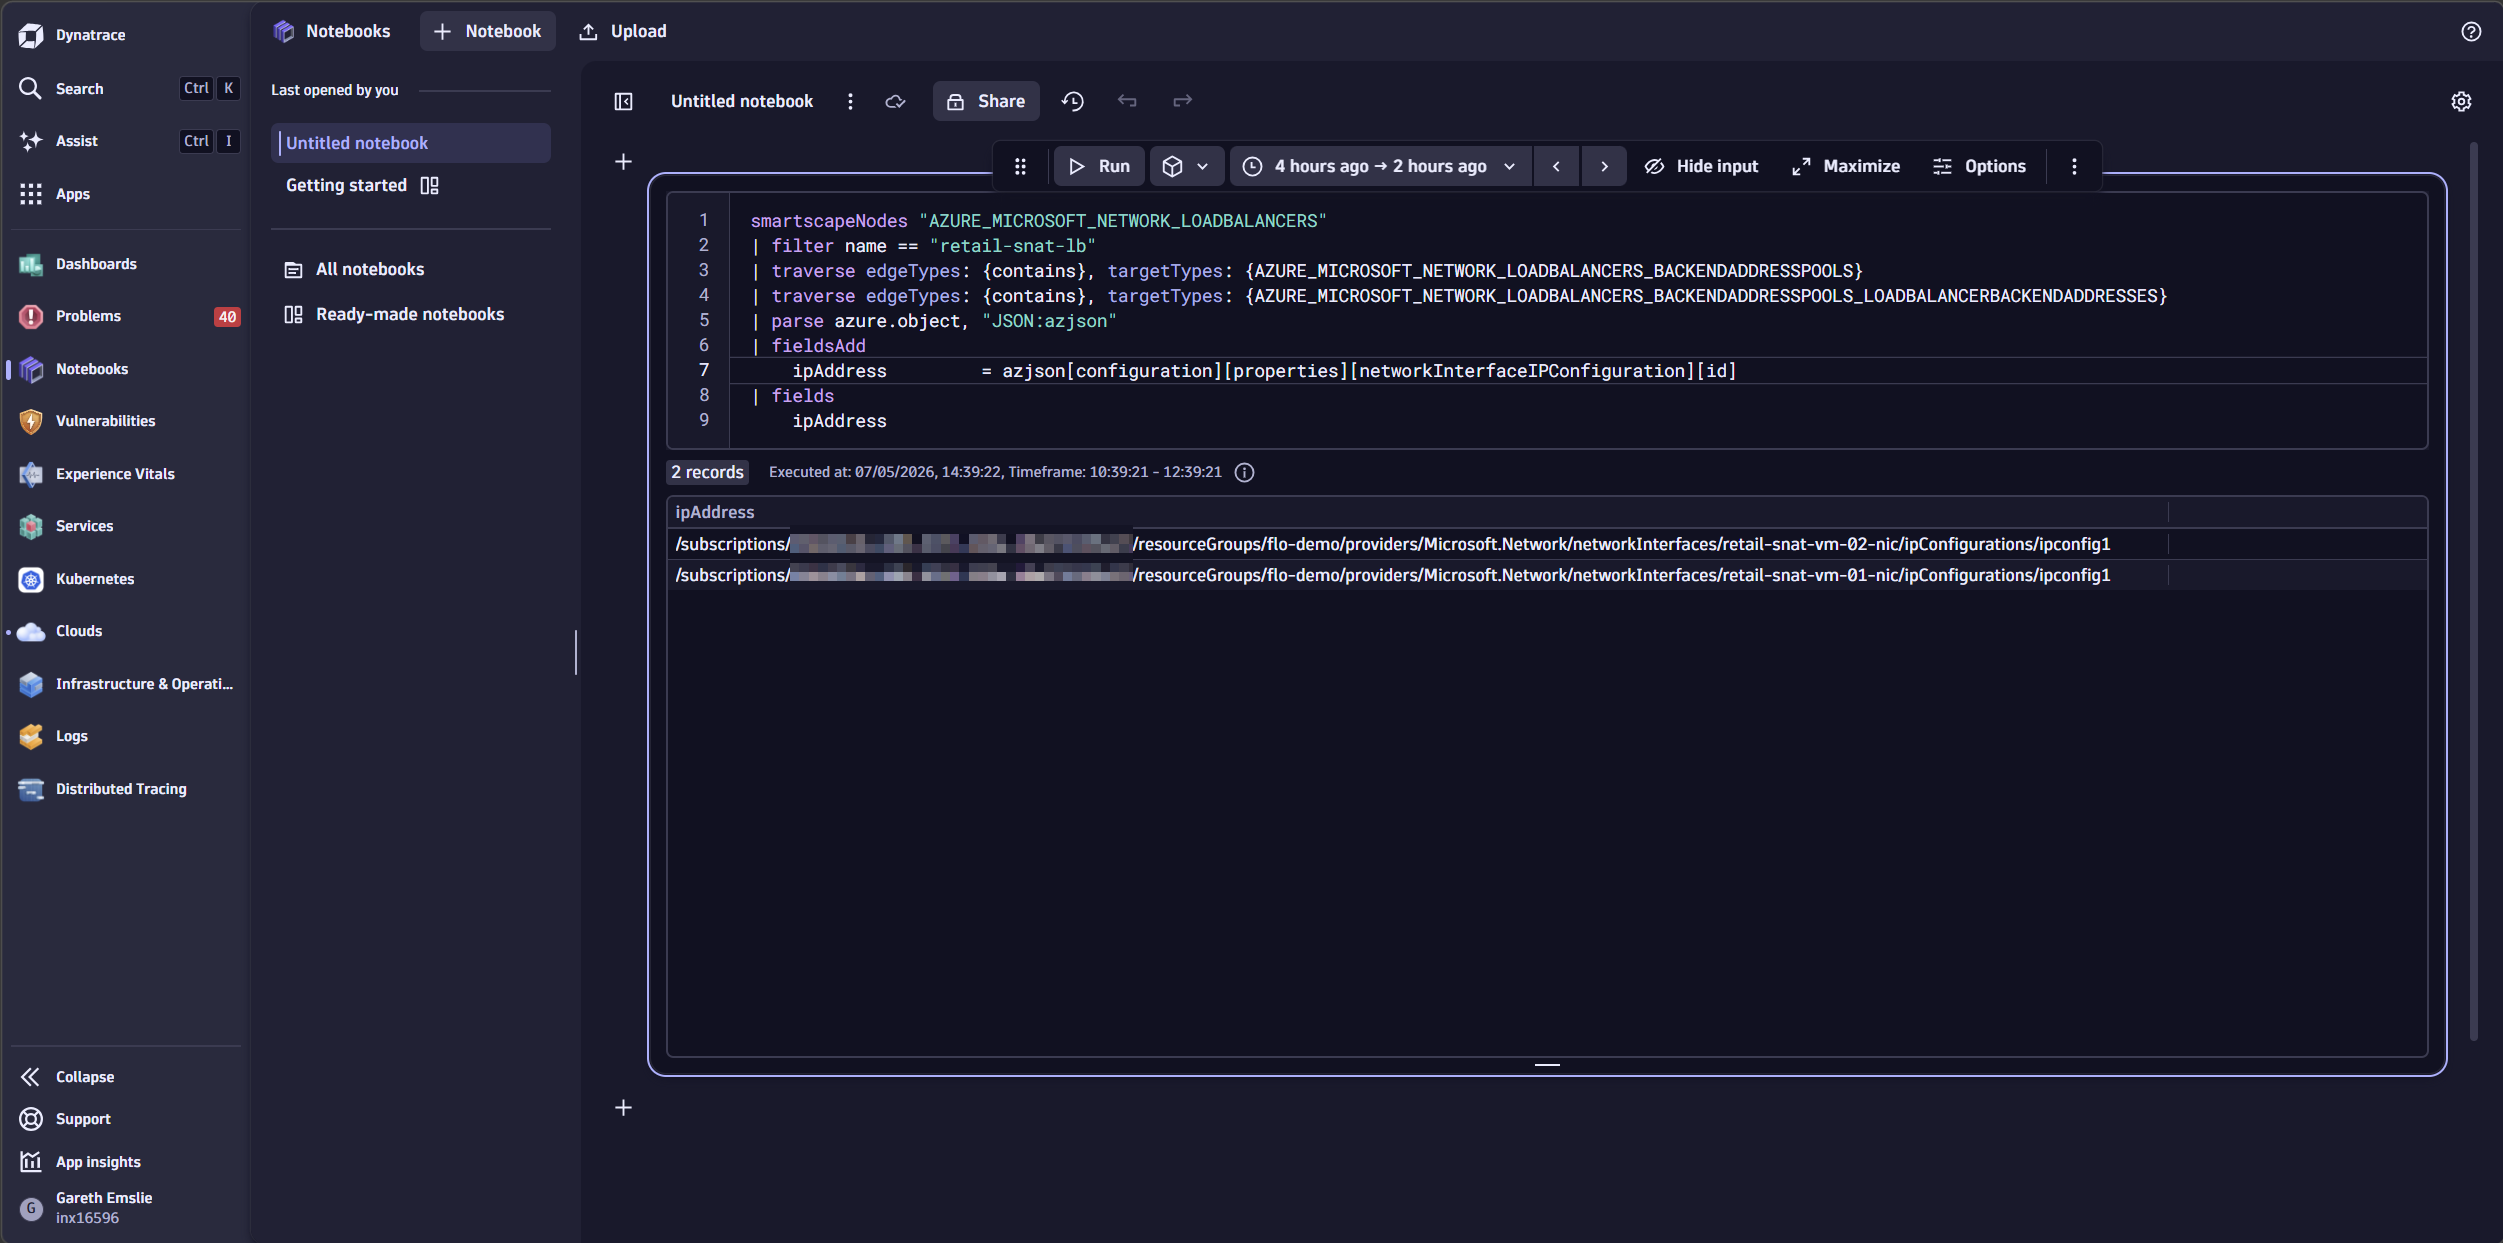
We can see there are two Azure Virtual Machines whose network interfaces are registered in the backend pool, both making outbound calls through a single Azure Load Balancer.
This matters because SNAT exhaustion is a per-instance problem. With two VMs in the backend pool, Azure pre-allocates 128 SNAT ports to each instance via the outbound rule. Under load, both VMs are independently hitting their own port ceilings — which is exactly what the metrics are showing. The topology makes this architecture immediately visible, without navigating Azure Portal resource groups or drawing a diagram by hand.
Observability superpowers
With the root cause identified on a single Load Balancer, the next question is obvious: Is this the only one at risk?
This is where Dynatrace Assist comes in — and with Azure-specific agentic skills arriving in an upcoming Dynatrace release, it gets even more powerful. Assist is your natural language gateway into Dynatrace Intelligence — the agentic operations system that brings the full platform together. Instead of switching between dashboards, writing queries by hand, or clicking through Azure Portal subscription by subscription, you ask a question in a conversational interface. Assist draws context from Grail™ and maps relationships through Smartscape to deliver grounded, data-backed answers.
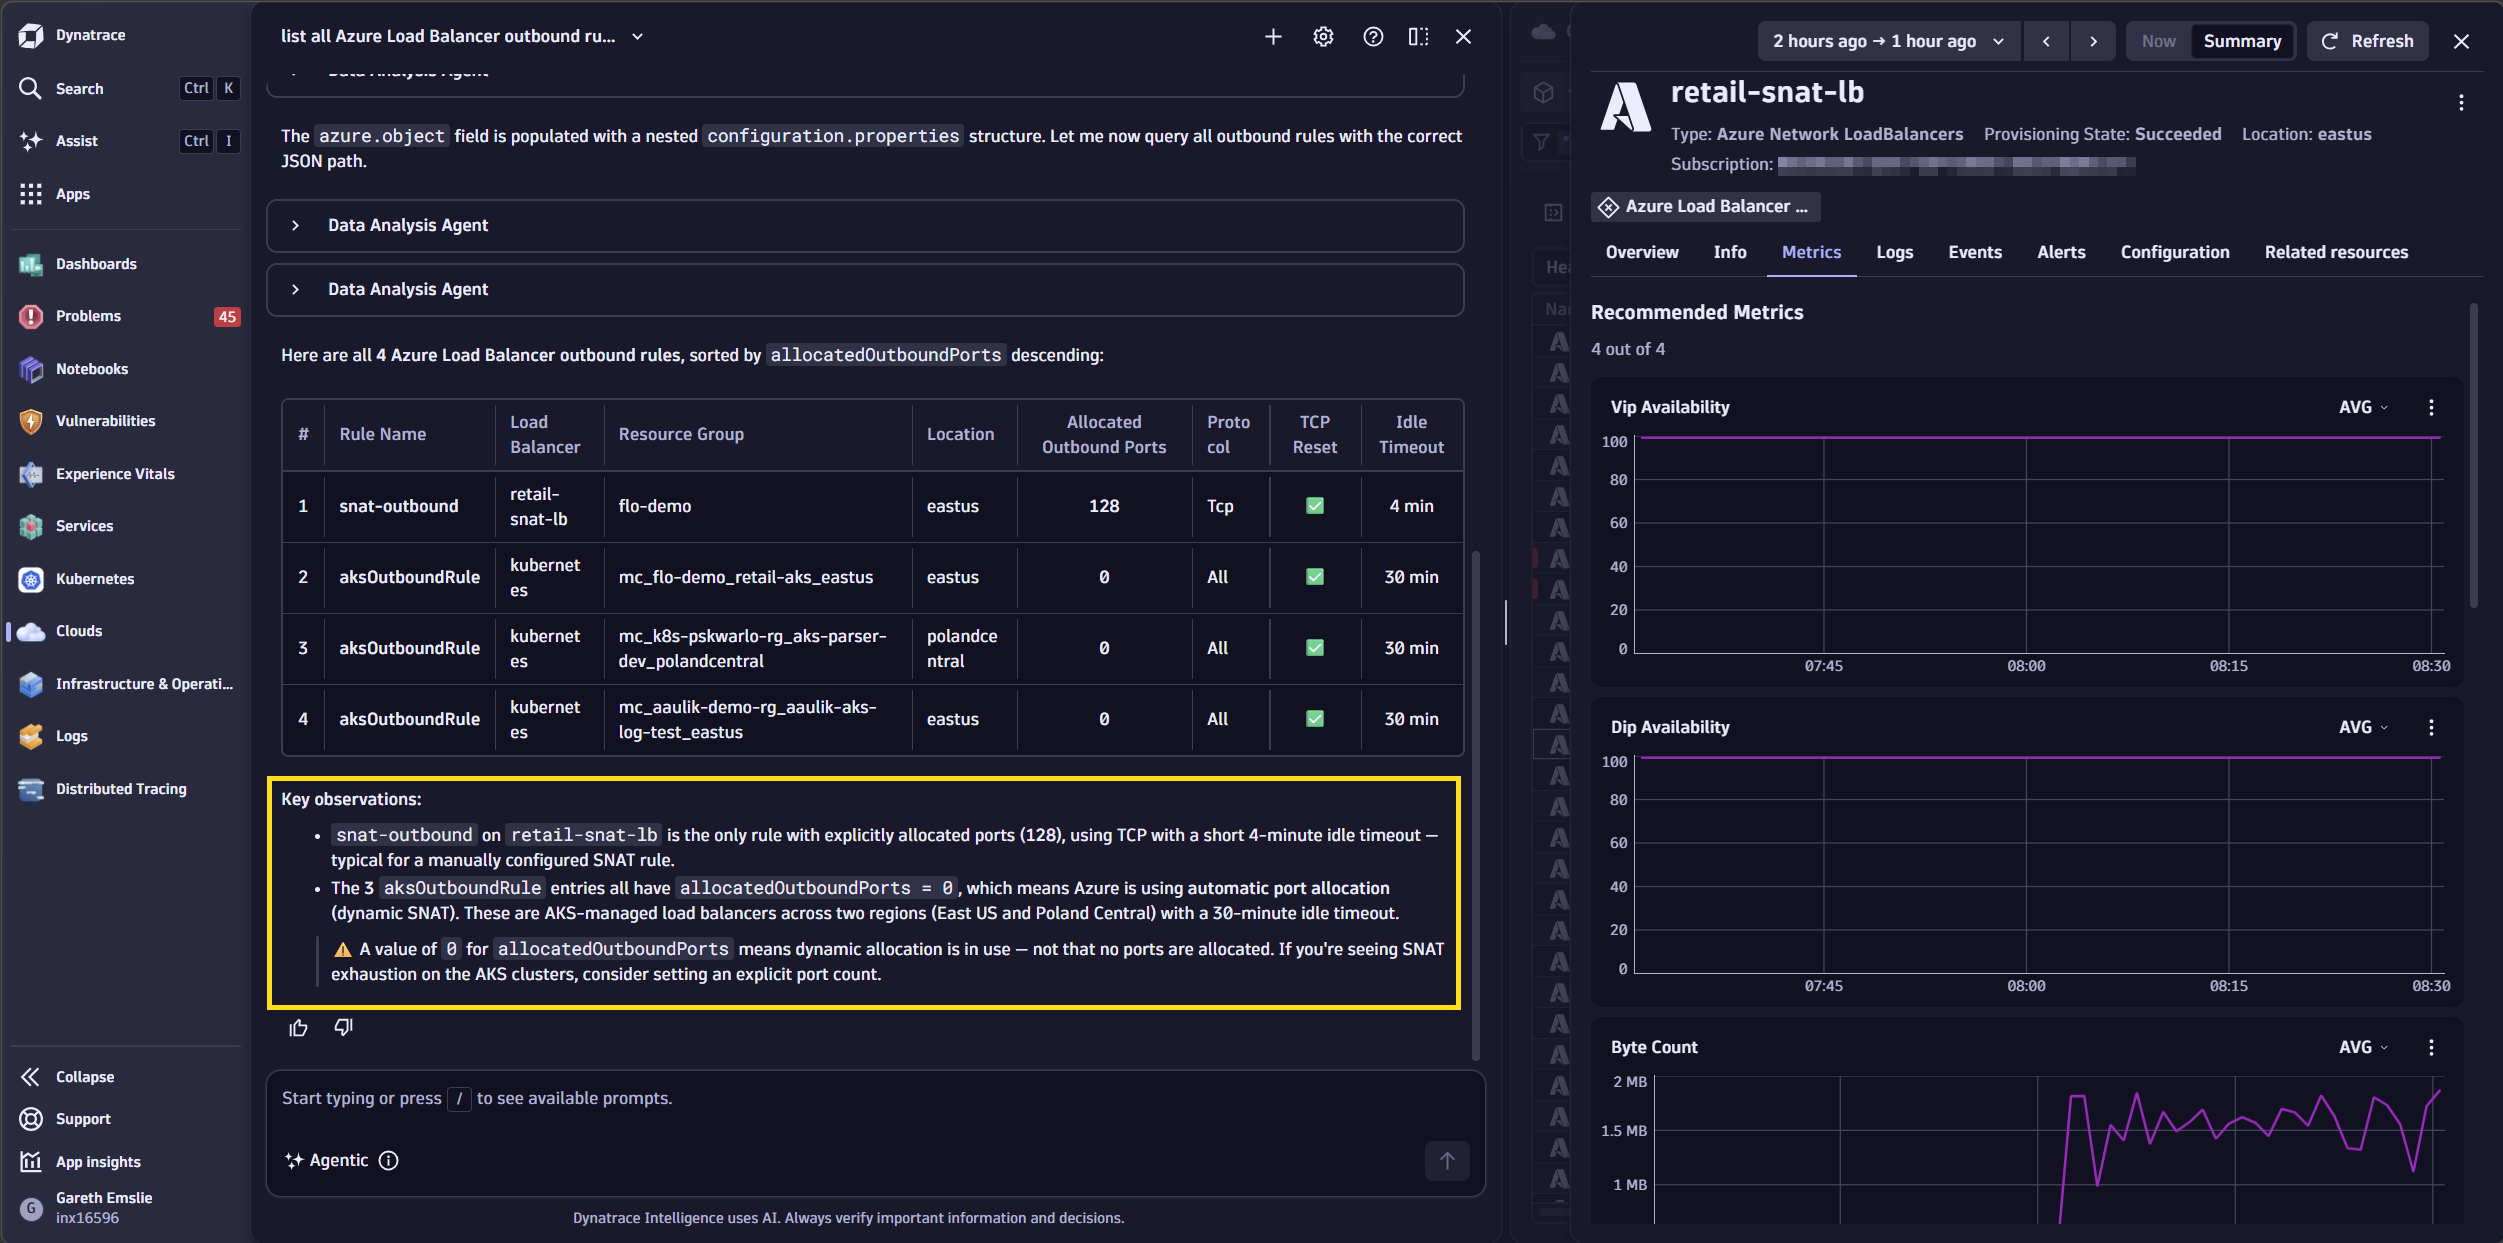
Once these skills are generally available, asking Assist to “list all Azure Load Balancer outbound rules sorted by allocatedOutboundPorts” will generate a DQL query that scans configurations across every connected Azure subscription in seconds — the kind of cross-subscription audit that would take hours of portal hopping. The result instantly surfaces every Load Balancer with details of their SNAT configuration, turning a single resource investigation into an environment-wide remediation sweep.
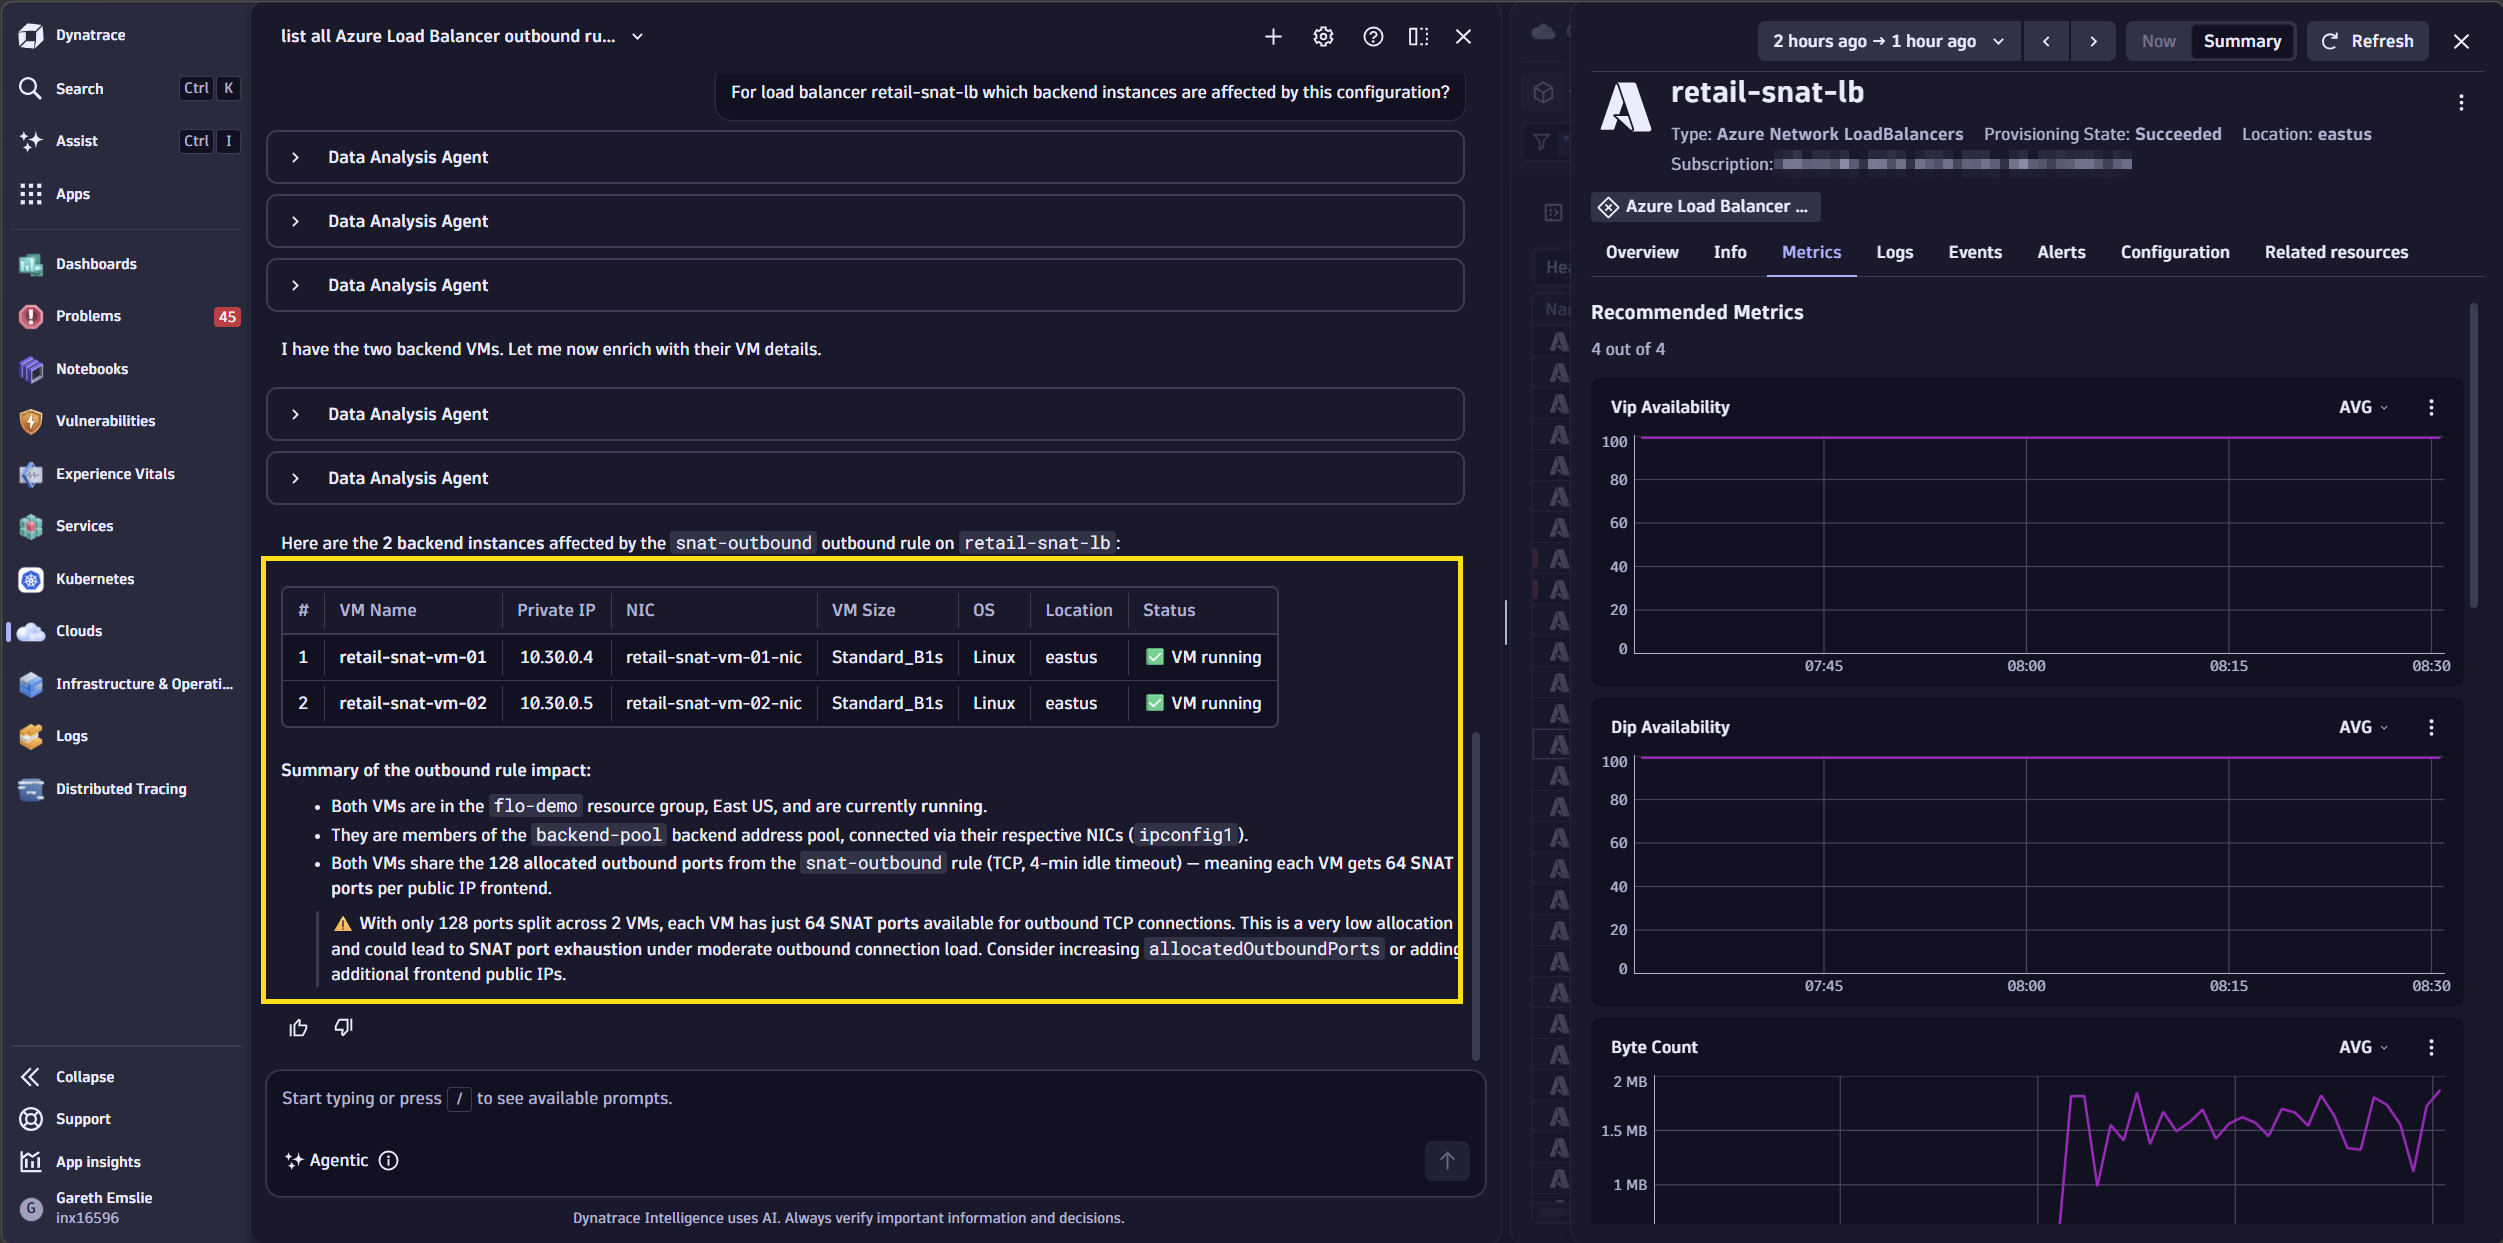
Additionally, you’ll be able to quickly understand which Azure resources are affected for a load balancer that has this custom SNAT configuration applied by asking, “For load balancer retail-snat-lb which backend instances are affected by this configuration?”
“Our Madrid MultiCloud strategy is based on a unified observability office powered by the Dynatrace platform, which allows us to anticipate problems, increase agility, and scale our services. This approach is key to driving the City Council’s digital transformation and delivering better services to citizens. Specifically, Dynatrace Cloud Operations for Azure helps us detect early warning signs, reduce operational noise, and respond automatically when incidents occur, allowing our development teams to focus on the continuous delivery of new features.”
– Mónica Romero Domínguez, Head of Observability and Monitoring, IT Agency at Madrid City Council
Two options, one outcome
Fixing SNAT exhaustion on an Azure Load Balancer is straightforward once you know what you are dealing with.
Option A: Attach a NAT Gateway. A single NAT Gateway with one public IP address provides 64,512 SNAT ports. With multiple IP addresses, you multiply that ceiling further. NAT Gateway completely decouples outbound connectivity from the Load Balancer’s frontend IP allocation and is the recommended pattern for workloads with significant outbound traffic.
Option B: Define explicit outbound rules. If NAT Gateway is not feasible, add explicit outbound rules to the Load Balancer and associate multiple frontend IP addresses. Azure allocates ports proportionally — more frontend IPs means more ports per backend instance.
Either approach will cause the SNAT connection utilization to drop back to baseline. The recovery is visible immediately in the Dynatrace dashboard, and the pre-shipped health alert resolves automatically once utilization falls below the critical threshold.
Azure observability at scale
The investigation above was possible because retail-prod-eastus was already being monitored — not because someone remembered to configure it. Onboarding happens once at the Azure Management Group level, and Dynatrace automatically discovers every subscription beneath it, including subscriptions created after the initial connection. Authentication uses federated credentials: there are no shared secrets to store, rotate, or let expire.
Everything seen during this investigation — the pre-shipped alert, the SNAT metric, the topology, the VM logs — arrived without any Dynatrace components running inside Azure. Metrics, topology, logs, and events are polled directly by the Dynatrace platform. This replaces the previous approach, which required self-hosting the Dynatrace Azure Log Forwarder for log ingestion — a component that needed to be deployed, scaled, and maintained inside each Azure environment.
The SNAT metric that surfaced this problem was available out of the box, part of the Dynatrace curated metric collection set for Azure Load Balancers. Coverage is not limited to what Dynatrace has pre-selected: Auto-discovery can ingest all metrics available for any Azure service, or any Azure Monitor native platform metric can be collected on demand — without waiting for Dynatrace to add explicit support. The resource inventory underlying the Smartscape topology is built from Azure Resource Graph, scanning subscriptions continuously so the entity map reflects the environment as it actually is.
Every ingested signal — metric, log entry, event — is automatically linked to the Smartscape entity representing the Azure resource that produced it. The reason the SNAT spike, the VM timeouts, and the Load Balancer topology appeared together in the same investigation is that they are stored in the same context. There is no join to write, no dashboard to cross-reference. The data arrives pre-correlated.
Smartscape®, Grail™, and the Dynatrace logo are trademarks of the Dynatrace, Inc. group of companies. All other trademarks are the property of their respective owners.


Looking for answers?
Start a new discussion or ask for help in our Q&A forum.
Go to forum