
This blog post looks at how Dynatrace automatically collects OpenAI/GPT model requests and charts them within Dynatrace, as well as how abnormal service behavior can be used to identify slowdowns in OpenAI/GPT requests as the root cause of large-scale issues. Both functionalities have been part of the Dynatrace platform for a couple of years already, and so have withstood the challenges of customer usage.
AI observability is becoming imperative as businesses in all sectors are introducing novel approaches to innovate with generative AI in their domains. Advanced AI applications using OpenAI services don’t just forward user input to OpenAI models; they also require client-side pre- and post-processing. A typical design pattern is the use of a semantic search over a domain-specific knowledge base, like internal documentation, to provide the required context in the prompt. This is achieved by using OpenAI services to compute numerical representations of text data that ease the computation of text similarity, called “embeddings,” for the documents as well as for the user input.
Furthermore, tools like LangChain leverage large language models (LLM) as one of their basic building blocks for creating AI agents (think of AI agents as APIs that perform a series of chat interactions that target a desired outcome) which perform complex and potentially large queries against an LLM like GPT-4. They then connect to third-party services such as online calculators, web search, or flight status information to combine real-time information with the power of an LLM.
One of the crucial success factors for delivering cost-efficient and high-quality AI-agent services following the approach described above is using AI observability to closely observe their cost, latency, and reliability.
Dynatrace enables enterprises to automatically collect, visualize, and alert on OpenAI API request consumption, latency, and stability information in combination with all other services that are used to build AI applications. This includes OpenAI as well as Azure OpenAI services, such as GPT-3, Codex, DALL-E, or ChatGPT.
AI observability example: OpenAI token consumption
Our example dashboard below visualizes OpenAI token consumption. It shows critical SLOs for latency and availability, as well as the most important OpenAI generative AI service metrics, such as response time, error count, and the overall number of requests.
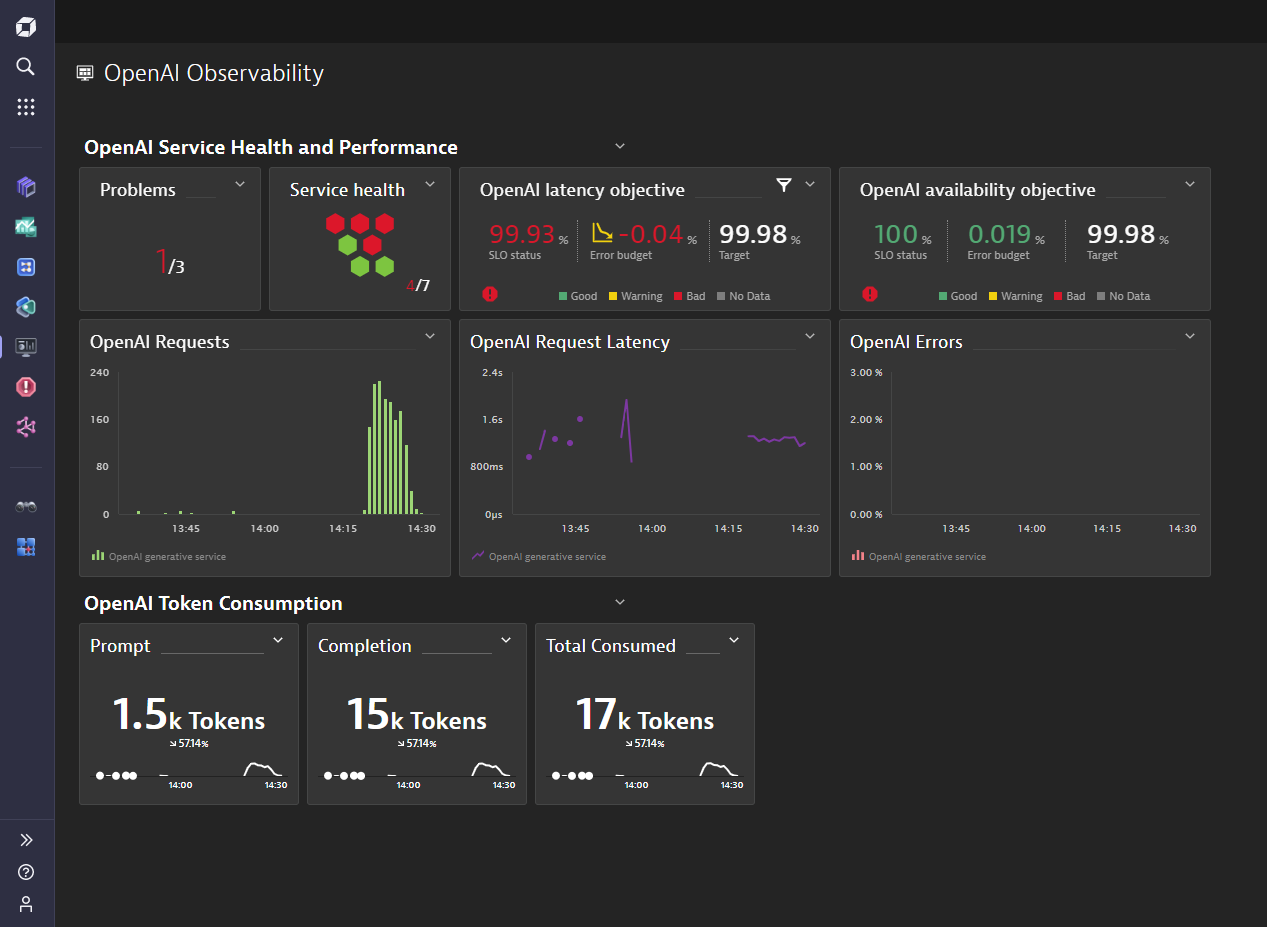
Dynatrace OneAgent® discovers, observes, and protects access to OpenAI automatically, with no manual configuration, revealing the full context of used technologies, service interaction topology, security-vulnerability analysis, and the observability of all metrics, traces, logs, and business events in real time.
How Dynatrace traces OpenAI model requests
Let’s use a simple NodeJS example service to show how Dynatrace OneAgent automatically traces OpenAI model requests. OpenAI offers an official NodeJS language binding that allows the direct integration of a model request by adding the following lines of code to your own NodeJS AI application:
const { Configuration, OpenAIApi } = require("openai");

const configuration = new Configuration({

apiKey: process.env.OPENAI_API_KEY

});

const openai = new OpenAIApi(configuration);

const response = await openai.createCompletion({

model: "text-davinci-003",

prompt: "Say hello!",

temperature: 0,

max_tokens: 10,

});
Once the AI application is started on a OneAgent-monitored server, the application is automatically detected, and the traces and metrics for all outgoing requests are collected. OneAgent automatic injection of monitoring and tracing code works not only for the NodeJS language binding but also when using the raw HTTPS request in NodeJS. While OpenAI offers official language bindings only for Python and NodeJS, there is a long list of community-provided language bindings.
OneAgent can automatically monitor all C#, .NET, Java, Go, and NodeJS bindings. However, we recommend following the OpenTelemetry approach to monitoring Python with Dynatrace.
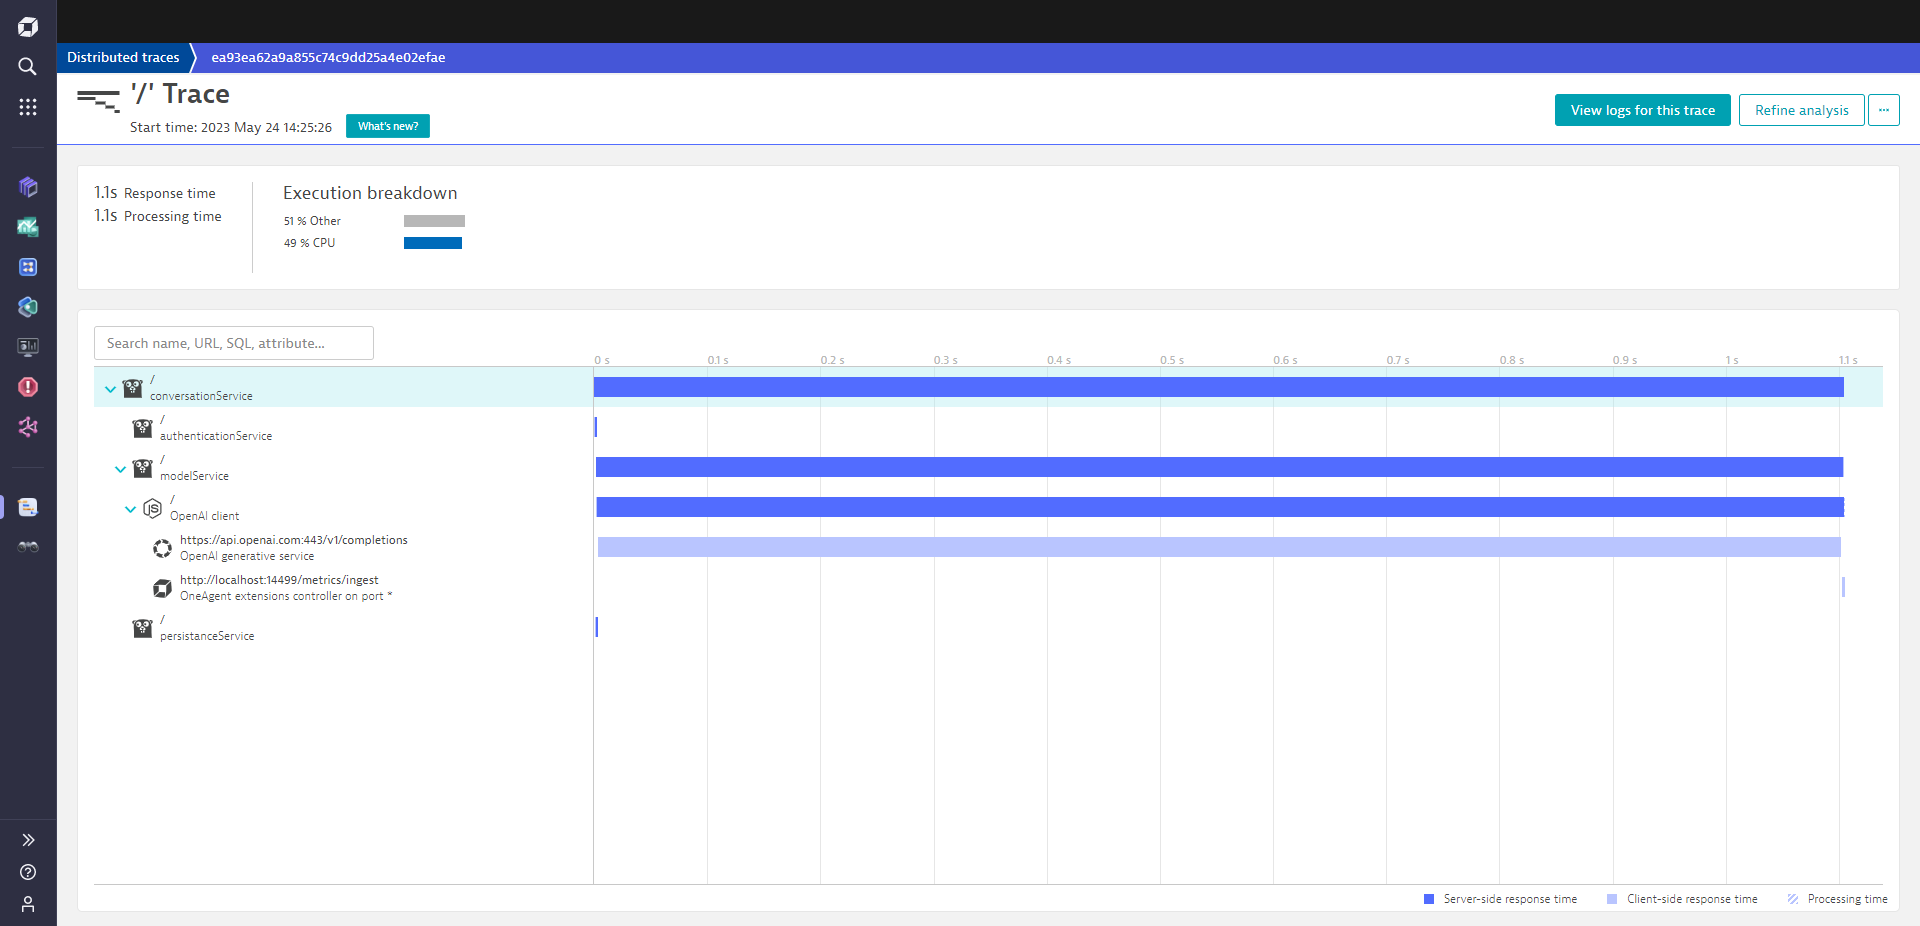
The screenshot below shows the traces that OneAgent collects, along with all the latency and reliability measurements for each of the outgoing GPT model requests.
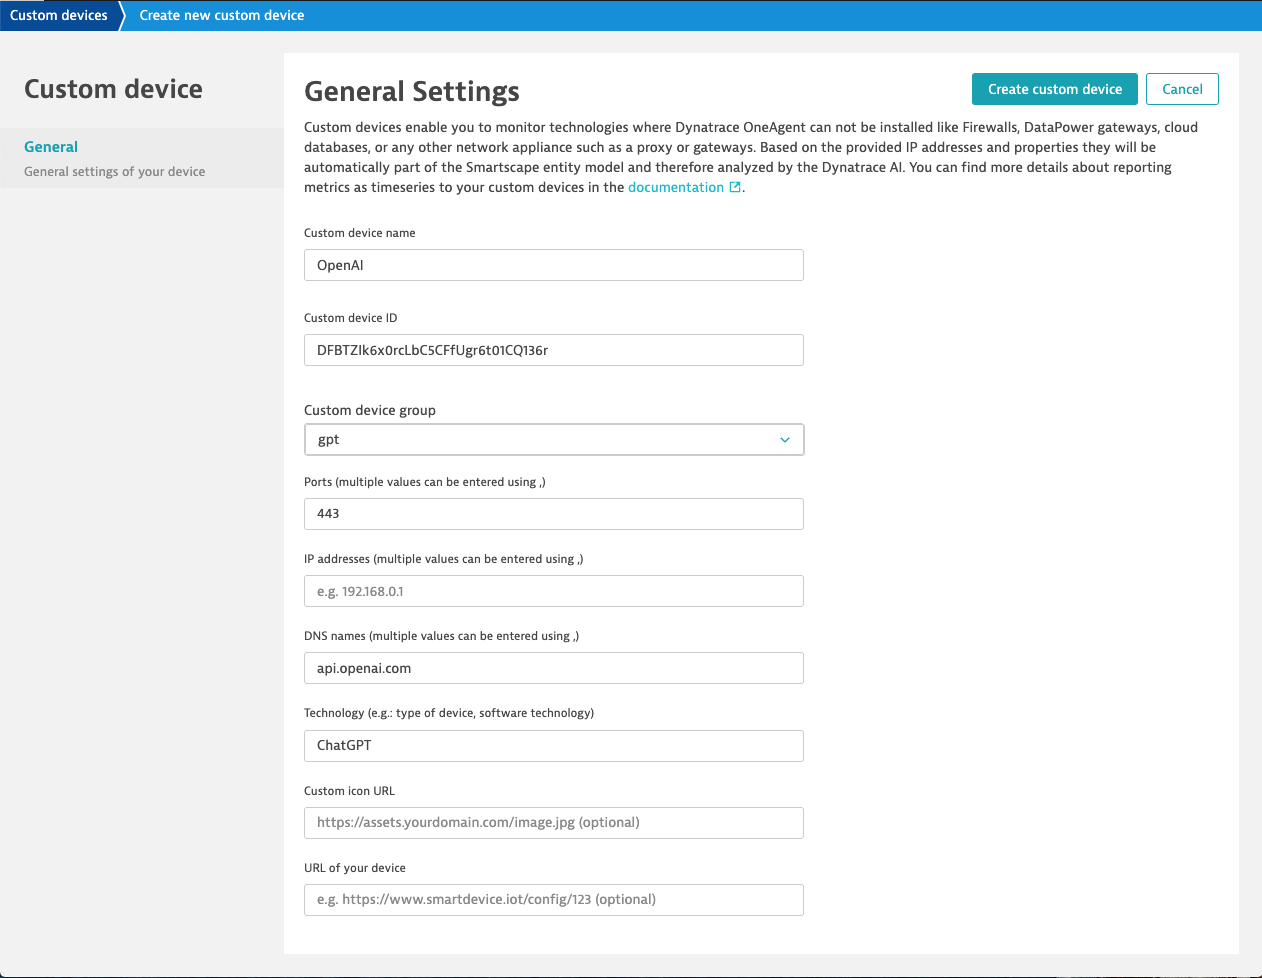
Dynatrace further refines the OpenAI calls by automatically splitting specific services for the OpenAI domain, as shown below.
Once this is done, the Dynatrace Service Flow shows the flow of your requests, starting with your NodeJS service and calling the OpenAI model, as shown below.
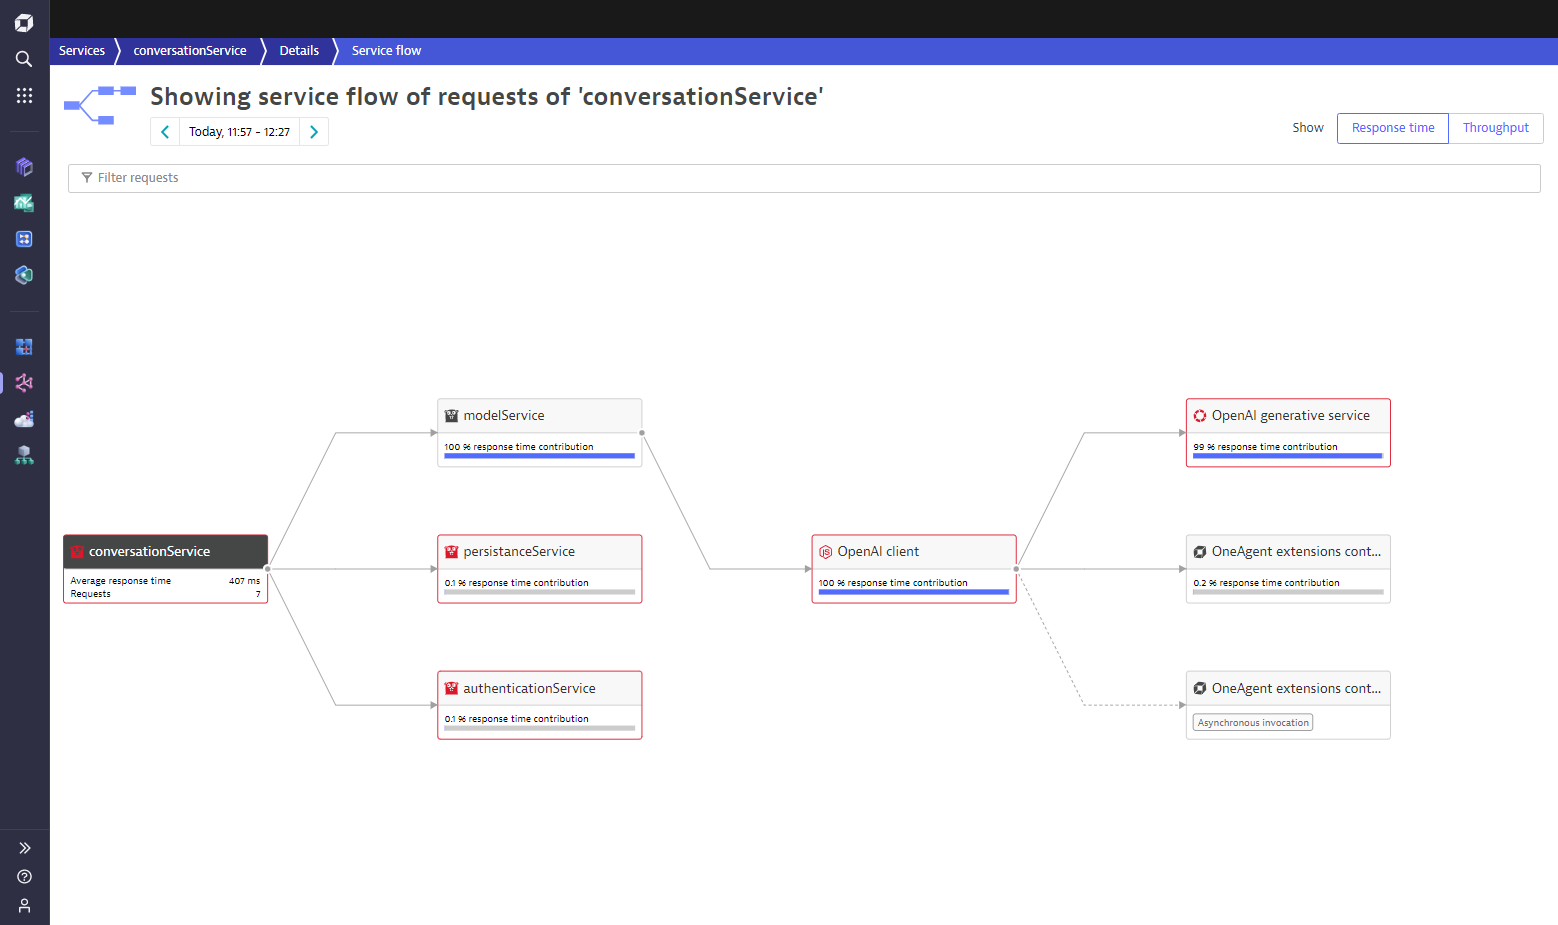
As shown in the example above, Dynatrace OneAgent automatically collects all latency and reliability-related information along with all the traces showing how your OpenAI requests traverse your service graph.
The seamless tracing of OpenAI model requests allows operators to identify behavioral patterns within their AI service landscape and to understand the typical load situation of their infrastructure.
This AI observability knowledge is essential for further optimizing the performance and cost of services.
By adding some lines of manual instrumentation to a NodeJS service, cost-related measurements are also picked up by OneAgent, collecting the number of OpenAI conversational tokens used.
Observing OpenAI request cost
Each request to an OpenAI model, such as text-davinci-003, gpt-3.5-turbo, or GPT-4 reports back how many tokens were used for the request prompt (the length of your text question) and how many tokens the model generated as a response.
OpenAI customers are billed based on the total number of tokens consumed by all the requests they make. By extracting these token measurements from the returning payload and reporting them through Dynatrace OneAgent, users can observe token consumption across all OpenAI-enhanced services in their monitoring environment.
Here is the instrumentation used to extract the token count from the OpenAI response and to report the three measurements to the local OneAgent:
function report_metric(openai_response) {
var post_data = "openai.promt_token_count,model=" + openai_response.model + " " + openai_response.usage.prompt_tokens + "\n";
post_data += "openai.completion_token_count,model=" + openai_response.model + " " + openai_response.usage.completion_tokens + "\n";
post_data += "openai.total_token_count,model=" + openai_response.model + " " + openai_response.usage.total_tokens + "\n";
console.log(post_data);
var post_options = {
host: 'localhost',
port: '14499',
path: '/metrics/ingest',
method: 'POST',
headers: {
'Content-Type': 'text/plain',
'Content-Length': Buffer.byteLength(post_data)
}
};
var metric_req = http.request(post_options, (resp) => {}).on("error", (err) => { console.log(err); });
metric_req.write(post_data);
metric_req.end();
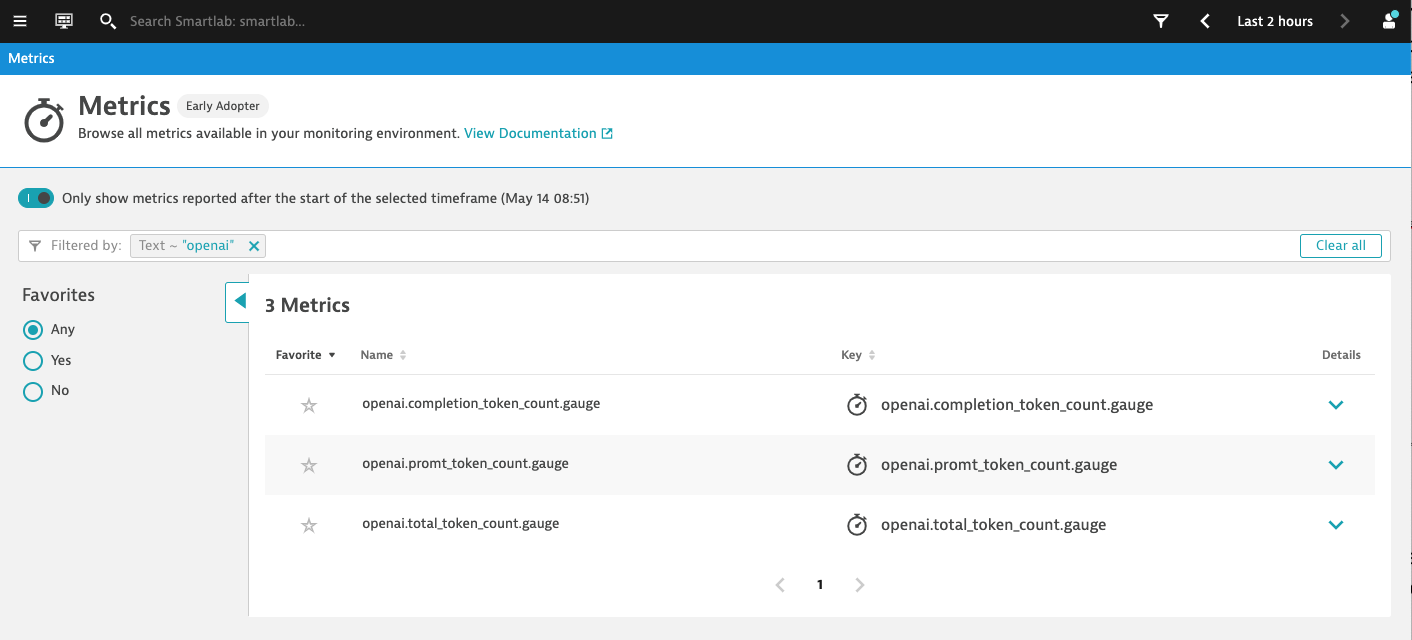
}After adding these lines to your NodeJS service, three new OpenAI token consumption metrics are available in Dynatrace, as shown below.
Davis AI automatically detects ChatGPT as the root-cause
One of the superb features of Dynatrace is Davis® AI, which automatically learns the typical behavior of monitored services. Once an abnormal slowdown or increase of errors is detected, Davis AI triggers root cause analysis to identify the cause.
Our simple example of a NodeJS service entirely depends on the ChatGPT model response. So, whenever the latency of the model response degrades or the model request returns an error, Davis AI automatically detects it.
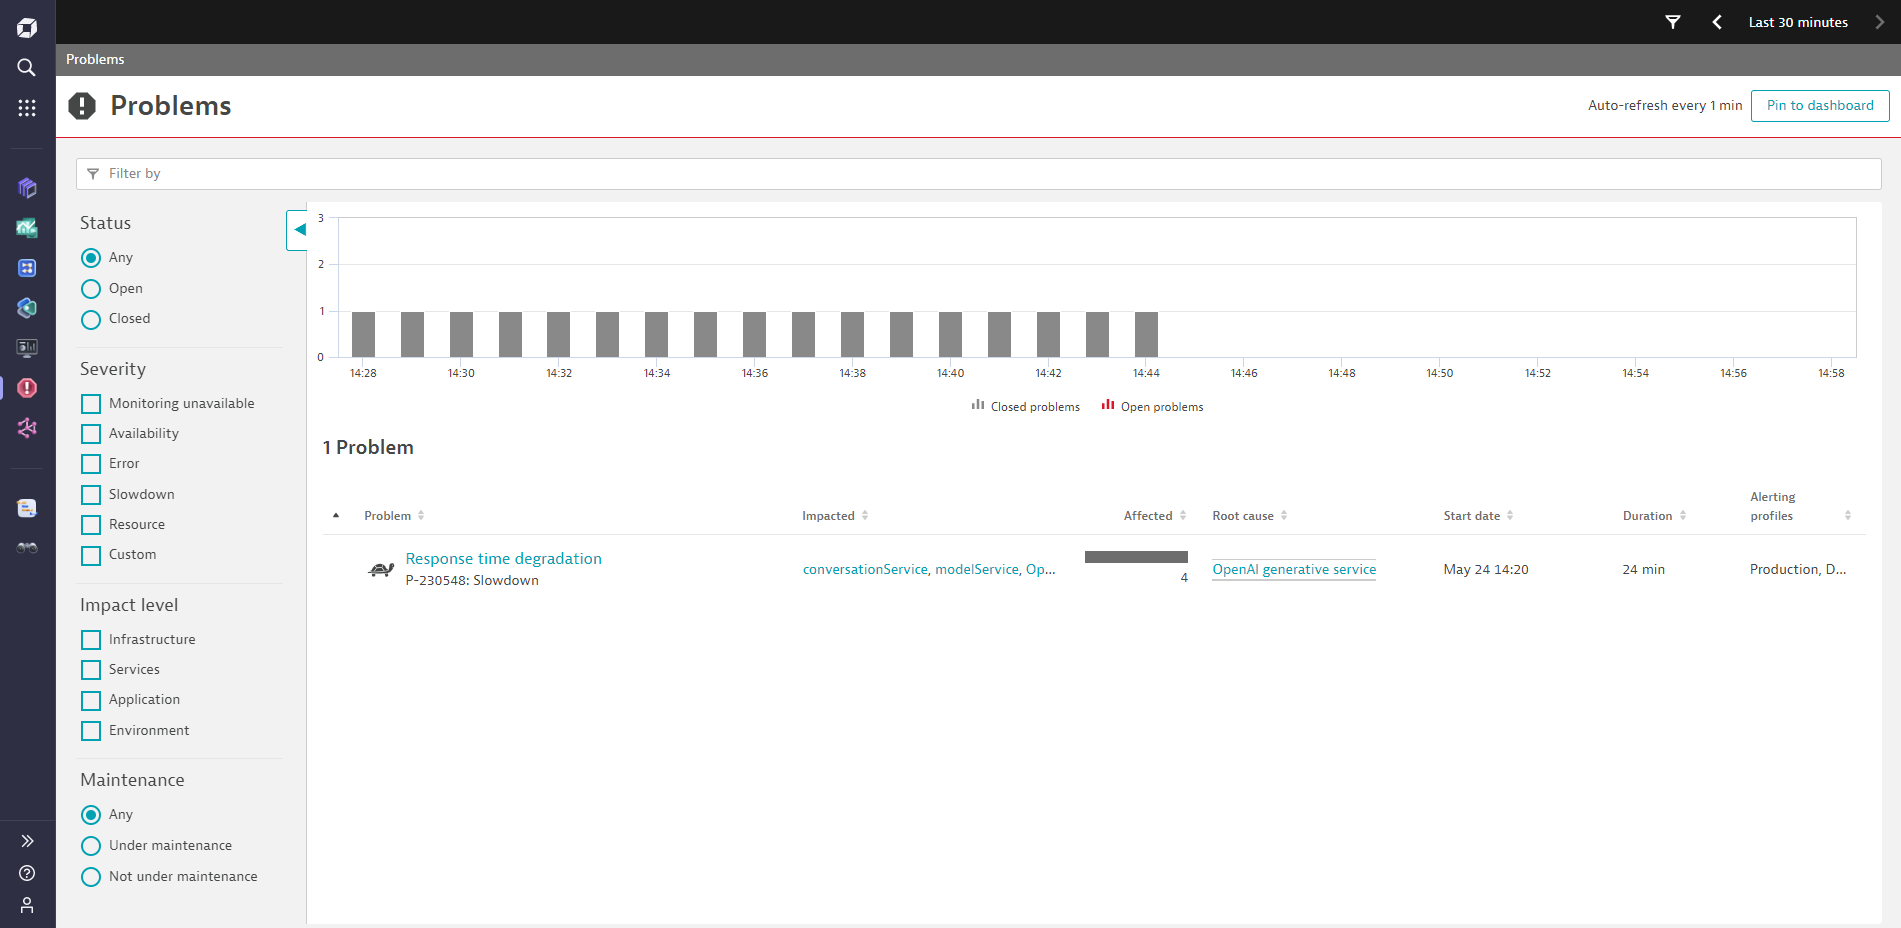
In the example below, Davis AI automatically reported a slowdown of the NodeJS prompt service and correctly detected the OpenAI generative service as the root cause of the slowdown.
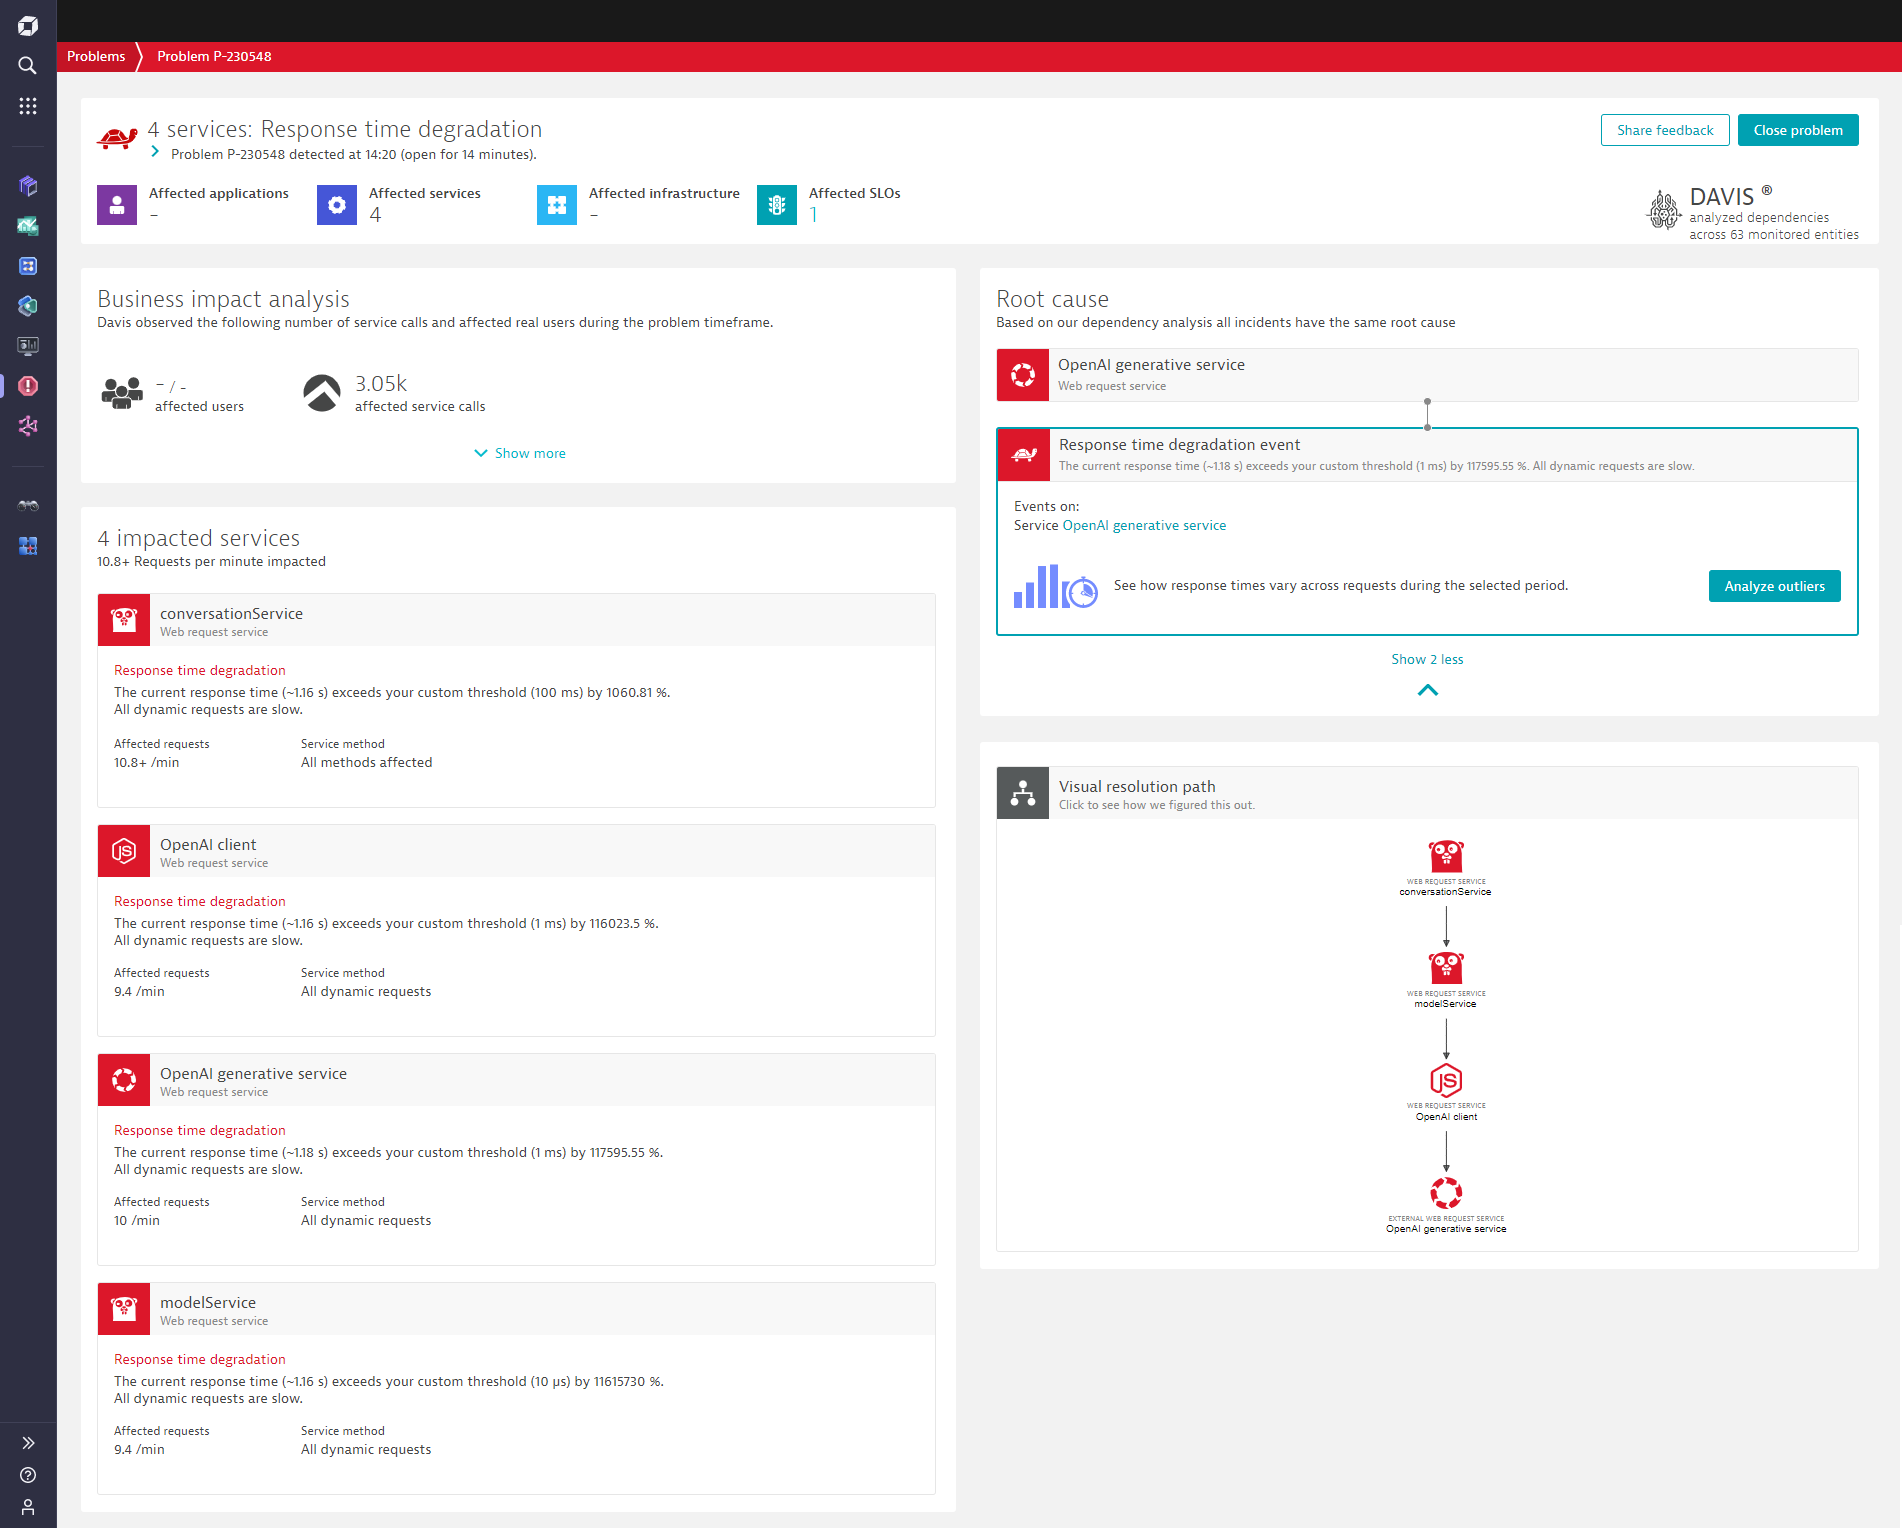
The Davis problem details page shows all affected services for which the OpenAI generative service was the root cause of the slowdown, along with the ripple effects of the slowdown.
The problem details also list all Service Level Objectives that were negatively impacted by the slowdown.
AI observability with Dynatrace brings peace of mind when using OpenAI models
The massive popularity of generative AI cloud services, such as OpenAI’s GPT-4 model, is forcing companies to rethink and redesign their existing service landscapes. Integrating generative AI into traditional service landscapes comes with all kinds of uncertainties. Using AI observability from Dynatrace to observe OpenAI cloud services helps you gain cost transparency and ensure the operational health of your AI-enhanced services.
Also, full transparency and observability of AI services will play a significant role in upcoming AI regulations at a national level and for risk assessments within your own company.
For further details, you can view the full source of the NodeJS service on GitHub.


Looking for answers?
Start a new discussion or ask for help in our Q&A forum.
Go to forum