
Every software development team grappling with Generative AI (GenAI) and LLM-based applications knows the challenge: how to observe, monitor, and secure production-level workloads at scale. Traditional debugging approaches, logs, and occasional remote breakpoint instrumentation can’t easily keep pace with cloud-native AI deployments, where performance, compliance, and costs are all on the line. How can you gain insights that drive innovation and reliability in AI initiatives without breaking the bank?
Dynatrace helps enhance your AI strategy with practical, actionable knowledge to maximize benefits while managing costs effectively.
Amazon Bedrock, equipped with Dynatrace Davis® AI and LLM observability, gives you end-to-end insight into the Generative AI stack, from code-level visibility and performance metrics to GenAI-specific guardrails.
Developers deserve a frictionless troubleshooting experience and fast access to real-time data—no more guesswork or costly redeployments. Here’s how Dynatrace, combined with Amazon Bedrock, arms teams with instant intelligence from dev to production, helping to accelerate innovation while keeping performance, costs, and compliance in check.
Introducing Amazon Bedrock and Dynatrace Observability
Amazon Bedrock is a serverless service for building and scaling Generative AI applications easily with foundation models (FM). It provides an easy way to select, integrate, and customize foundation models with enterprise data using techniques like retrieval-augmented generation (RAG), fine-tuning, or continued pre-training.
Dynatrace is an all-in-one observability platform that automatically collects production insights, traces, logs, metrics, and real-time application data at scale. With powerful Davis AI engine Dynatrace notifies teams about production-level issues before they disrupt users, helps predict resource usage,costs, and performance issues, and delivers guardrails that protect data and maintain compliance.
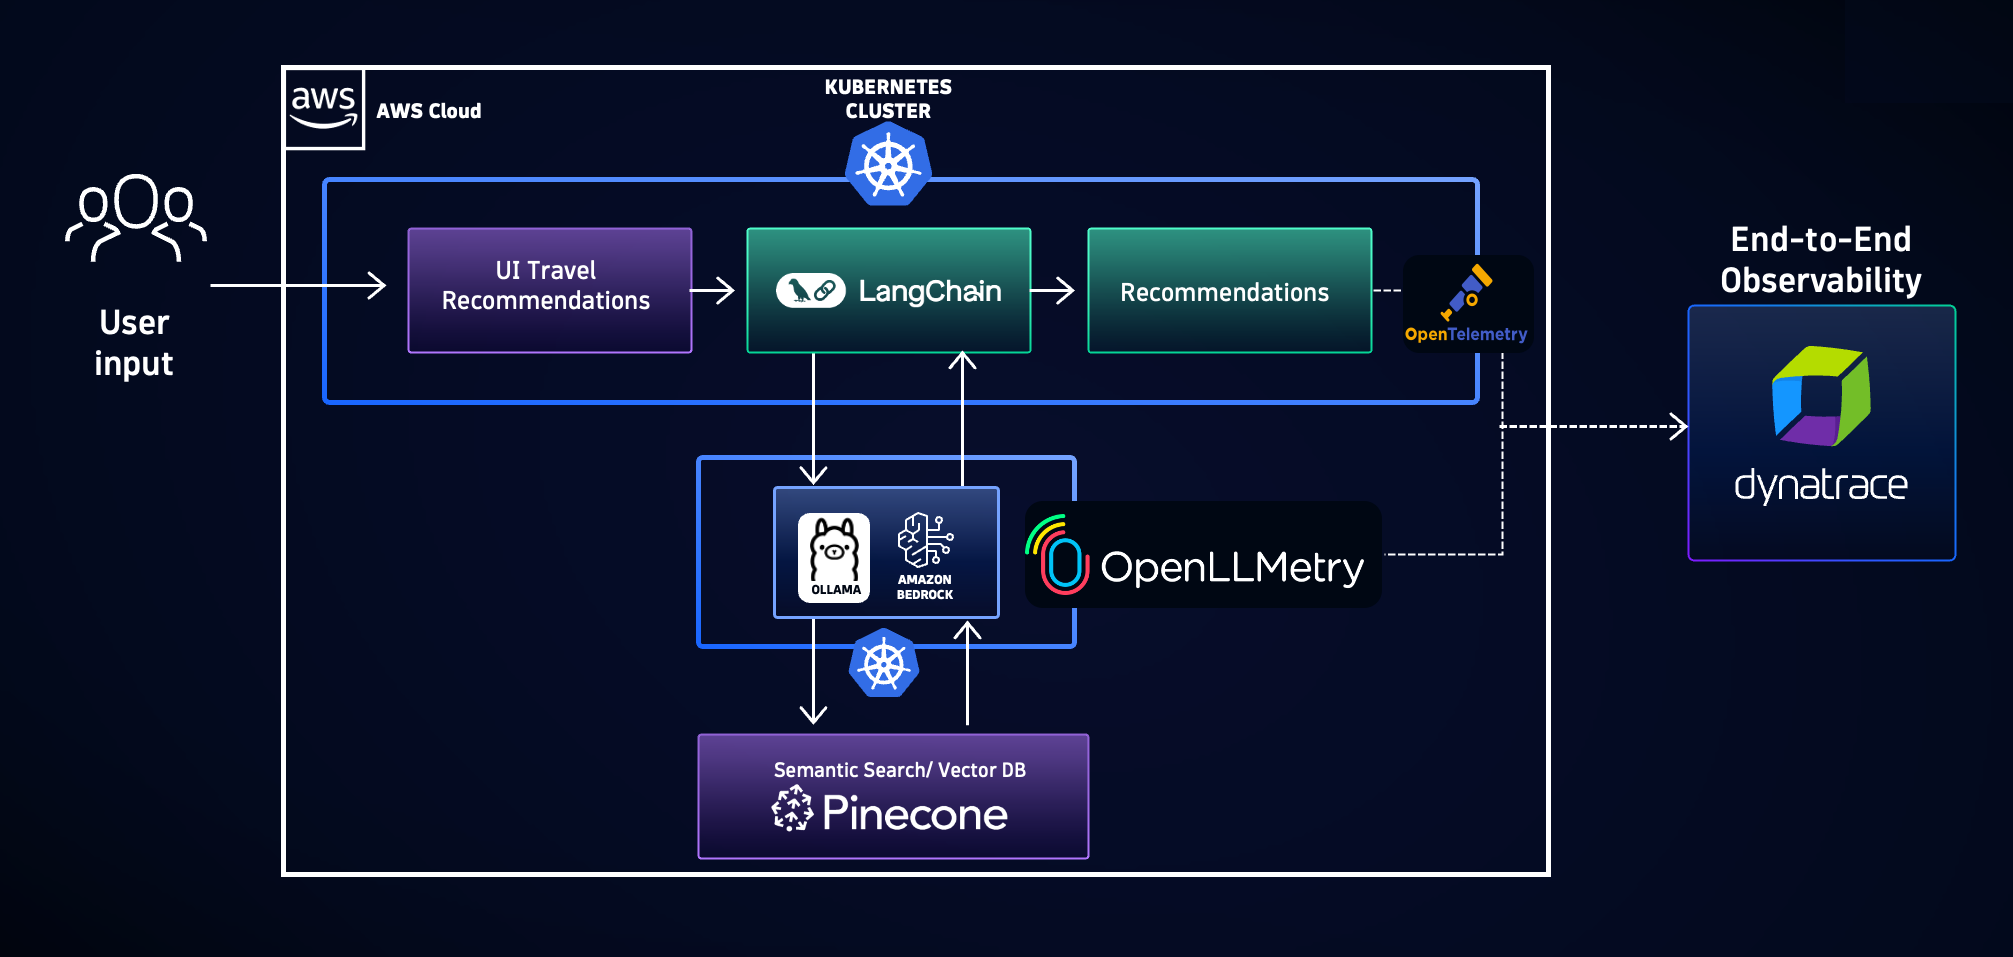
Together, Amazon Bedrock and Dynatrace provide an end-to-end observability solution for AI applications:
- Predictive operations: Proactive usage and cost forecasting to reduce unexpected operational expenses and token usage.
- Production performance monitoring: Service uptime, service health, CPU, GPU, memory, token usage, and real-time cost and performance metrics.
- Guardrail analysis: Detect hallucinations, track prompt injections, mitigate PII leakage, and ensure brand-safe outputs.
- Full-stack tracing: Track each user request across multiple FMs, vector databases, orchestrators (LangChain), and custom business logic.
- Compliance: Document all inputs and outputs, maintaining full data lineage from prompt to response to build a clear audit trail and ensure compliance with regulatory standards.

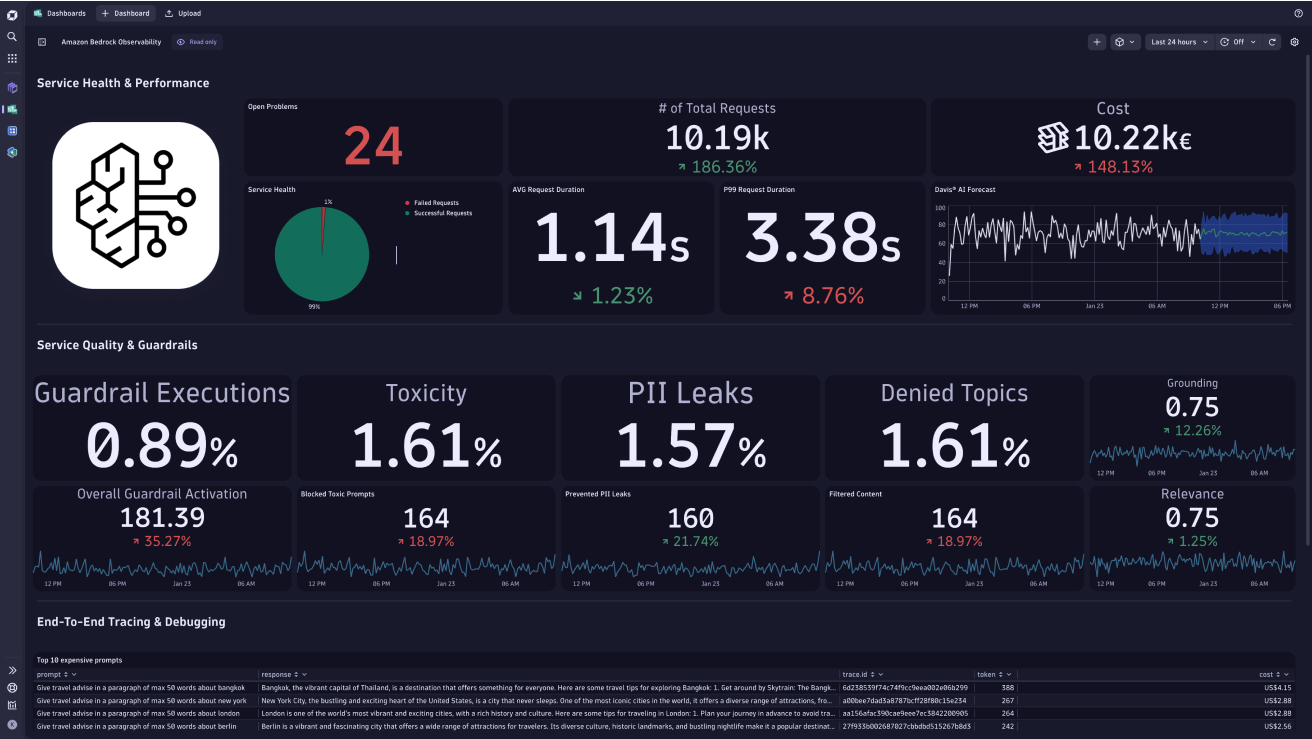
Figure 1. Video overview of Amazon Bedrock dashboard with Dynatrace AI and LLM Observability solution.
How it works
Dynatrace seamlessly instruments your LLM-based workloads using Traceloop OpenLLMetry, which augments standard OpenTelemetry data with AI-specific KPIs (for example, token usage, prompt length, and model version).
Combined with Amazon Bedrock, you can:
- Spin up your AI model on Amazon Bedrock—choose from providers like AI21, Anthropic, Cohere, Stability AI, Mistral AI, Meta, or Amazon’s own Nova/Titan foundation models.
- Automatically instrument your application with OpenTelemetry.
- Configure OpenLLMetry to capture specialized LLM details as spans and metrics, like model name, completion time, token count, token cost, and prompt text.
- Send unified data to Dynatrace for analysis alongside your logs, metrics, and traces.
Behind the scenes, Dynatrace merges the standard telemetry with these advanced AI attributes, surfaces them in real-time dashboards, and applies AI-driven analytics to discover anomalies, forecast usage costs, and diagnose root causes.
How to set up and instrument your data with OpenLLMetry
Traceloop OpenLLMetry is an open source extension that standardizes LLM and Generative AI data collection. By layering on top of OpenTelemetry standards, OpenLLMetry captures the critical metrics you can’t get by default—like the number of tokens, model temperature, or guardrail triggers.
Here’s how to set it up for Amazon Bedrock:
- Install OpenLLMetry in your Python or Node.js environment:
pip install traceloop-sdk
from traceloop.sdk import Traceloop

headers = {

'Authorization': f"Api-Token {environ.get('DYNATRACE_TEAM_KEY')}"

}

Traceloop.init(

app_name=environ.get('DYNATRACE_APP_NAME'),

api_endpoint=environ.get('DYNATRACE_URL'),

headers=headers

)- Configure environment variables to send data to Dynatrace via your ingest token:
 DYNATRACE_URL =https://123abcde.live.dynatrace.com/api/v2/otlp

DYNATRACE_TEAM_KEY=dt0.....- You can optionally add OpenLLMetry decorators or instrumentation to your LLM calls (for example, with LangChain or direct Bedrock SDK calls).
When your application queries Amazon Bedrock, OpenLLMetry automatically captures:
- Prompt tokens vs. completion tokens
- Finish reason (did the LLM stop due to a user request, or was the max token limit reached?)
- Model type (which Amazon foundation model or third-party model is used?)
- Performance: Response time, throughput, and error rate
- Guardrail activations: Toxicity, PII, denied topics, and hallucinations
- System, prompt, and completion messages and roles
This data is instantly correlated in Dynatrace so you can visualize or alert on critical thresholds (for example, if your average token usage spikes or your overall cost forecast grows beyond budget).
How to debug incorrect responses in production
Let’s walk through a real-world scenario:
Your production travel agent application—powered by Amazon Bedrock and Dynatrace—gives users incorrect travel recommendations. Perhaps it suggests flights or hotels that don’t exist or mixes up time zones. This isn’t just a minor inconvenience; it jeopardizes user experience and can directly impact revenue and trust.
Here’s how Dynatrace helps you trace and resolve the issue quickly:
Proactive alerting with Davis AI
You receive an alert from Dynatrace Davis AI anomaly detection indicating incorrect system behavior. There might be a spike in “incorrect itinerary” complaints or conversation outcomes flagged as “nonsensical.” Davis AI correlates the unusual LLM responses with application telemetry and usage patterns, so you immediately know something is off in the recommendation flow.
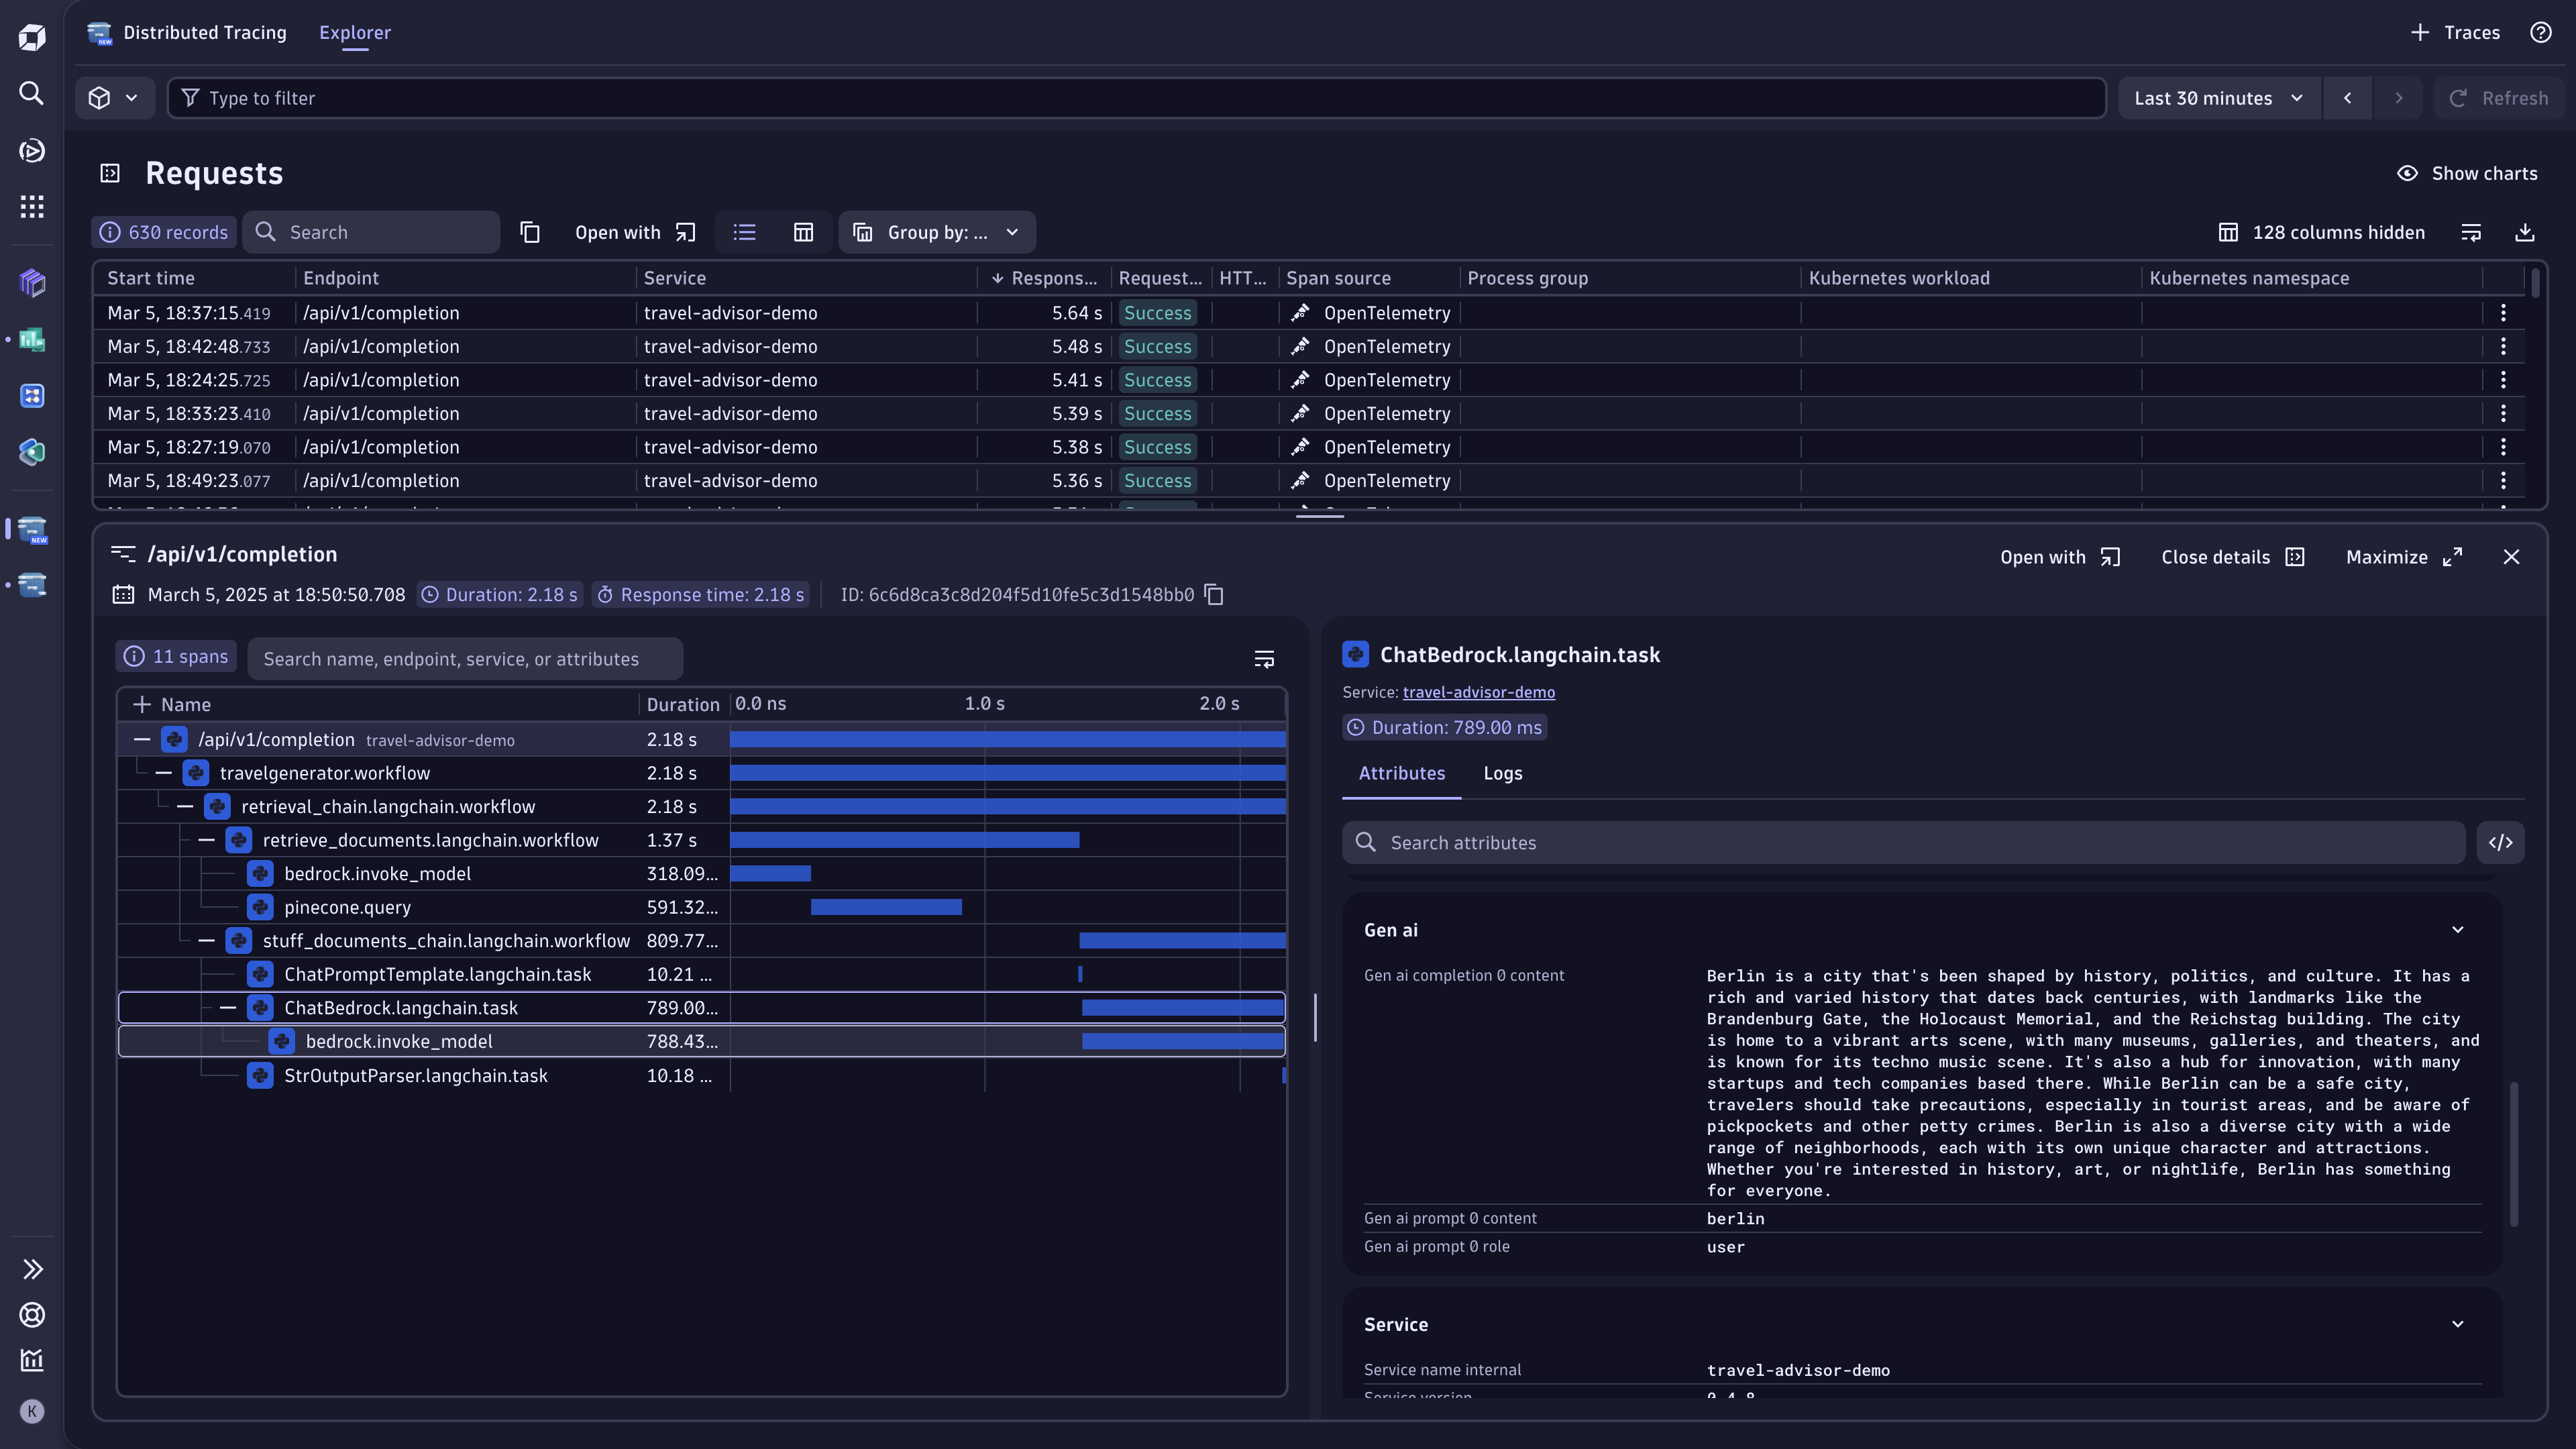
Full-stack end-to-end tracing
In Dynatrace Distributed Tracing, you see the entire transaction trace for the affected user session. This includes front-end requests, back-end aggregator logic, calls to Amazon Bedrock, and any vector database lookups performed for retrieval-augmented generation (RAG). Rather than sifting through multiple logs, you have a single timeline that reveals exactly where the LLM call returned unexpected data.
Inspecting the GenAI model details
By drilling down into the span data enriched by OpenLLMetry, you can see:
- Prompt and completion text and tokens used.
- The specific foundation model version (for example, anthropic.claude-v1 or amazon.nova).
- Temperature setting and max token limits.
- Any error codes or guardrail triggers.
This clarity helps you pinpoint if the model produces off-base recommendations because of a misaligned temperature, an out-of-date context, or a mismatch in user inputs.
Root cause analysis
With Dynatrace, you quickly correlate the LLM anomaly to a specific function in your microservice code. You discover that an external data source used for itinerary validation had missing or stale updates, causing the LLM prompt to reference invalid flights. You’ve found the “why” without manually spelunking logs in disparate systems.
Resolving and validating
A fix might involve updating your data pipeline or refining the prompt logic. You can deploy the change and watch in near real-time as Dynatrace collects new traces and logs. Davis AI recognizes that the anomaly is cleared, confirming that your fix resolved the incorrect responses—no guesswork required.
You can find the code example for our travel agent application here for review, and the dashboard on our Dynatrace Playground instance.
Summary
By integrating Amazon Bedrock with Dynatrace end-to-end observability, you not only catch issues early but also trace them across your entire AI stack to the root cause. Building or scaling Generative AI applications with Amazon Bedrock requires robust insights into your environment—from model usage and performance metrics to cost forecasts and guardrail efficacy.
Dynatrace helps you scale with:
- Complete end-to-end tracing across your services, external data pipelines, and LLM calls.
- Predictive analytics that forecast AI resource usage and cost trends, letting you proactively manage budgets.
- Unified dashboards that bring performance, cost, code-level data, logs, metrics, and audit events together.
- Compliance and governance that integrate security checks, data masking, and guardrail analysis.
Whether you’re a developer racing to put your latest AI-powered application or a new feature into production or an SRE ensuring your system meets enterprise-grade SLAs, Dynatrace and Amazon Bedrock help you to create frictionless AI applications, focusing on performance and observability—at any scale, in production, with no downtime.


Looking for answers?
Start a new discussion or ask for help in our Q&A forum.
Go to forum