
Modern IT systems operate under constant pressure to deliver efficiency, resilience, security, agility, and business alignment simultaneously. That balance isn’t achieved overnight; it’s built through continuous improvement driven by learning and insight. This is where exploratory analytics becomes essential: analytics help you probe deeper, ask sharper questions, uncover patterns, anticipate issues, and optimize resources. With the Grail® unified data lakehouse, all live production data is unified in context and ready to explore. Discover the enhanced Dynatrace analytics app portfolio and see how embedding exploration into your processes requires little effort yet delivers transformative results.
Spark continuous improvement by making data exploration a habit
In practice, exploration often stalls. Logs live in one tool, metrics in another, traces somewhere else, and the broader business context lives with different teams. Answering a single question, such as “Did this pattern exist before the last release?” can mean switching contexts, running separate queries, and manually correlating results. The friction builds, and a deeper investigation is deferred until the next incident forces it.
There is more than one kind of exploration. Sometimes exploration is structured: embedded within workflows as part of postmortems, release validations, or SLO reviews, tracing signals across logs, metrics, traces, events, and business data to link impact to outcomes and prevent repeat failures. Other times, exploration is curiosity-driven: a quieter moment where you notice a memory pattern tied to a batch job, a timeout spike with specific clients, or a cloud spend anomaly you’d never have caught in a scheduled report.
Both of these exploration modes matter. Together, they foster learning and a culture of continuous improvement, both essential to modern enterprises.
Dynatrace Grail, a unified data lakehouse, makes exploration easy and rewarding: a single place for all your live production data across logs, metrics, traces, events, business, and security data, so you can follow the evidence wherever it leads without rigid queries or manual joins. With Dynatrace Query Language (DQL), every field and relationship is at your fingertips, enabling broad searches, contextual pivots, precise slicing, and rapid iteration to test and discard weak hypotheses.
Dynatrace Intelligence® makes exploration accessible to everyone. Use Assist to query and explore your data in natural language, or get support in interpreting and understanding your findings. Leverage AI-powered analysis to detect patterns and anomalies at scale, or forecast trends to predict future behavior.
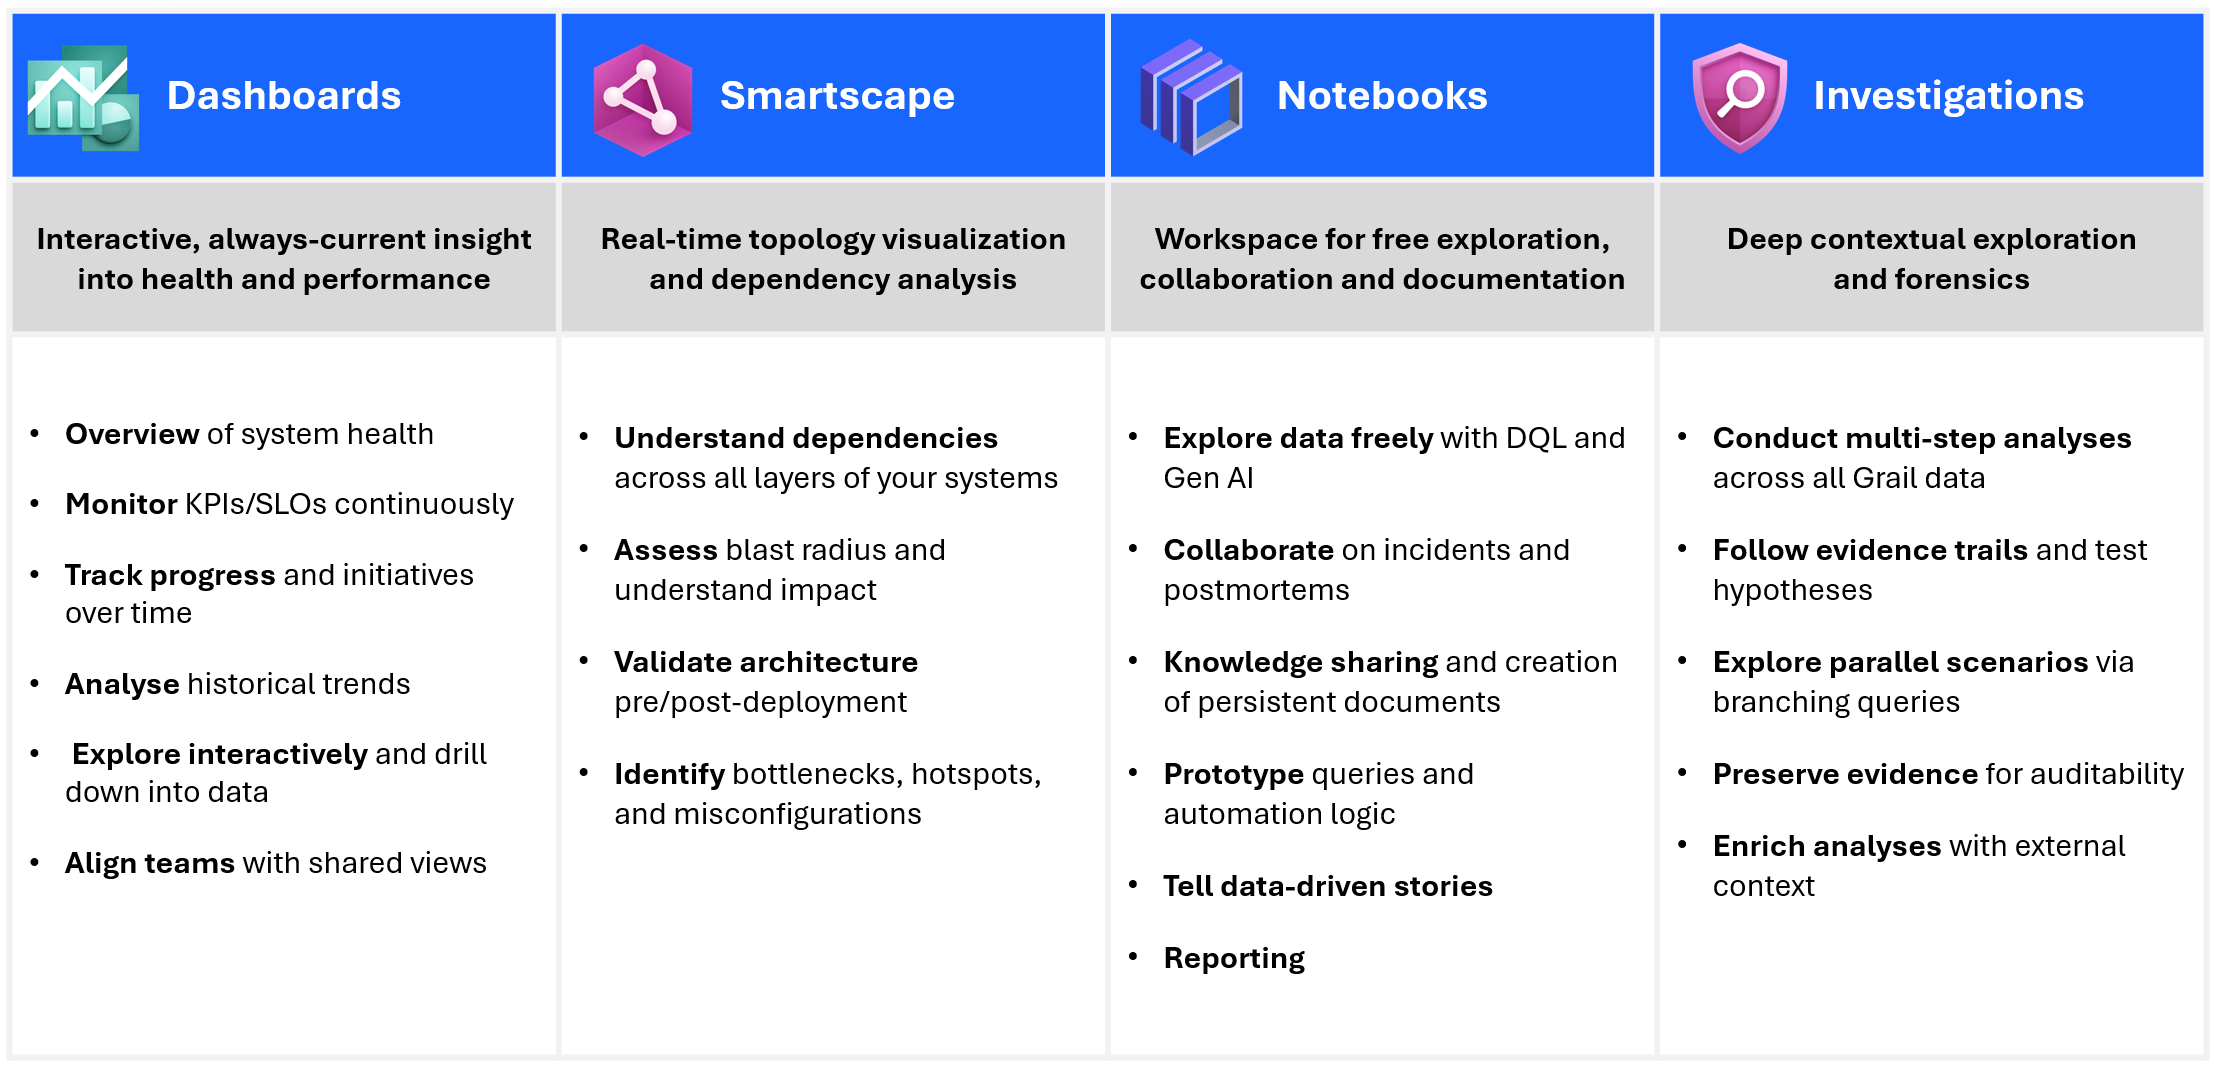
To support different exploration needs, Dynatrace offers a portfolio of use-case optimized apps:
- Dashboards for persistent, shared visibility and ongoing monitoring.
- Smartscape for visual analytics of real-time topology and dependency context.
- Notebooks for collaborative, ad hoc exploration and rapid hypothesis testing.
- Investigations for sequential, forensic depth in complex scenarios.
Move seamlessly between apps without losing context. Start in Dashboards, drill into a data point, and continue to explore your data in Notebooks. From there, you might run a deep, focused analysis in Investigations, then pivot to Smartscape for a dependency graph. Finally, bring your findings back into a dashboard for continuous monitoring, making your entire exploration journey seamless.
Let’s look at the apps in more detail, starting with Dashboards, often a natural entry point for your exploration journey.
Dashboards: from real-time visualizations to taking action
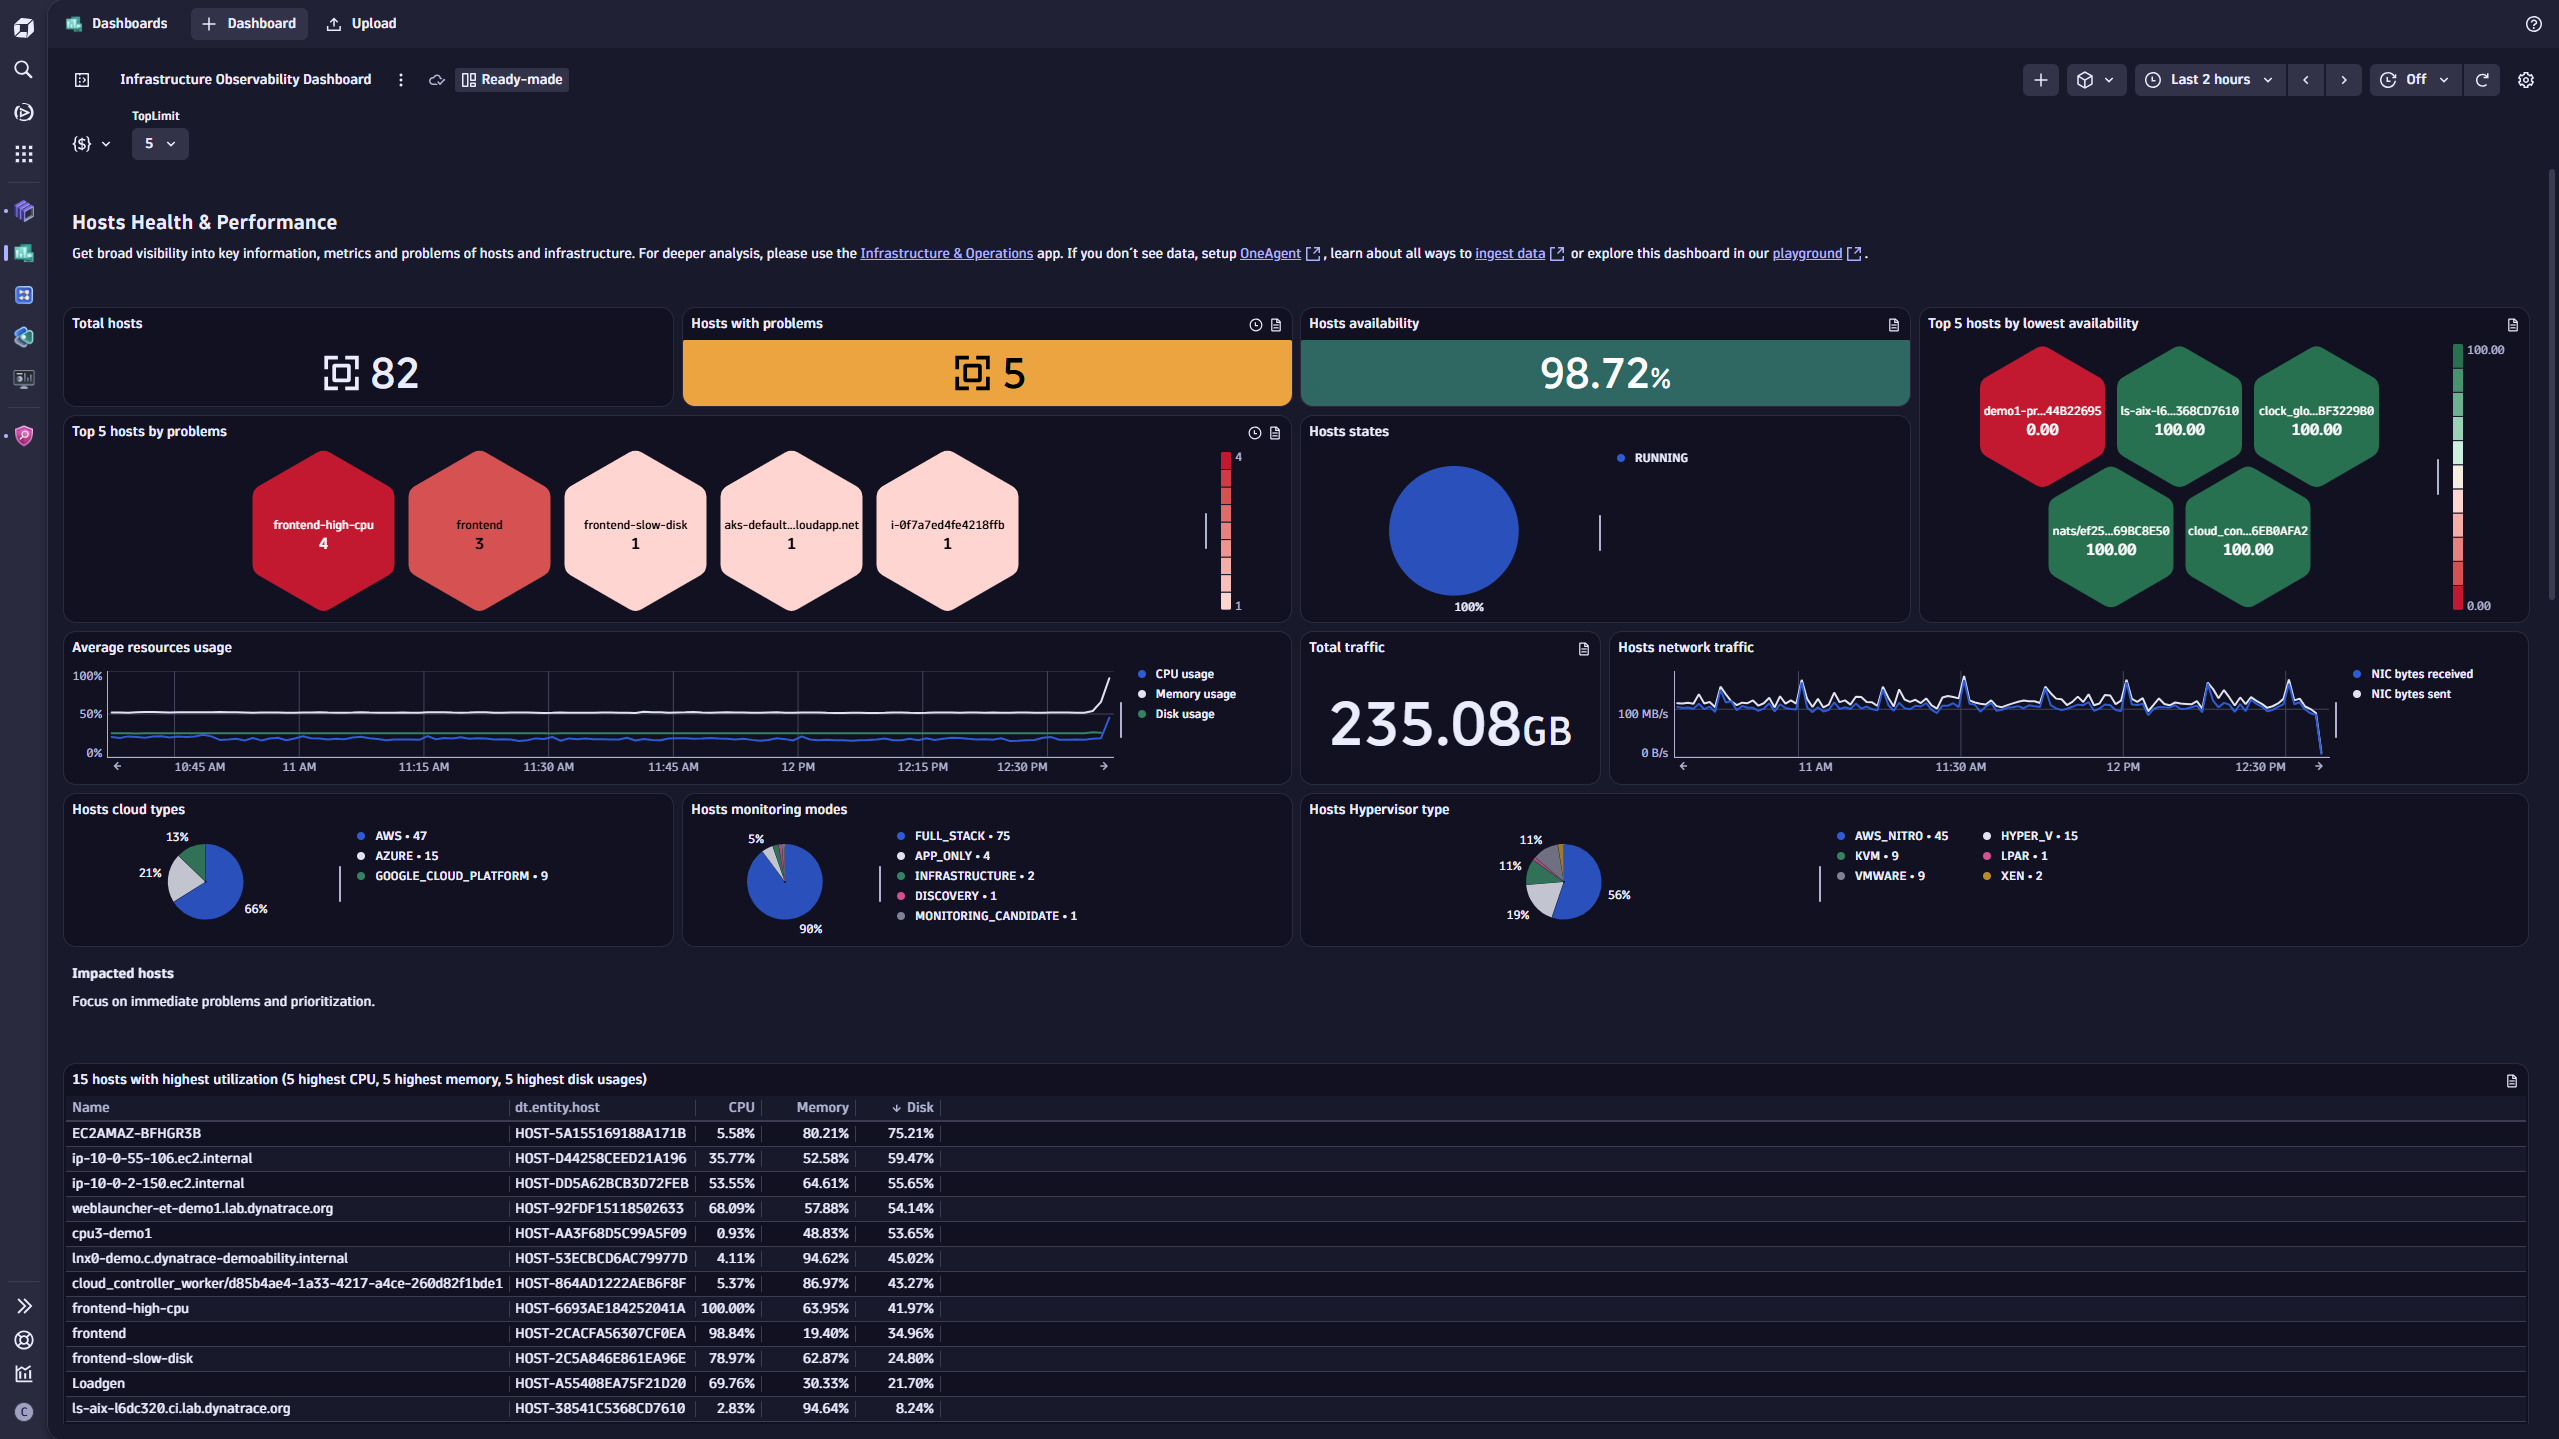
Dashboards provide a powerful way to transform complex data visualizations into actionable insights, serving as the cornerstone of the Dynatrace exploratory analytics portfolio where exploration meets operational excellence. By offering real-time visibility into key metrics, dashboards help teams monitor performance, identify trends, and make informed decisions. With ready-made dashboards for common use cases, such as Kubernetes, infrastructure, and digital experience monitoring, teams gain immediate access to critical insights, allowing for faster and more proactive responses to their daily challenges.
Dashboards are designed to foster operational clarity with intuitive, interactive visualizations that allow you to drill down into metrics, apply filters, and segment data to uncover meaningful patterns. While Notebooks and Investigations are ideal for deep dives and custom analyses, Dashboards deliver concise, shareable, real-time views that keep teams aligned and informed.
Deeply integrated with Dynatrace’s AI-powered analytics, dashboards enhance visualizations with contextual explanations, anomaly detection, and forecasting. These capabilities allow teams not only to monitor what’s happening but also to understand why it’s happening and predict what might happen next. By making insights accessible to both technical and non-technical stakeholders, dashboards foster collaboration, break down silos, and empower teams to stay aligned and proactive.
Use Dashboards to:
- Monitor KPIs and SLOs in real time
- Identify anomalies and emerging trends early
- Align teams with shared, role-based views and a single source of truth
- Trigger deeper analysis via drill-downs into charts and entities
- Track progress against goals and initiatives over time
- Surface business and technical context side by side for informed decisions
Smartscape: visualize the topology and dependencies of your complete digital systems
Smartscape® is the latest addition to the Dynatrace exploratory analytics app portfolio, and it’s a game-changer for exploring highly dynamic IT systems. Purpose-built for real-time visual analytics, Smartscape gives you a dynamic, interactive view of your entire IT ecosystem—spanning all layers, including services, cloud, Kubernetes, and on-premises infrastructure. Unlike static diagrams or manual dependency maps, Smartscape updates continuously, so you can understand changes as they happen.
Smartscape’s visual analytics capabilities go far beyond simple mapping. It provides multidimensional, domain-specific views that allow teams to see how services, processes, and infrastructure interact in real time. This real-time visualization helps uncover hidden dependencies, assess the blast radius of outages, spot drift or misconfigurations, and validate architecture after deployments. Apply your business context by using Segments, and pivot from other apps like Problems, Kubernetes, or Clouds into Smartscape without losing context.
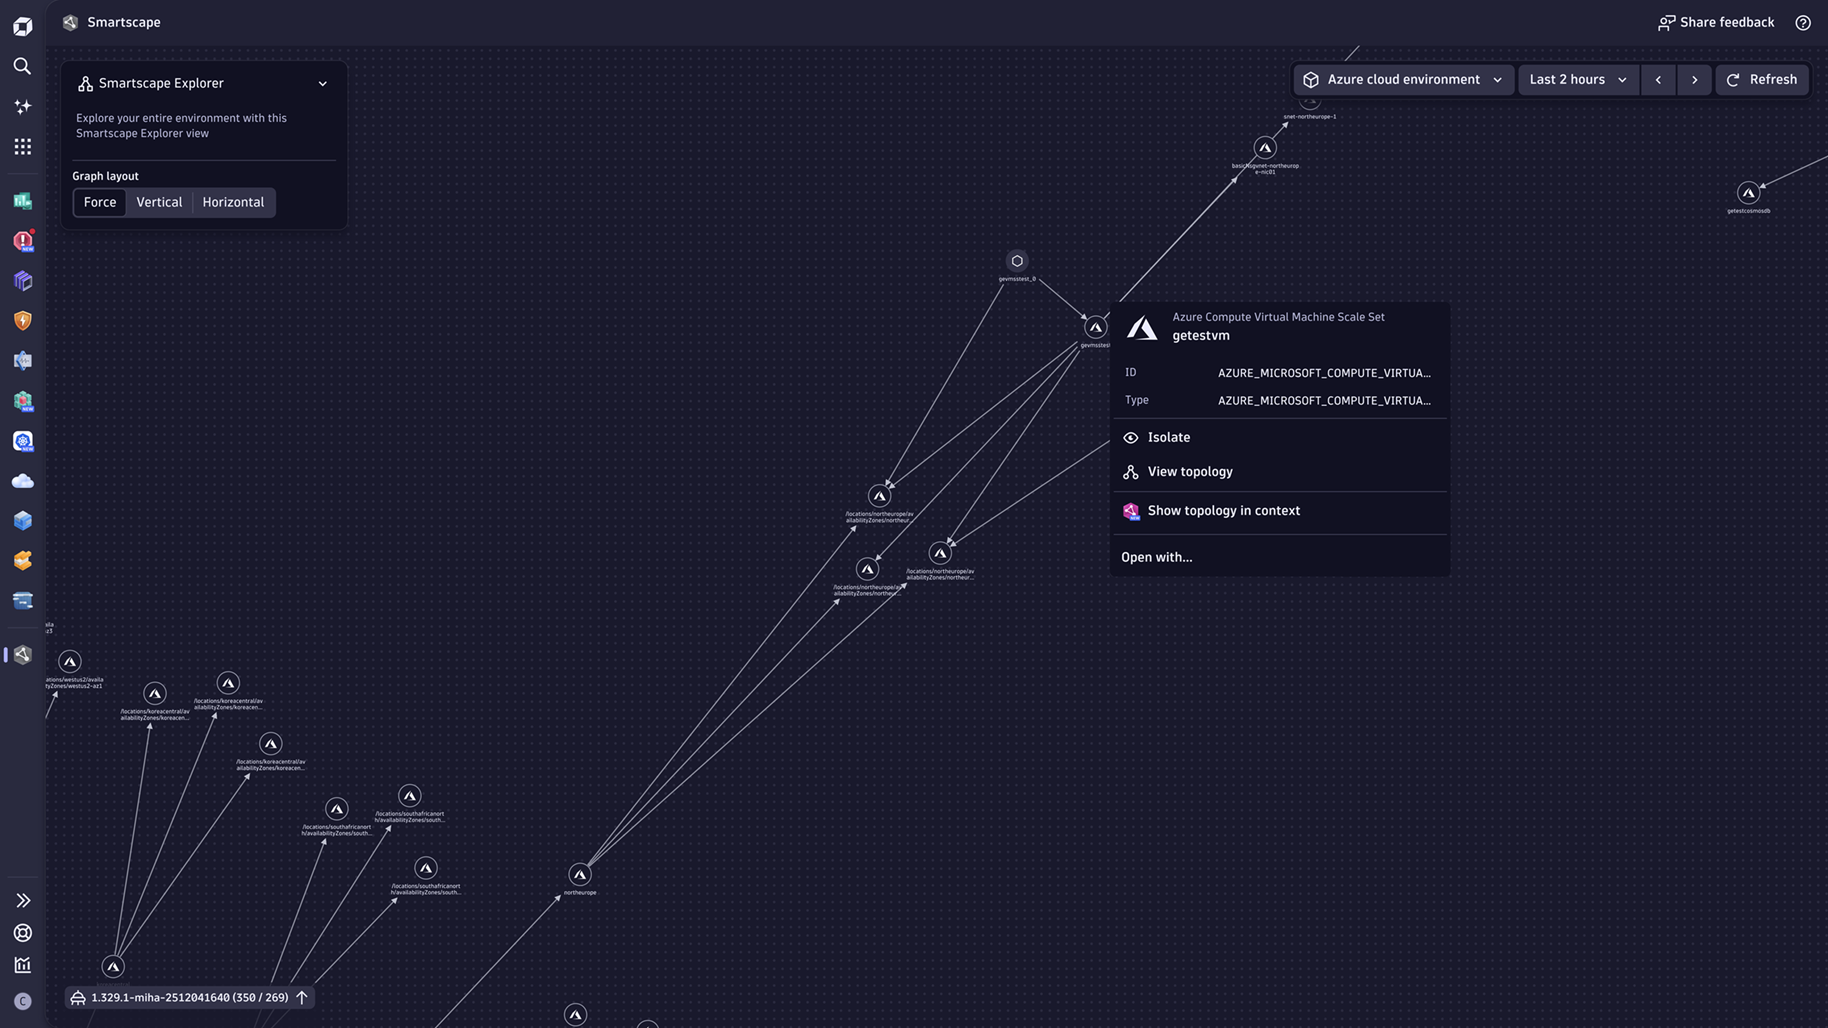
Use Smartscape to:
- Visualize real-time dependencies and communication paths across services and infrastructure
- Assess blast radius and map out highly connected and interdependent entities during incidents
- Validate architecture and changes after deployment
- Identify and understand hotspots, bottlenecks, and hidden dependencies
- Navigate readymade domain views for clouds, Kubernetes, services, and infrastructure with zero setup
- Align engineering, ops, and business teams with a shared, always-current understanding
Notebooks: collaborate, explore, and solve problems in real-time
Notebooks bridge the gap between the two modes of exploration and play an important role in both standardized processes and curiosity-driven exploration.
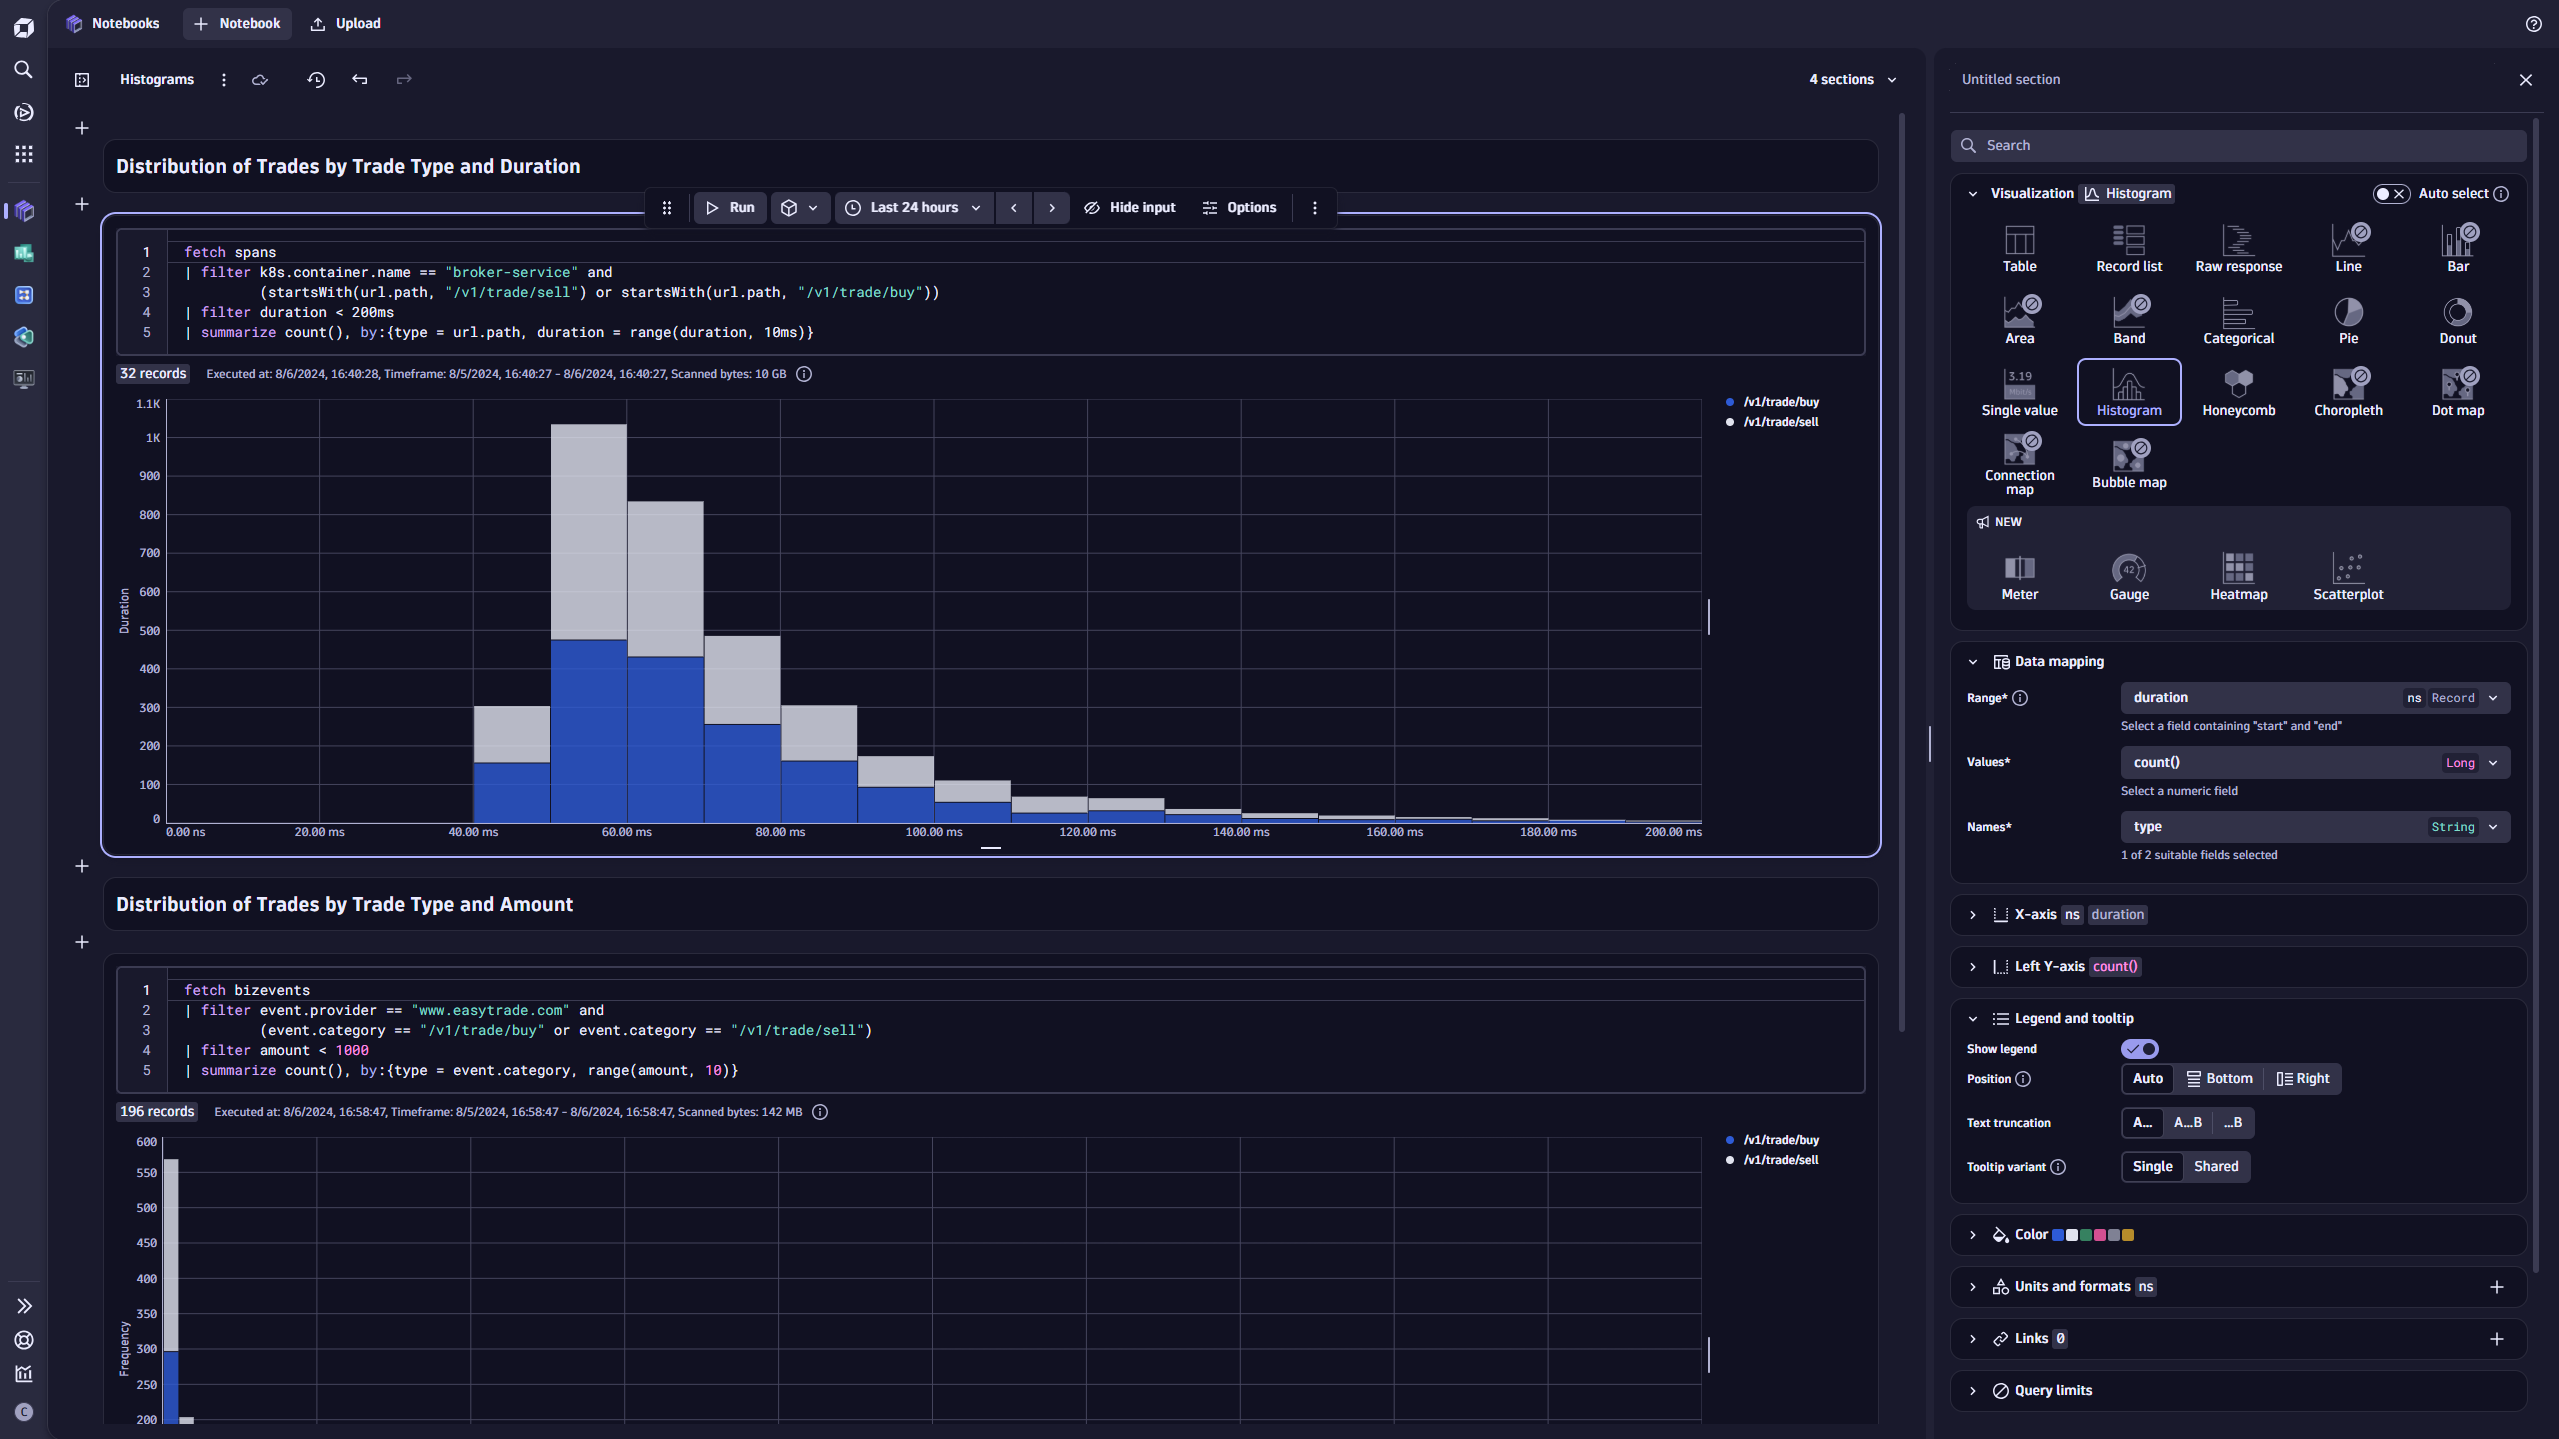
As a workspace for free exploration, Notebooks give you a playground to experiment with data, quickly visualize insights with a large set of chart types from a curated library, and iterate quickly. You can slice massive datasets in real time, pivot on context, and uncover patterns without constraints.
At the same time, Notebooks shine in collaborative workflows. Teams can work together to document and share findings during incident resolution or postmortems, create troubleshooting guides, and also generate automated reports from queries, all within the same space. Notebooks documenting incidents are automatically surfaced in the Problems app via vector search when similar issues occur, and snapshots of investigations can be preserved as long as needed outside of retention period settings, ensuring insights remain accessible.
Whether you’re just performing free-form discovery or creating documents within processes, Notebooks make it effortless to turn exploration into reusable assets.
Use Notebooks to:
- Collaborate on incident investigations
- Document postmortems for future reference
- Report insights ad hoc or on a schedule
- Analyze your data using generative AI
- Prototype and validate DQL for alerts, workflows, and automation
- Tell data stories with rich visuals and narrative
- Build a reusable knowledge base to reduce MTTR
- Extract data on demand
- Transform and shape data on read
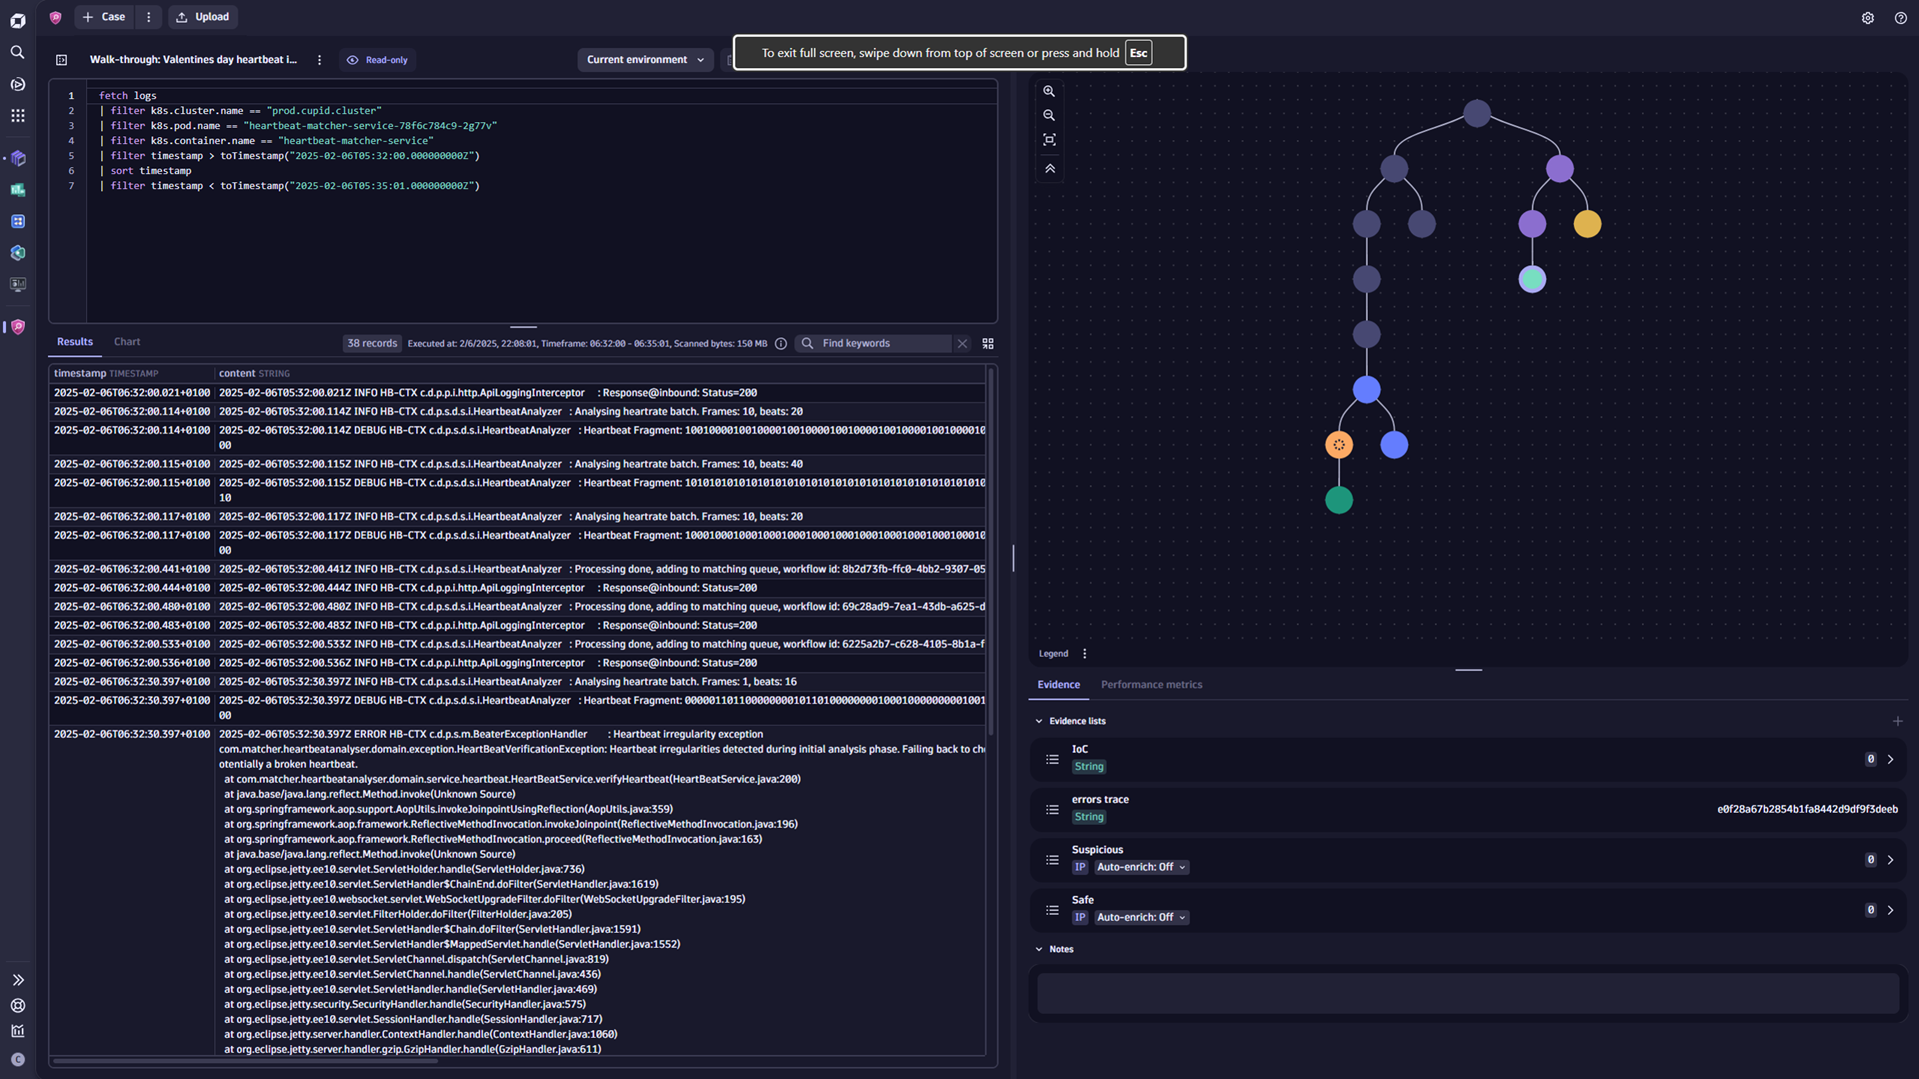
Investigations: dive deeper with sequential analysis and forensics
When exploration moves from curiosity to critical analysis, Investigations is your go-to tool. Built for structured, forensic deep dives, it’s the perfect complement to ad hoc exploration in Notebooks.
Investigations works with DQL across all data in Grail, including logs, events, metrics, traces, business data, and security signals. Teams can pivot from initial findings to comprehensive analysis without friction, comparing scenarios and following evidence trails wherever they lead. The query tree tracks your analytical path, letting you branch into parallel hypotheses and return to previous queries and results at any point.
Imagine this flow: a security team is alerted to unusual login attempts or wants to follow up on an anomaly spotted in Dashboards or Notebooks. With a single click, they transition to Investigations to trace lateral movement, simulate attack scenarios, and preserve evidence for future reference. Investigations support sequential workflows, allowing you to pivot queries based on metadata, visualize intricate patterns, and even enrich analysis with lookup tables and external data joins.
Pivot queries based on metadata, visualize patterns across multiple dimensions, and enrich your analysis with lookup tables and external data joins. Because all Grail data is accessible, you can seamlessly connect the dots, linking a suspicious error to its pod’s resource consumption, or tracing a payment failure back to the infrastructure event that caused it. Custom pivots let you select multiple findings and branch into separate queries automatically.
When you’ve found what you’re looking for, save the investigation, or just the relevant branches, as a Notebook to share with your team.
This isn’t just incident response, but everyday analytics for complex environments. Investigations help teams validate hypotheses, document findings, and strengthen resilience across IT systems.
Use Investigations to:
- Conduct structured, multi-step analyses across services and systems
- Correlate signals from applications, infrastructure, and user activity
- Follow evidence trails to confirm or refute hypotheses
- Explore parallel scenarios with branching query paths
- Diagnose complex integration and dependency issues across environments
- Collect and preserve evidence for auditability and knowledge reuse
- Enrich analyses with context (for example, lookups, reputation data, metadata)
Ready to make more of your data with Dynatrace?
Chances are your IT organization is currently focused on increasing efficiency, strengthening resilience and security, increasing agility, or aligning more closely with business priorities. Within your Dynatrace data, there are likely far more insights waiting to be uncovered, helping you accelerate these goals. Start by formulating the right questions: Where are inefficiencies hiding? Which patterns precede incidents and impact uptime? How exposed are critical services?
Give yourself time and room to explore: Visualize dependencies in Smartscape. Use Assist to turn your questions into DQL queries in Notebooks; experiment and try things out. When findings require structured follow-up, Investigations will help you get a complete understanding. And finally, for anything interesting you see on a chart, dashboards let you drill down into the details.
Start exploring now and make exploration a cornerstone of continuous improvement.
For inspiration and an overview of available Exploratory Analytics resources, take a look at our Perform 2026 – Exploratory Analytics Launchpad.


Looking for answers?
Start a new discussion or ask for help in our Q&A forum.
Go to forum