Dynatrace offers powerful artificial intelligence that automatically detects performance anomalies in your environment. When such problems are detected, Dynatrace sends out real-time alerts with correlated root-cause analysis details that facilitate problem resolution. There can be situations, however, when you don’t want to receive alerts related to certain known problems. For example, you may not want to be alerted each time your free disk space drops below 30%, or when a certain service method throws a recurring error that has no impact on customer experience.
While one solution to unnecessary alerting might be to adjust your anomaly-detection thresholds downward so that, for example, low disk space issues no longer trigger alerts, there is a better way of customizing alerting that doesn’t compromise Dynatrace anomaly-detection AI.
Introducing custom alerts
The latest Dynatrace release introduces a completely new alerting mechanism that can be configured with no impact to Dynatrace automatic anomaly-detection capabilities. The new alerting mechanism enables you to define custom alerts for specific metric-threshold breaches, along with rules for the number of breach violations that must occur before an alert is sent out.
Meaningful names can even be defined for custom alerts that are sent out through all your organization’s problem-notification channels.
To define a custom alert
- Go to Settings > Anomaly detection > Custom alerts.
- Click the Create custom alert button.

- Type an alert name.
- Define the alerting scope type.
- Select the metric that the alert is to be based on, along with an appropriate aggregation type.
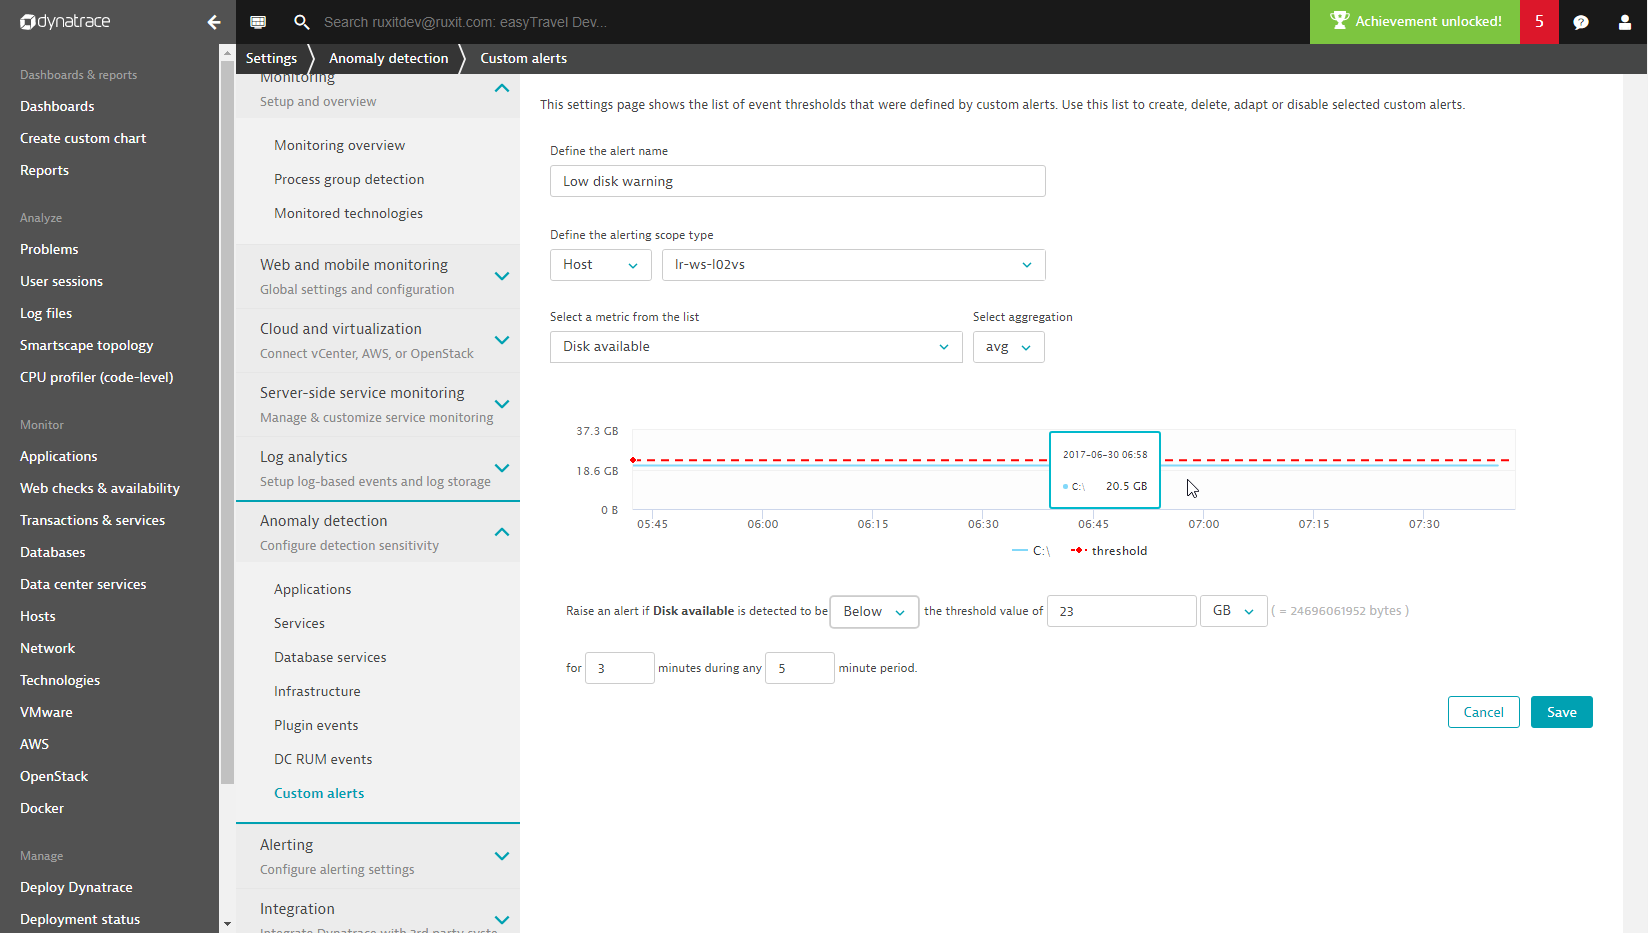
- Define custom alert values that are appropriate for the selected metric and the unique conditions of your environment. The example Low disk warning alert configuration below will trigger an alert if the minimum metric threshold of 23 GBs is breached for longer than 3 minutes during any 5 minute sliding time frame.

Working with custom alerts
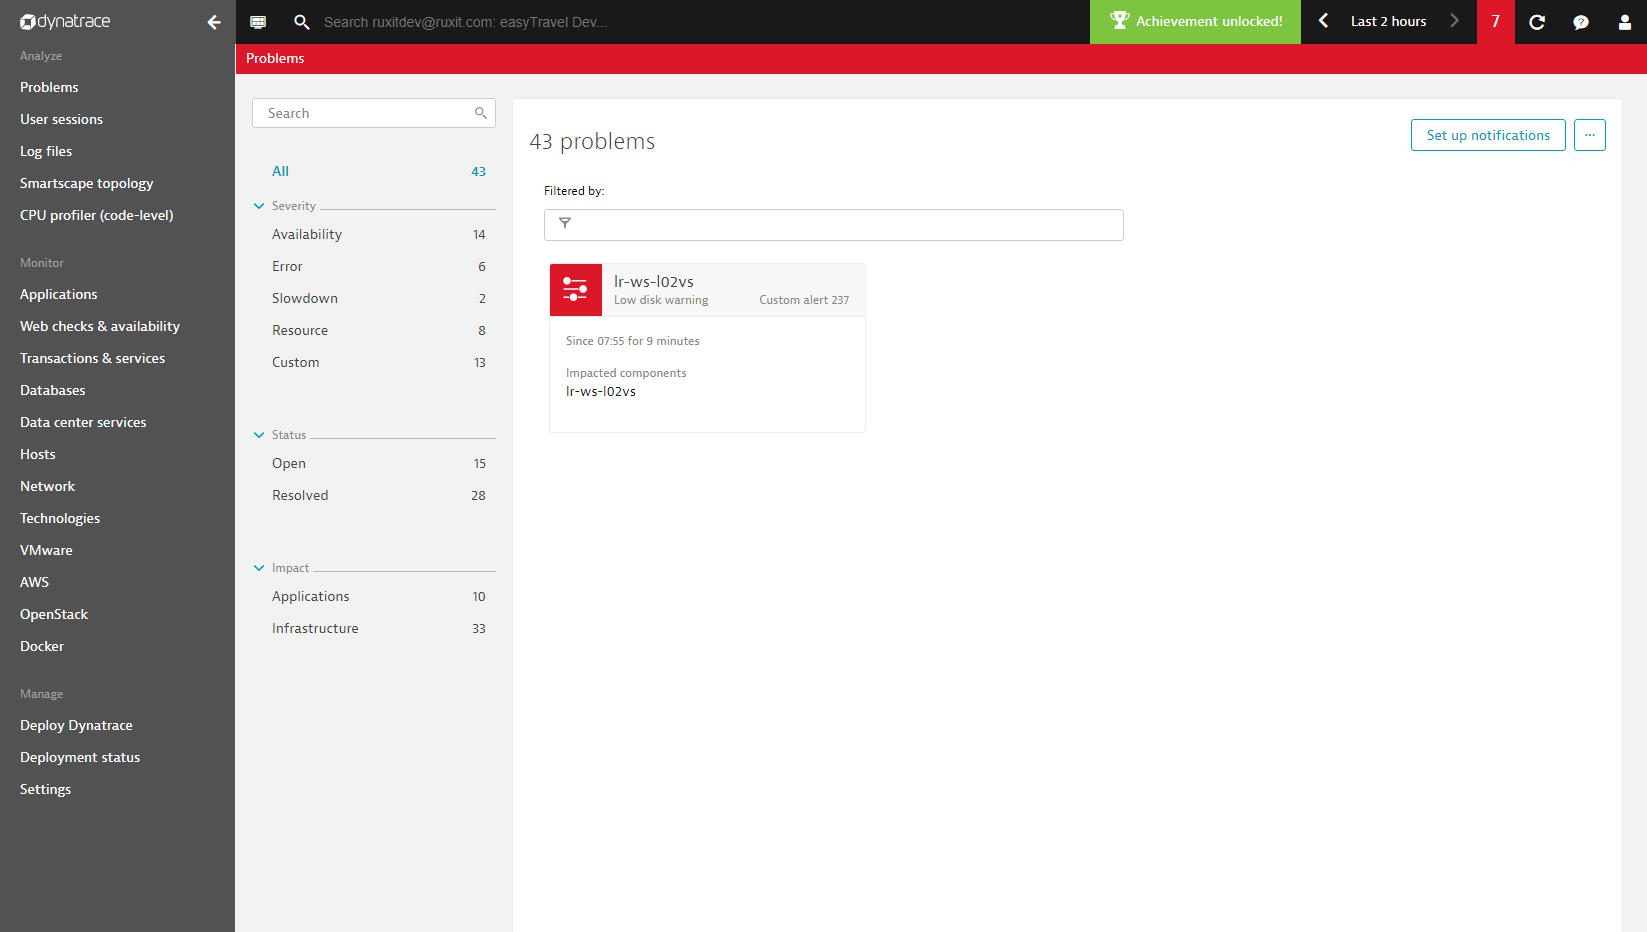
If Dynatrace detects that one of your configured custom alert thresholds has been violated, a new custom alert will be generated and an alert will be sent out. You can access these custom alerts in your Problems feed at any time by selecting Problems from the navigation menu.
As with standard problem cards, custom alert cards show the component that violated the threshold and the duration of the breach. As you can see below, custom alerts can be identified by their distinct icon.

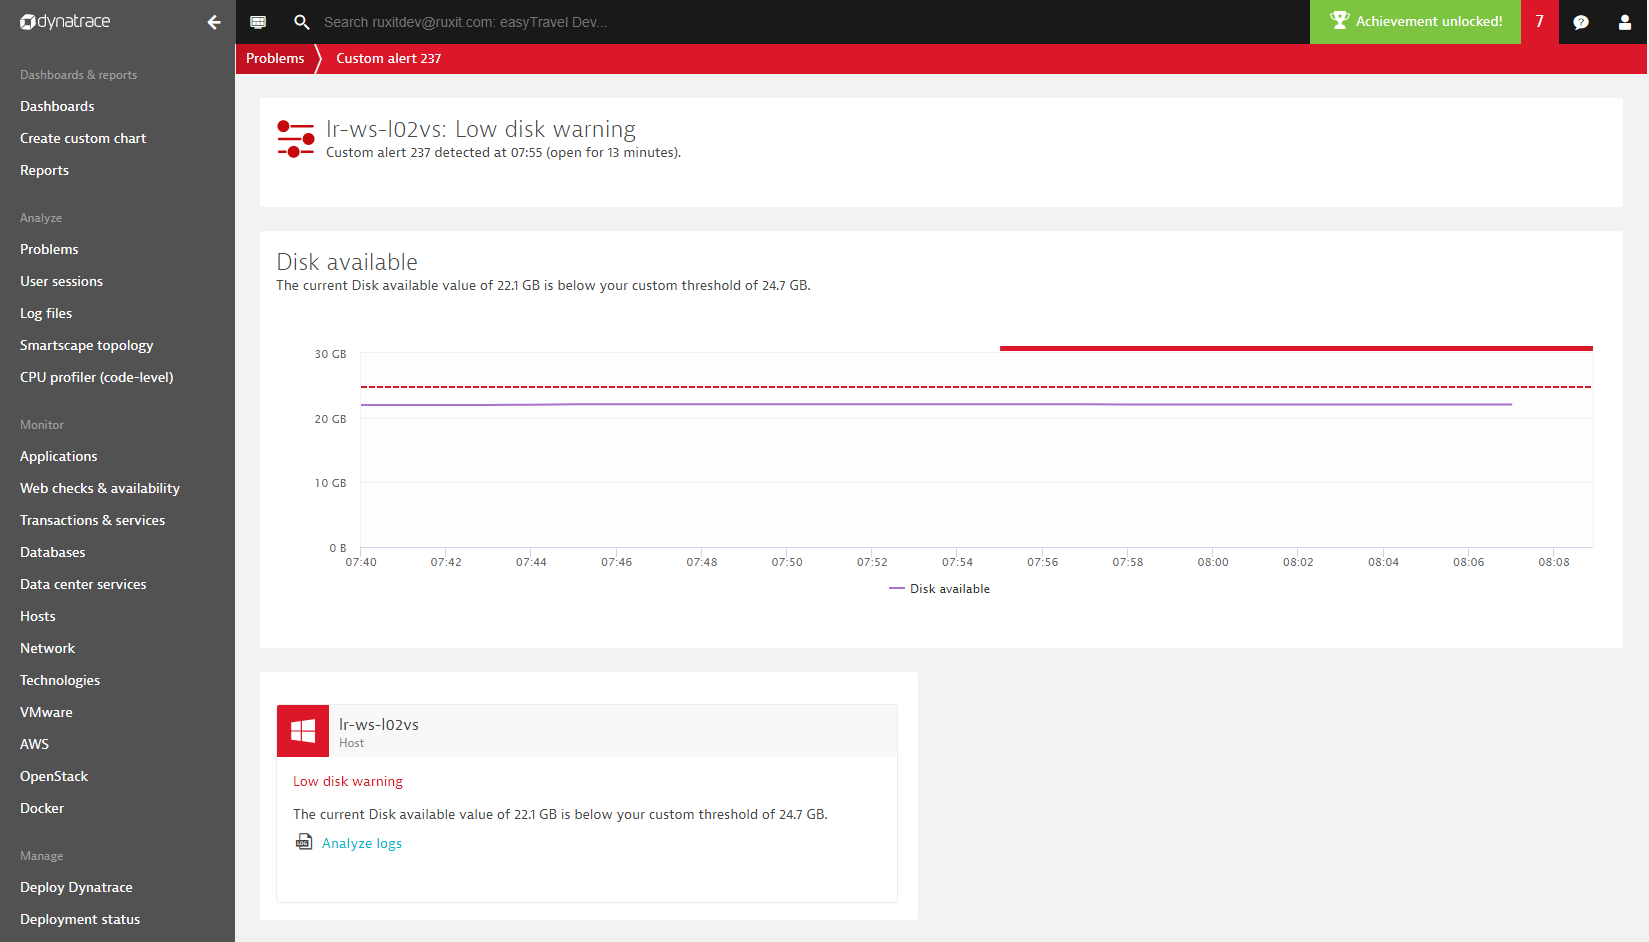
Click a card in your Problems feed to view the problem’s details page. Here you’ll see a chart that details the affected metric, specifics of the threshold breach, and a heat field that indicates the duration of the event (see example below).

Limitations
While events generated by custom alerts are listed in the Problems feed alongside all other problems that have been detected via the Dynatrace AI, custom alerts are not factored into the Dynatrace problem correlation and causation process. This means that custom alerts are never identified as the root cause of problems. So, when it comes to custom alerts, “what you set is what you get”.
We’d love to hear your feedback on the new custom alerting functionality. Visit Dynatrace Community and let us know what you think.
Start a free trial!
Dynatrace is free to use for 15 days! The trial stops automatically, no credit card is required. Just enter your email address, choose your cloud location and install our agent.


Looking for answers?
Start a new discussion or ask for help in our Q&A forum.
Go to forum