
PHP monitoring
Most powerful monitoring for the world's most popular websites.
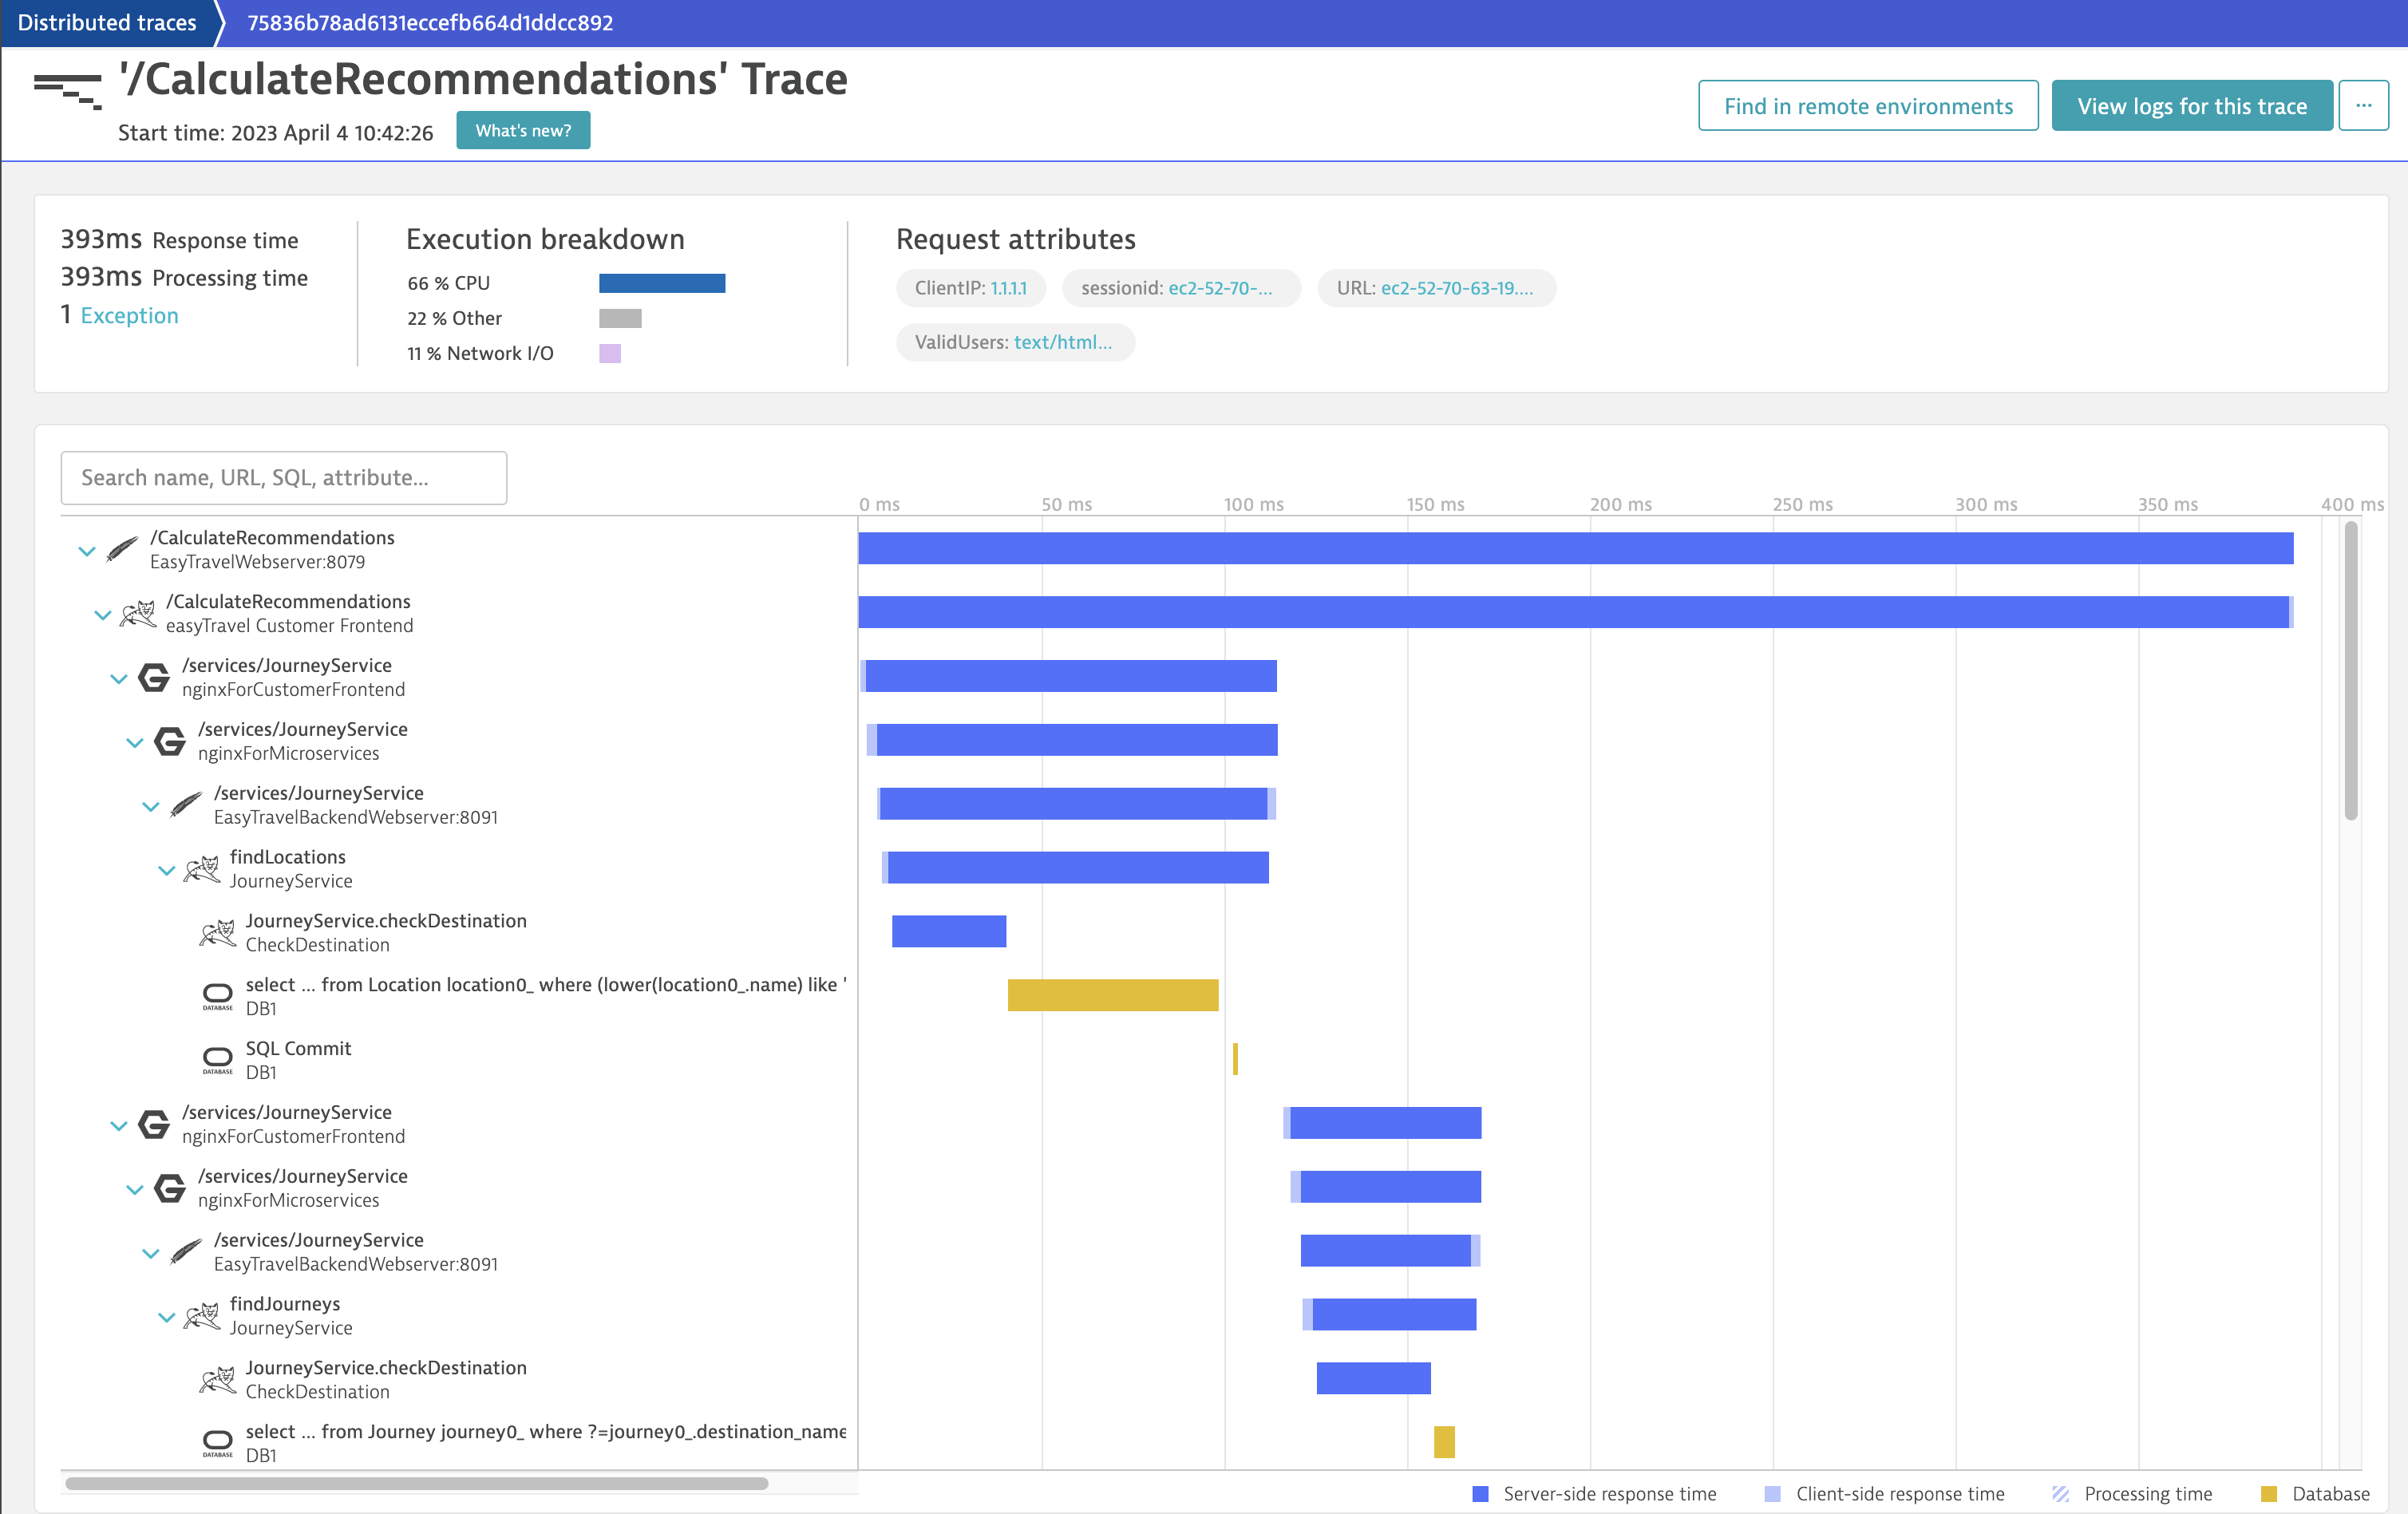
Follow every single transaction, end-to-end
Dynatrace uses patented PurePath Technology® to capture timing and code-level context for every transaction, across every tier, without gaps or blind spots.
- Drill into all services and components called upon a single user interaction.
- Analyze response times and find hotspots at the method level.
- Understand the impact of methods and database statements on user experience with our unique backtrace capability.
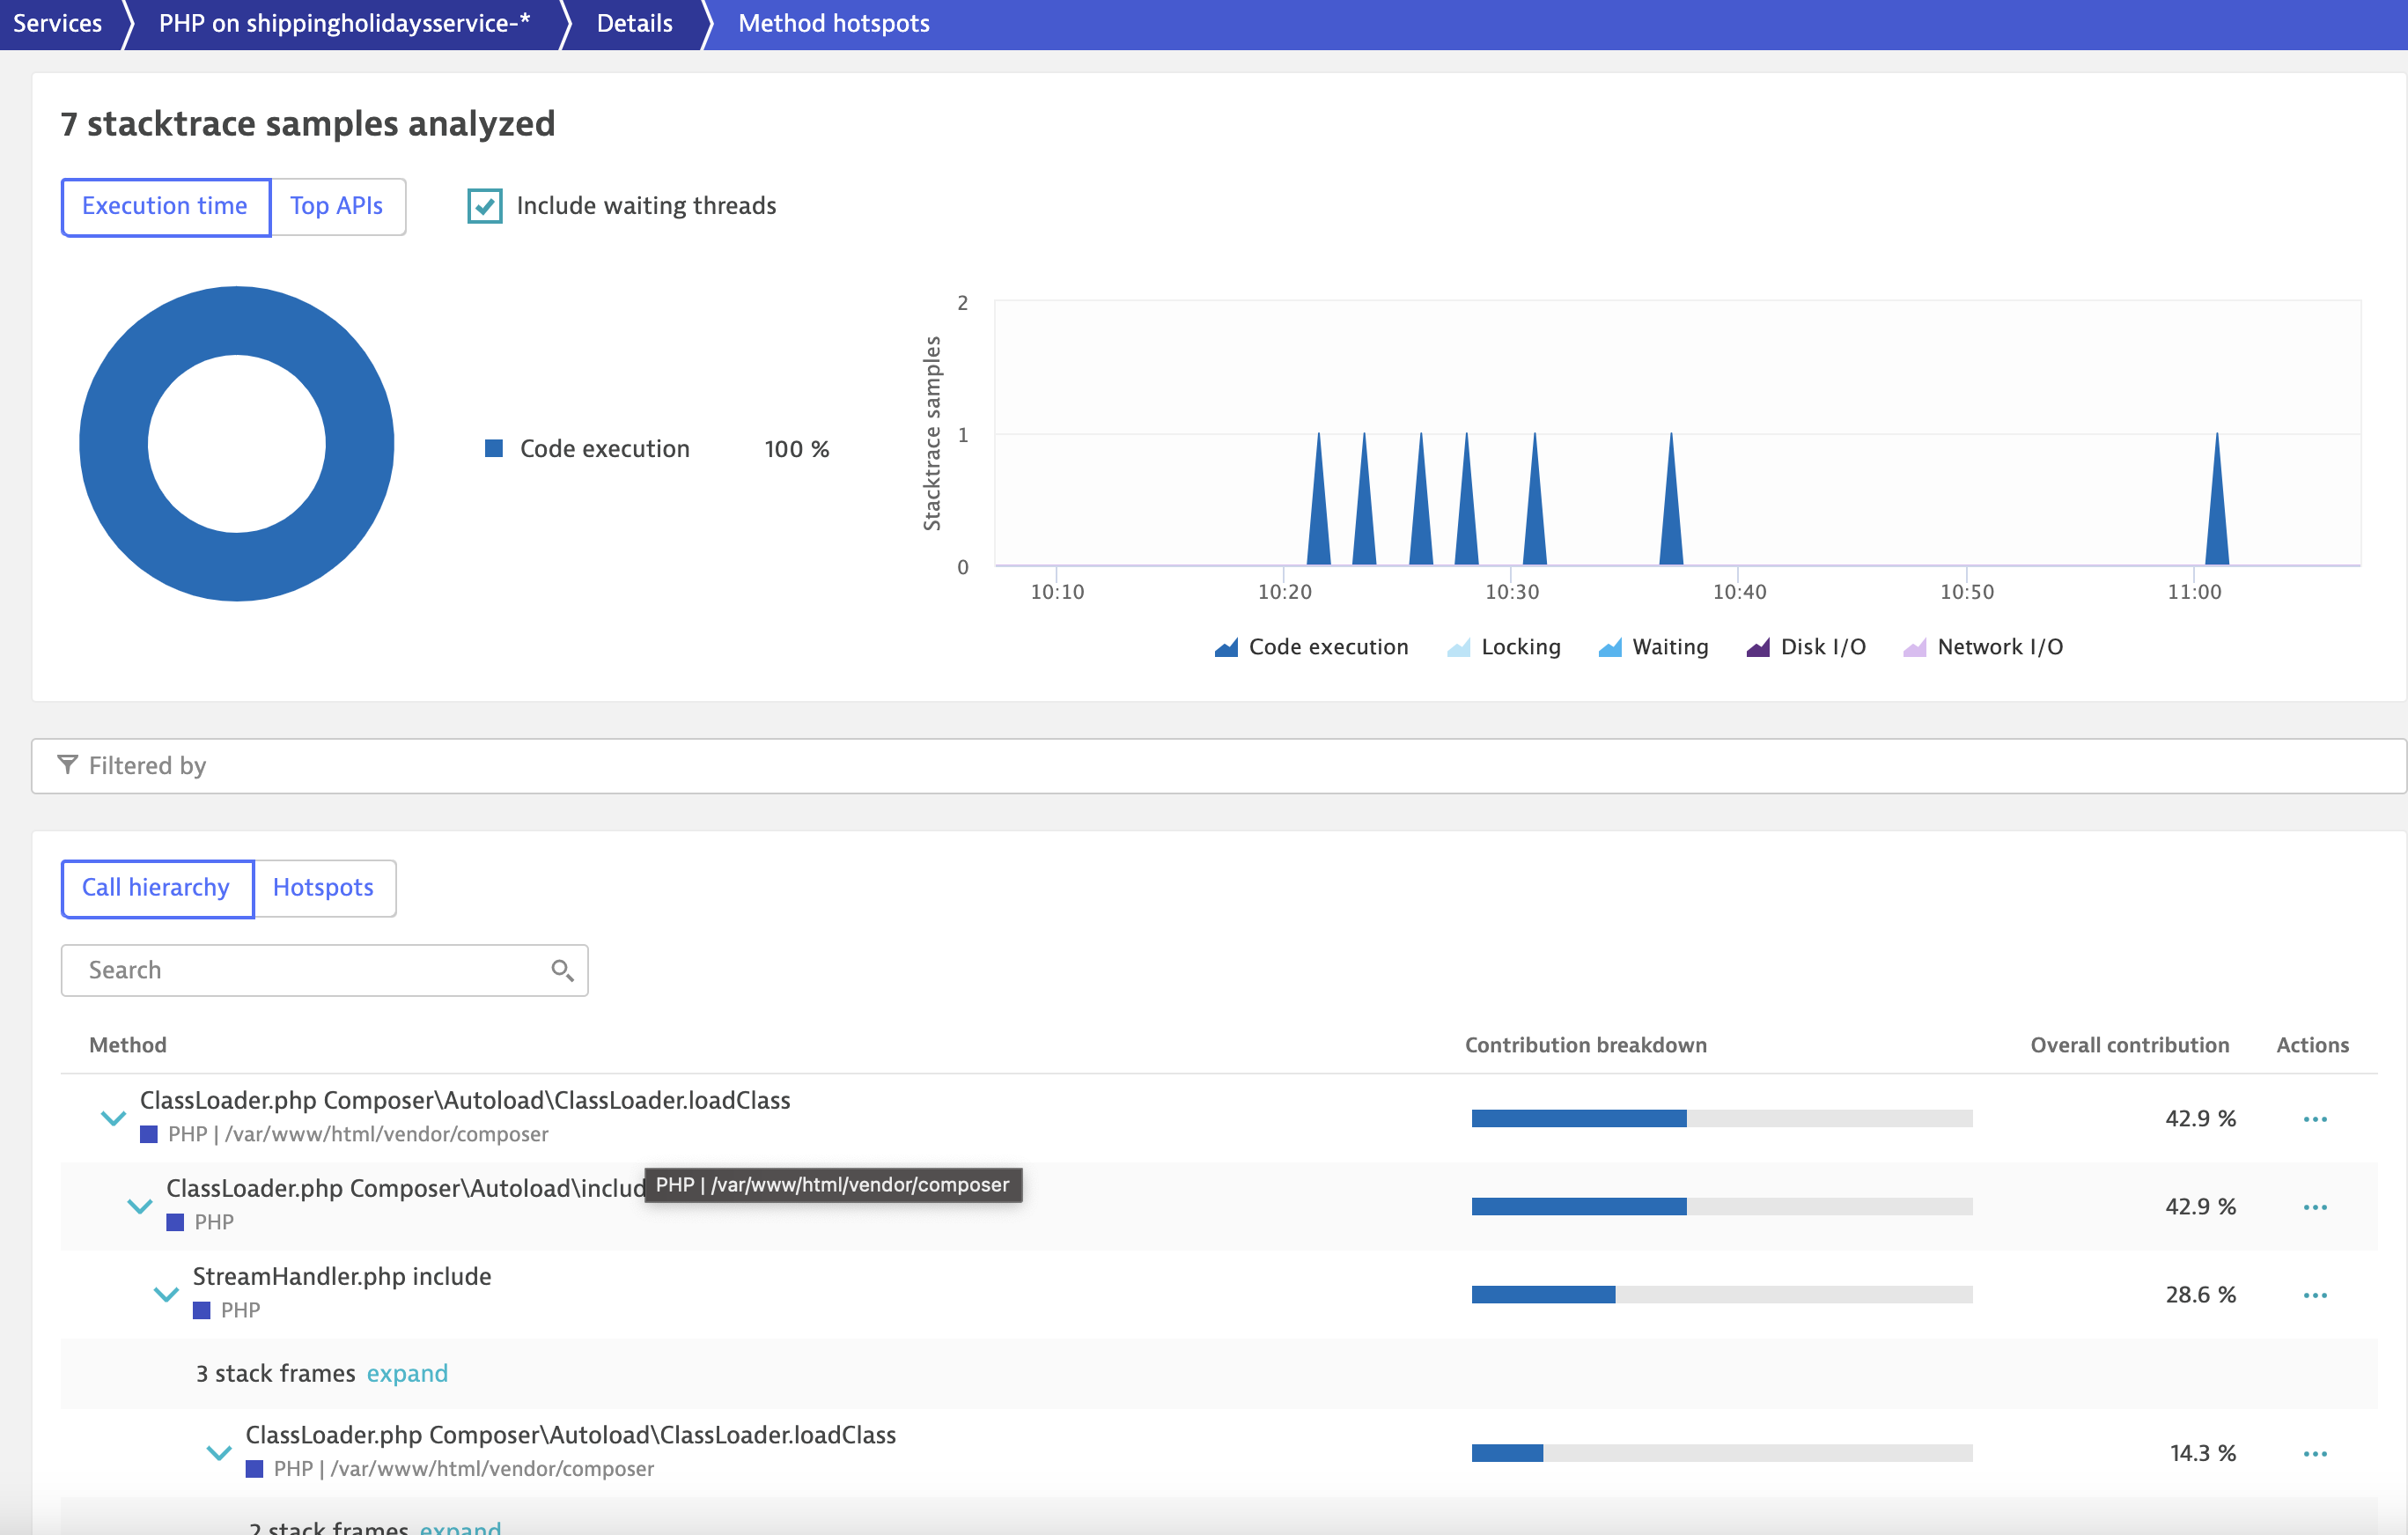
Locate bottlenecks in your application code
Dynatrace enables you to dig into your applications and find hotspots at the code level. Your ability to find and resolve PHP performance issues will improve significantly with Dynatrace PHP application monitoring tools.
- Locate problematic methods with CPU or network bottlenecks within the execution call stack.
- Understand how PHP compilation can negatively affect system performance. Dynatrace shows PHP compilation metrics and their contribution to response times, so you’ll know when it’s time to give OPcache a try.
- Easily identify unnecessary module overhead and improve your module configurations.
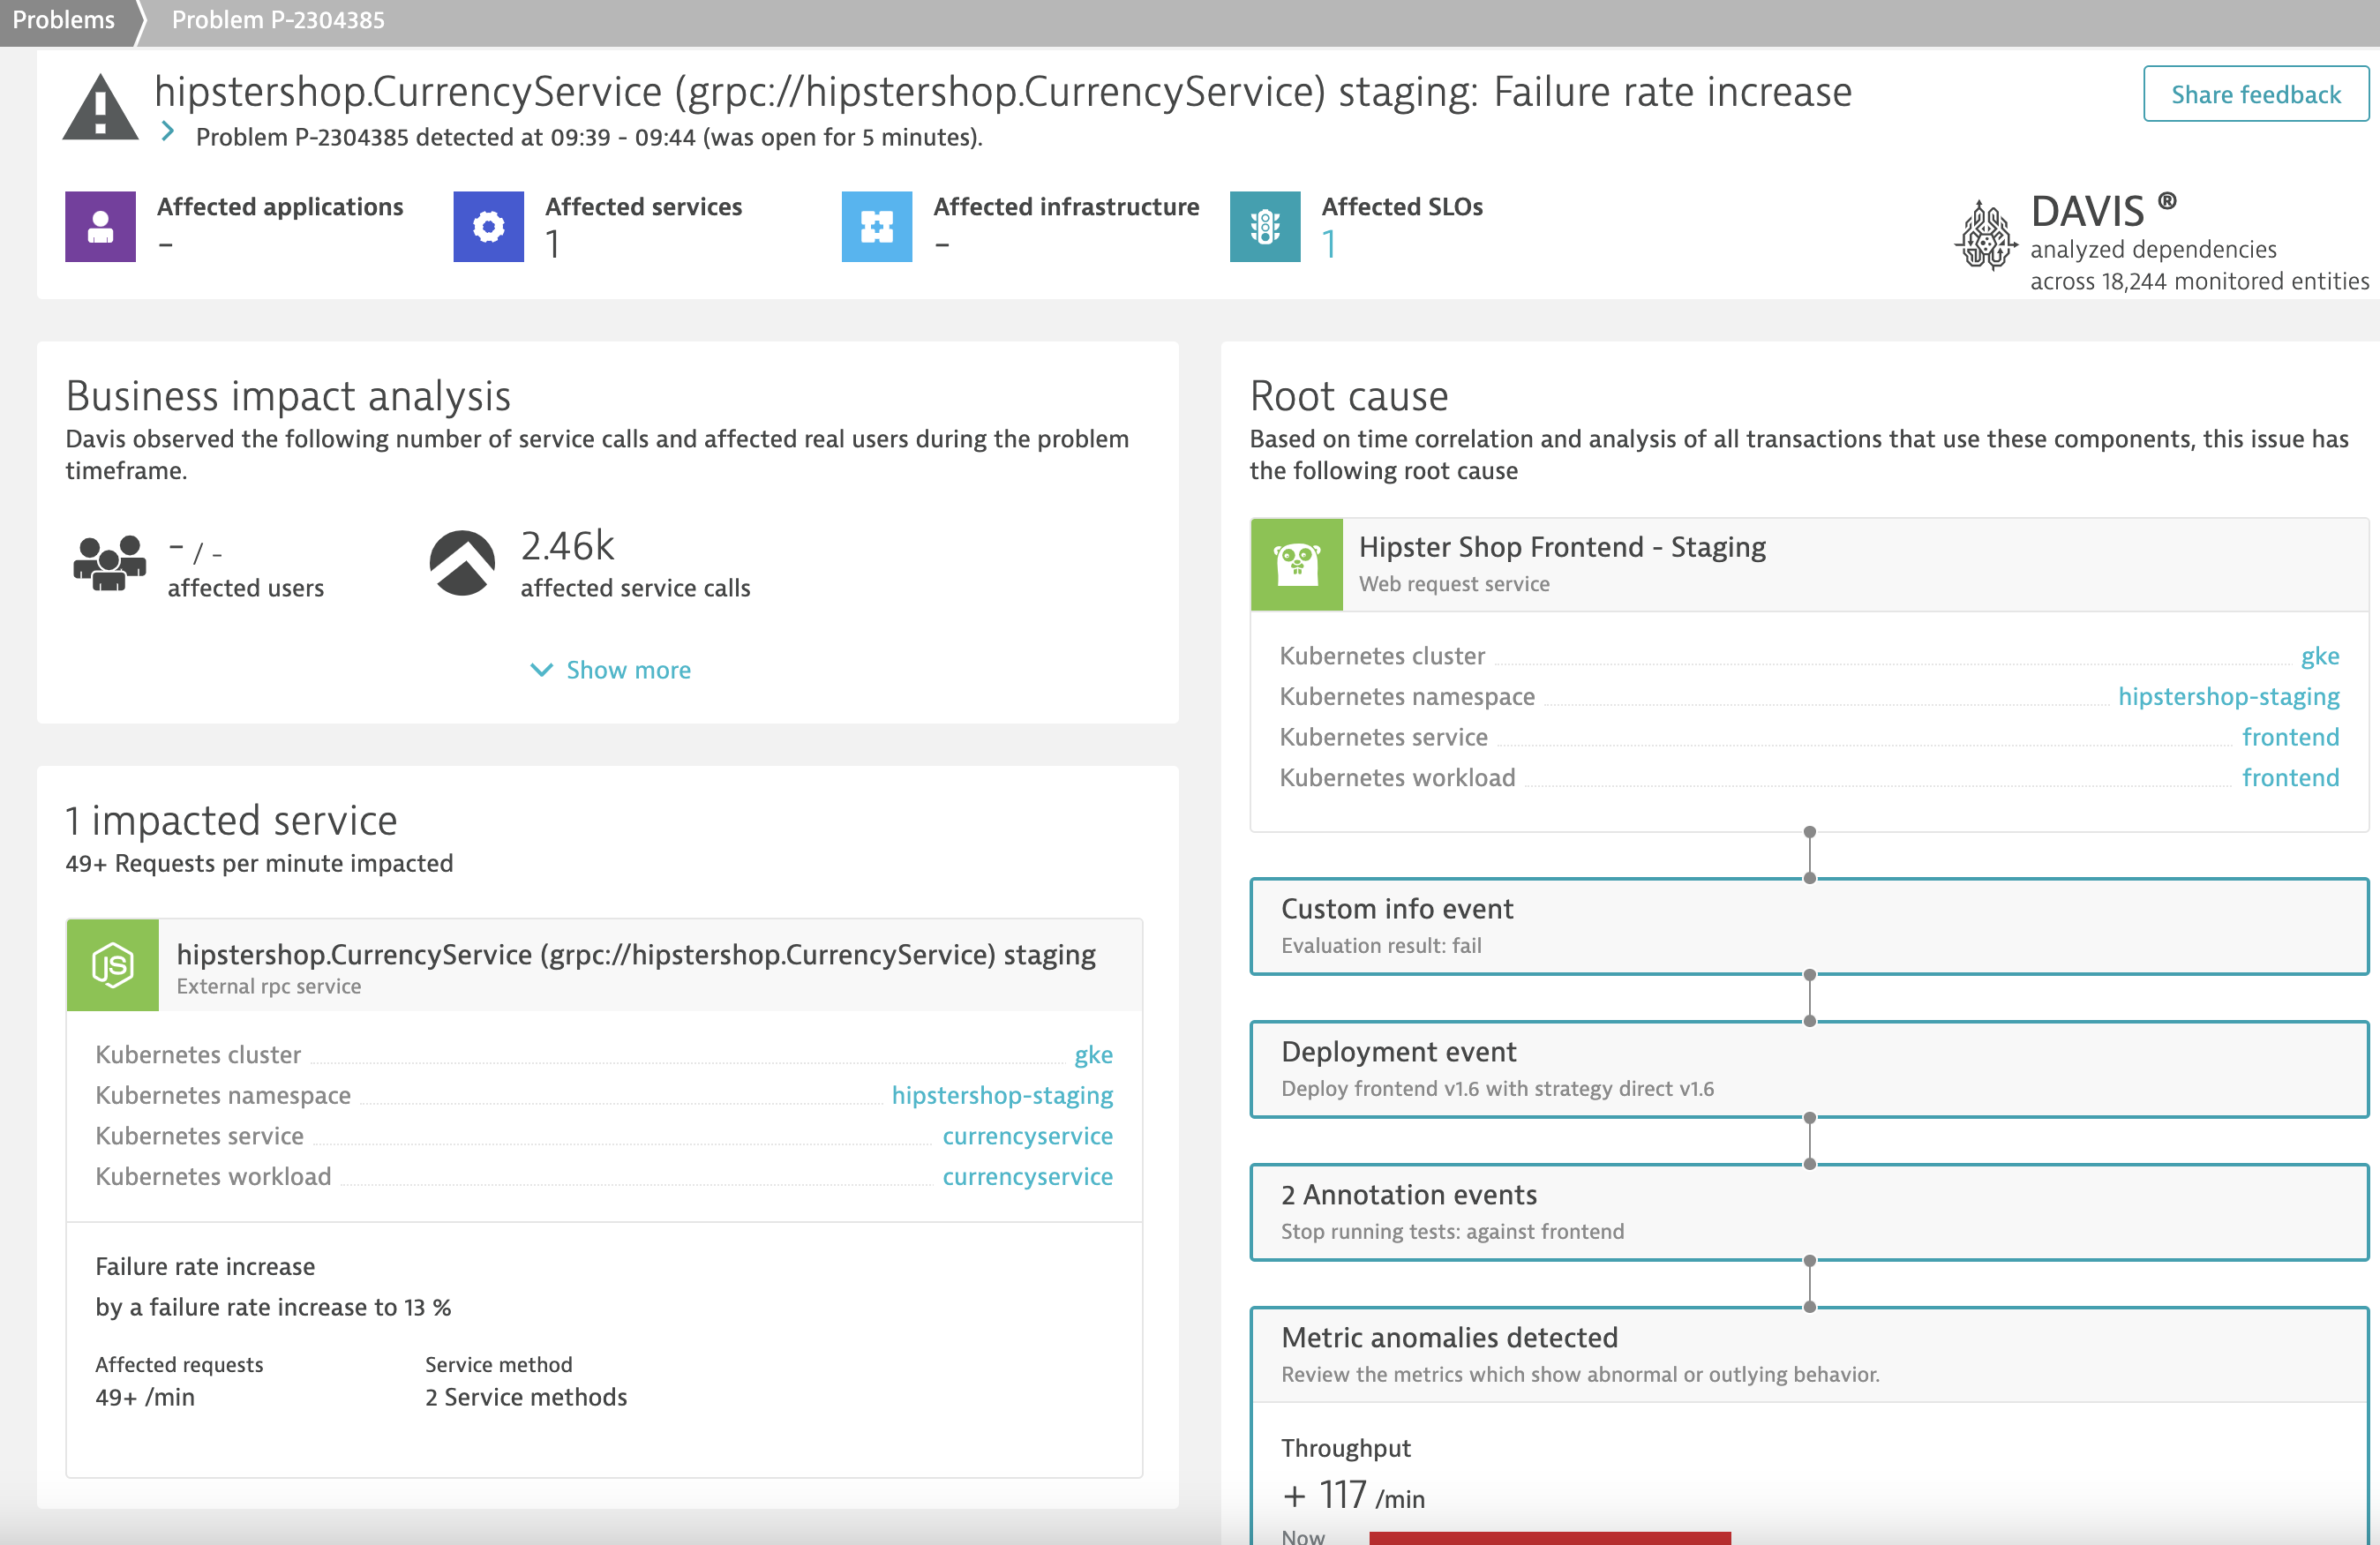
Dynatrace tells you the root cause of PHP problems!
Dynatrace detects and diagnoses problems in real time, pinpointing the root cause down to the offending code before your customers are even affected.
- Detect availability and performance problems across your stack proactively.
- Directly pinpoint components that are causing problems with big data analytics of billions of dependencies within your application stack.
- Access a visual replay of problem evolution helps you understand how problems evolved over time.
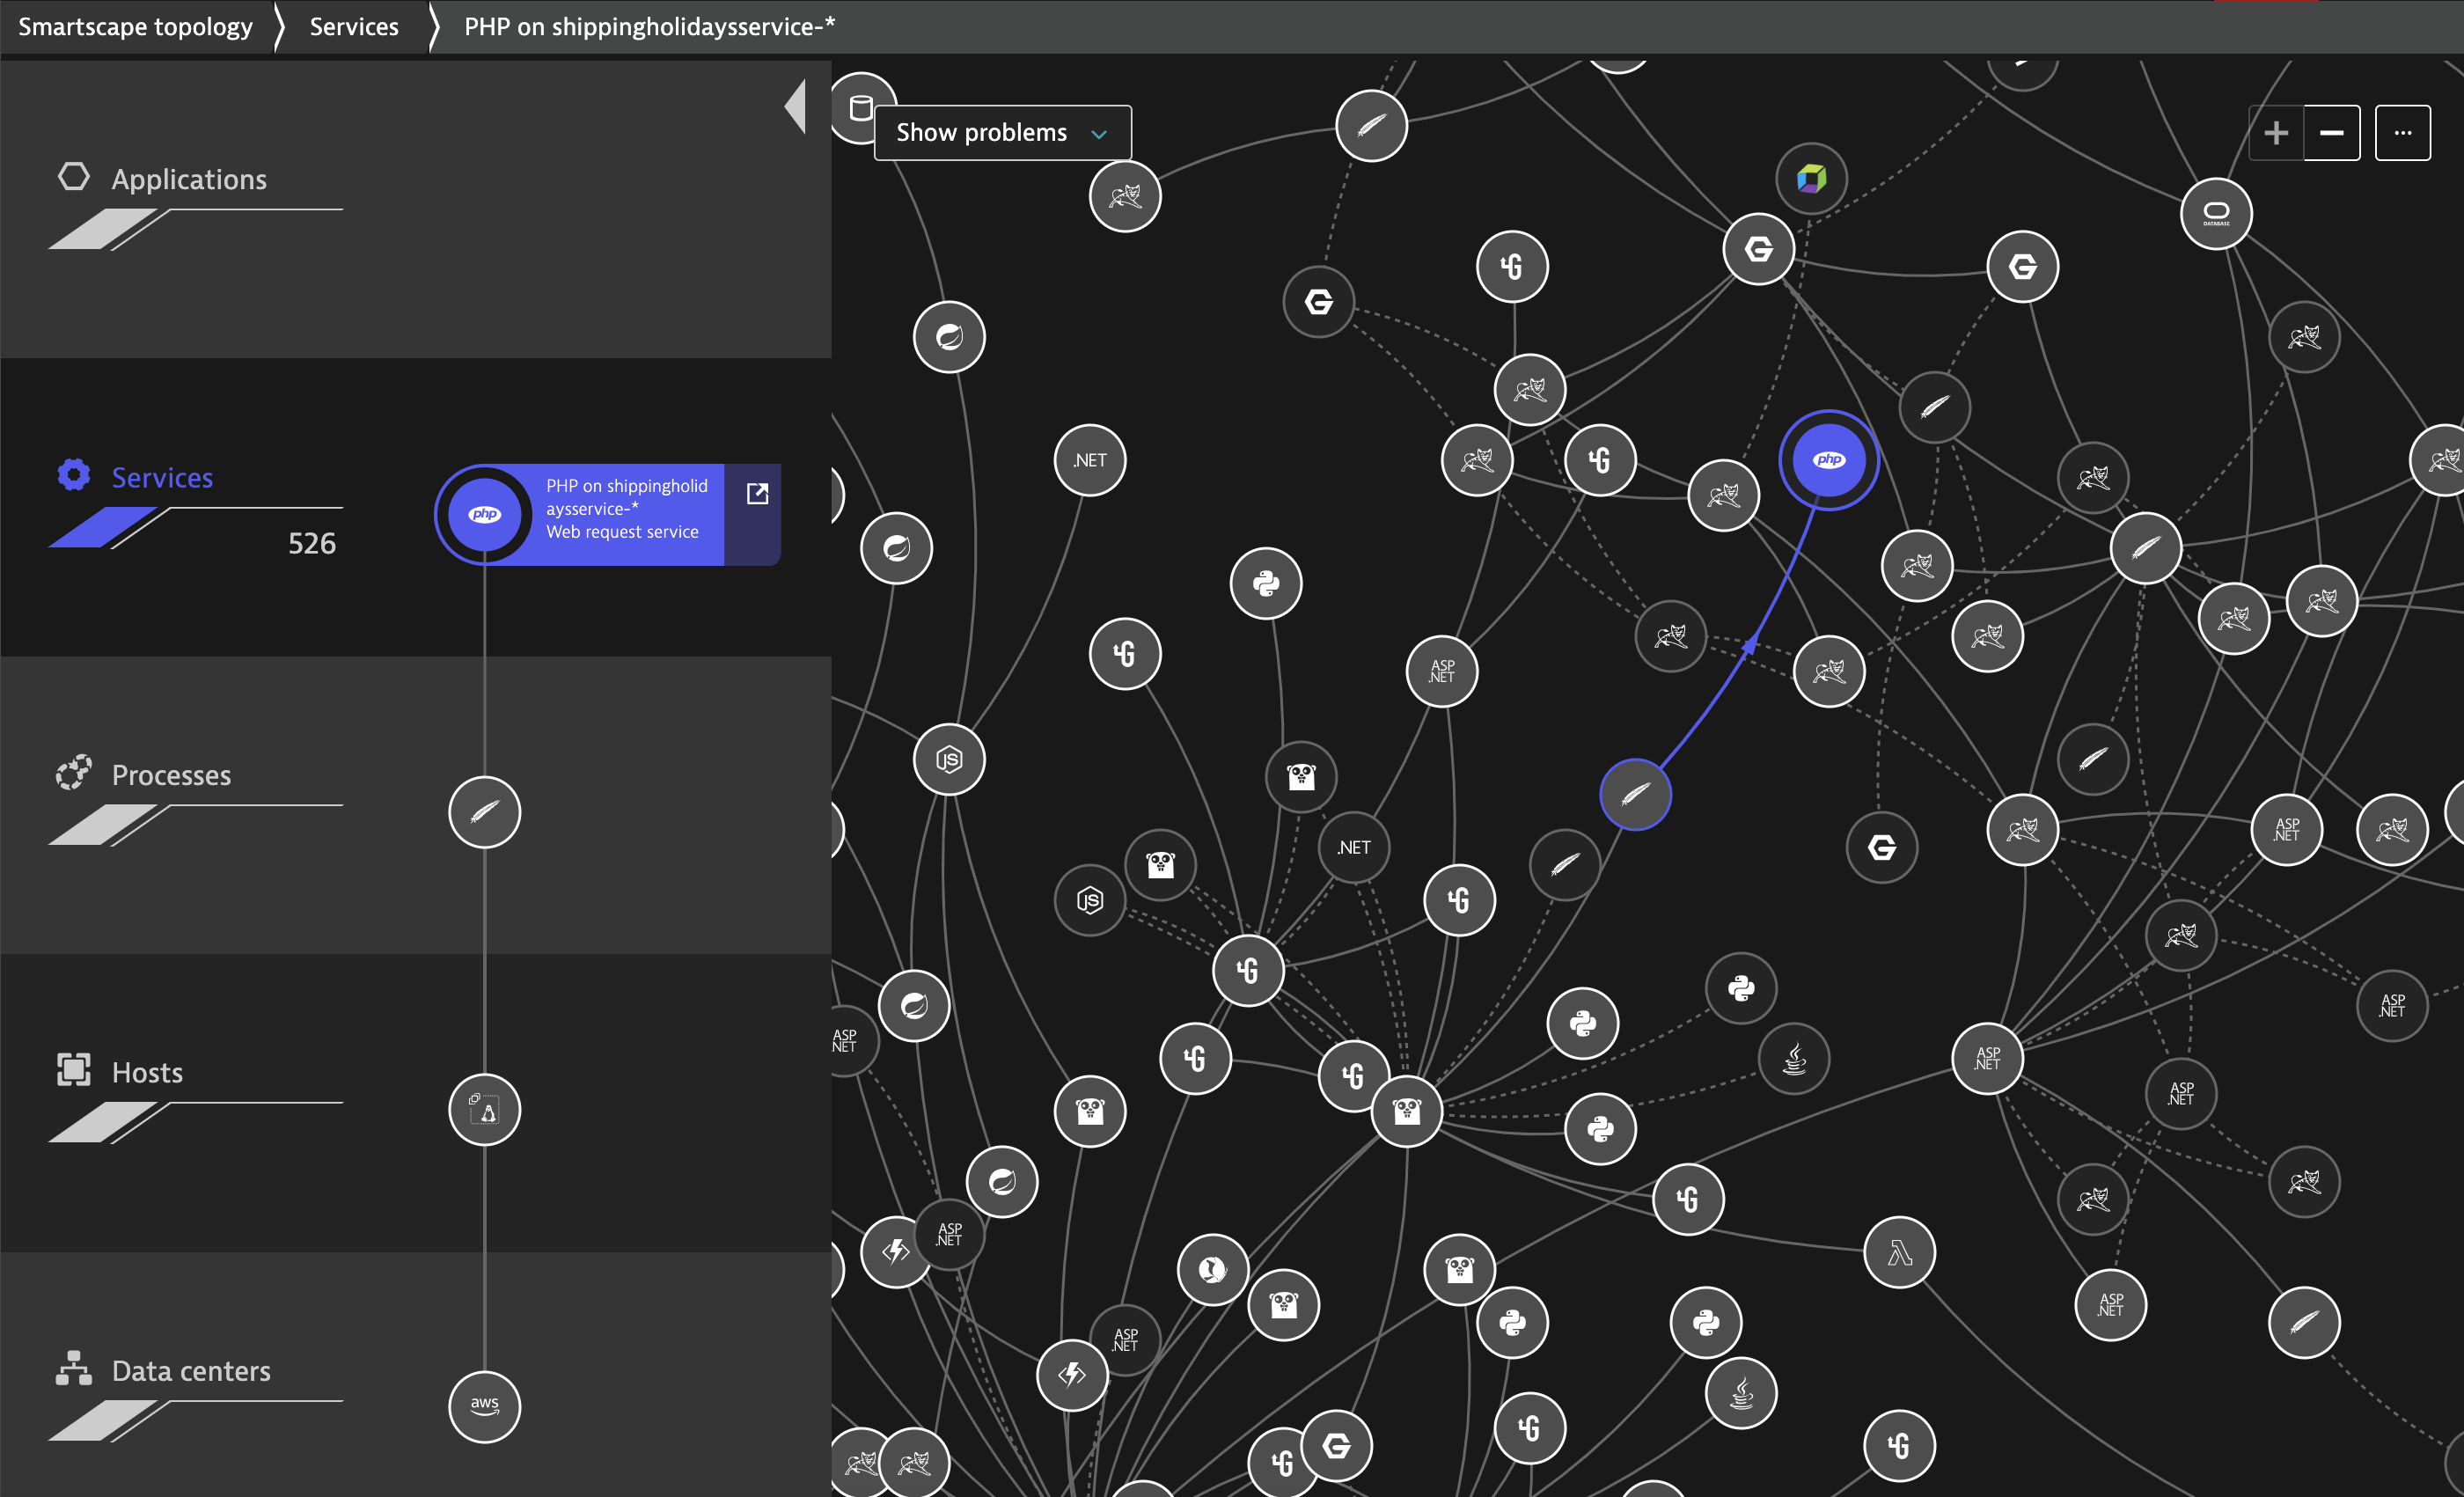
Automatically discover and map applications and infrastructure
Dynatrace automatically detects and visualizes your web application and its dependencies end to end: from website to application to container, infrastructure and cloud.
- Smartscape provides an interactive map of your application across all layers.
- Understand how all components relate to and communicate with one another.
- Get complete visibility into cloud environments where instances are rapidly created and deployed, making it ideal for microservice-centric applications.
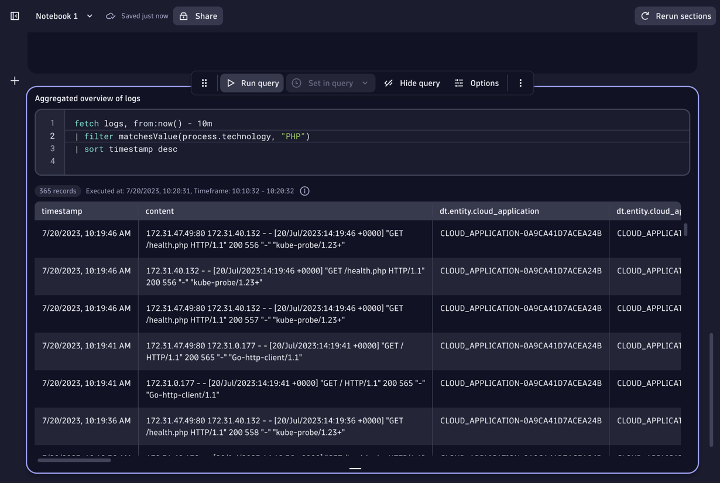
Get the full picture including network health and log file analysis
Dynatrace provides a clear picture of all inbound and outbound process connections over your network interfaces (both physical and virtual) and automatically discovers all log files on your monitored hosts and processes.
- Leverage actual data throughput and quality of network connections between communicating hosts and processes.
- Gain direct access and search the log content of all your system’s mission-critical processes.
- Factor in log messages and networking anomalies into problem root cause analysis.
Get all PHP performance details
- Worker processes
- Compilation time
- Execution time
- All database statements
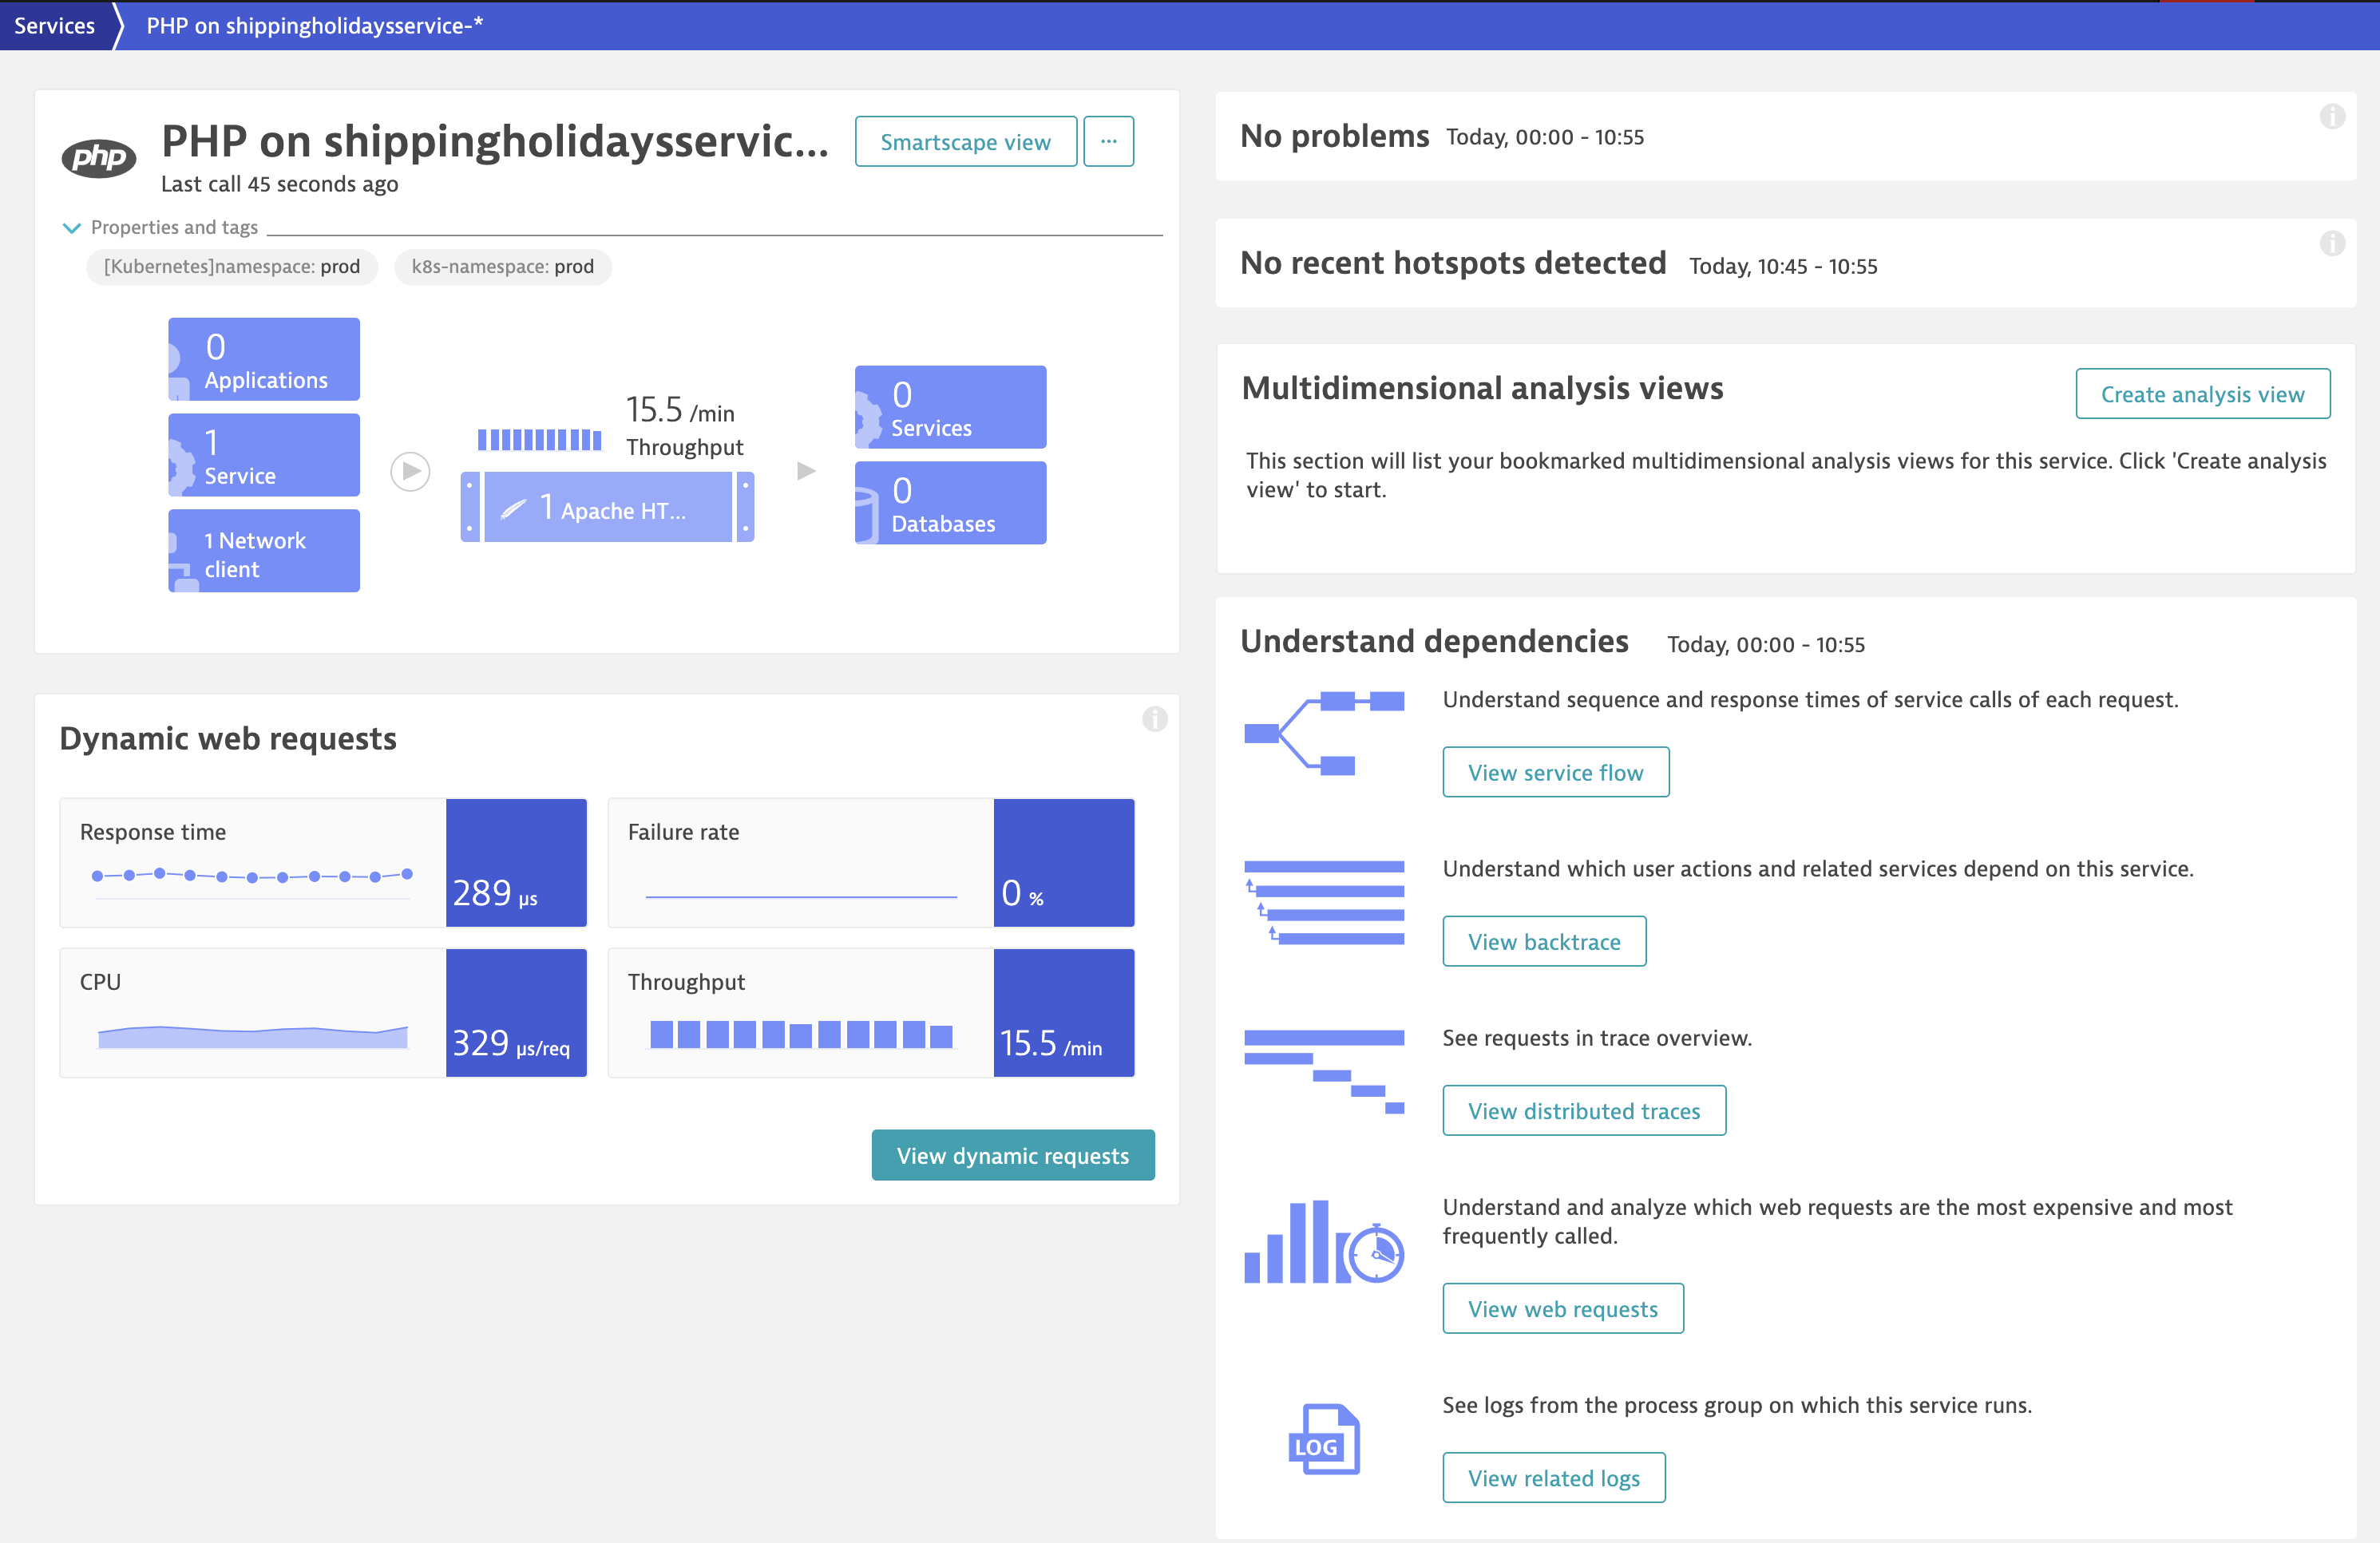
- All requests, all dependencies
- Response time
- Failure rate
- Throughput
- Request and response sizes
- Restarts, crashes, deployment changes
- Apdex score
- CPU and memory usage
- Garbage collection suspension time
- Network traffic
- TCP requests and retransmissions


With Dynatrace, we are now working based on facts, not assumptions. As a result, we're spending less time searching for the cause of issues, and instead getting on with working together to solve them.Paul Zimmermann Head of System Engineering, Migros Bank
Sign up for Dynatrace PHP monitoring today!


Ready to put the Dynatrace platform to work?
