
Following up on our charts for power users announcement a couple of weeks ago, we’re continuing to develop our custom charting capabilities. With version Dynatrace v145, we have further updates to share that make it easier for you to analyze peaks and build custom charts faster. This is again just a first wave of improvements; more updates will follow soon.
Easier drill-down analysis
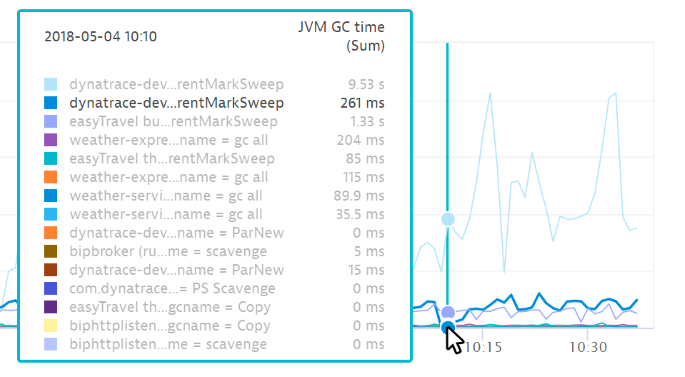
Dynatrace is all about guiding you to the root cause of performance problems. While Dynatrace AI does this for you automatically, you may additionally want to manually dive into all the available monitoring data that Dynatrace provides. To make such analysis easier, a hovering tooltip now appears when you hold your cursor over any point in a time-series chart (see example below). The tooltip details all splittings included in the time series, along with their metric values. The hovered series is highlighted in the chart and tooltip for easier drill-down analysis.
The next logical feature increment, which we are currently working on, is to allow you to focus on a time series with just a simple click and also highlight the series in a result table beneath the chart. We won’t stop here, however. We strive to make charts react more intuitively and to enhance your options for drill-down analysis.
Addition by subtraction
There were a number of intermediate steps in the workflow related to adding metrics to custom charts. By stripping the process down to the bare minimum, we not only spare our users unnecessary clicks, we also reduce confusion and provide a more stable interface.
For full details on creating custom charts, see How do I create custom charts?
We will continue to work on layout and workflow details of the custom charting view (for example, bringing the result table closer to the chart itself). We will keep you posted as we roll out future updates.
Be sure to check out our Community forum post that explains additional planned enhancements for custom dashboards.


Looking for answers?
Start a new discussion or ask for help in our Q&A forum.
Go to forum