
In my “Fearless from Monolith to Serverless” blog and presentation I gave at AWS Summit and other events, I focus on how to go about “virtually” breaking the monolith into smaller components / services.
The following animation shows how Dynatrace, through a feature called Custom Service Entry Points, can virtually break the monolith and give us valuable information about whether we should or should not break out certain pieces of the monolith. This approach allows you to do continuous experimentation. It gives you fast feedback without changing a single line of code:
In the discussions that followed my blog and my presentations, I learned that breaking the monolith needed more explanation, as I used a very simple application we at Dynatrace already knew well and therefore we already knew good candidates to “break out”.
In this blog post, I explain how I would go about breaking any type of monolith leveraging Dynatrace, especially if I would not be familiar with the ins and outs of the monolith and its dependencies.
Problem: We don’t understand our Monoliths
There are a couple of things most of us don’t know about monoliths:
- Who is depending on us and how are they depending on us?
- Whom are we depending on and how are we depending on them?
- What happens within our monolith code base when it gets called?
Step #1: Get Dependency Information
Installing the Dynatrace OneAgent on the hosts where you run your application, whether monolithic or already broken into services/containers, will immediately give us all dependency information:
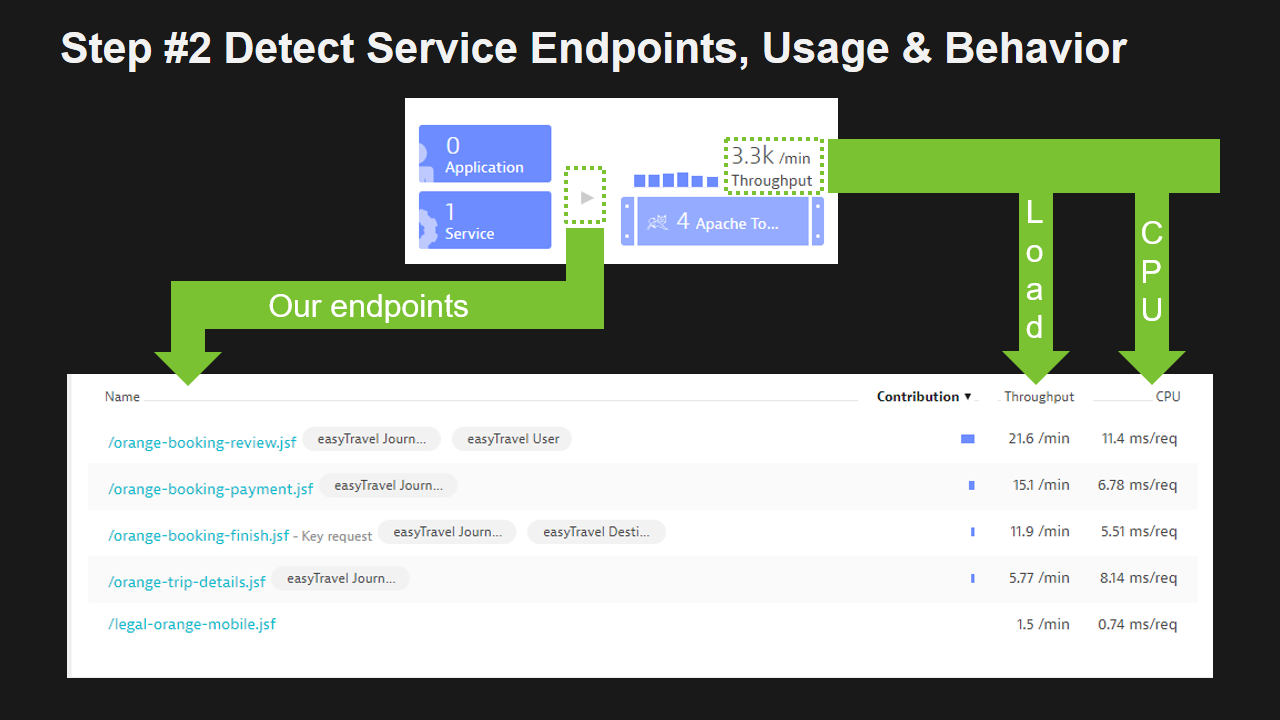
Step #2: Detect Service Endpoints, Usage & Behavior
After installing Dynatrace OneAgent, Dynatrace:
- Automatically starts capturing every single transaction end-to-end
- Automatically identifies all your applications endpoints, whether it is REST Endpoints, Web Services or Queues it is taking messages from
- Automatically gives us throughput and resource consumption per request
Having this information allows us to make better decisions on which endpoints we first want to consider for “breaking out of the monolith”. If we want to minimize risk, we might choose those entry points with the lowest throughput or those that are used by less critical applications. If we want to extract those that are heavy CPU consumers and therefore impacting other code in the same monolith we might pick those endpoints with the highest CPU consumption per request.
Step #3: Understand Service Flow per Endpoint
Another big factor in our decision should be how our individual endpoint implementations are consuming other dependent services. For that we can look at the Dynatrace ServiceFlow, filter it by each individual endpoint and learn more about which backend services get called how often.
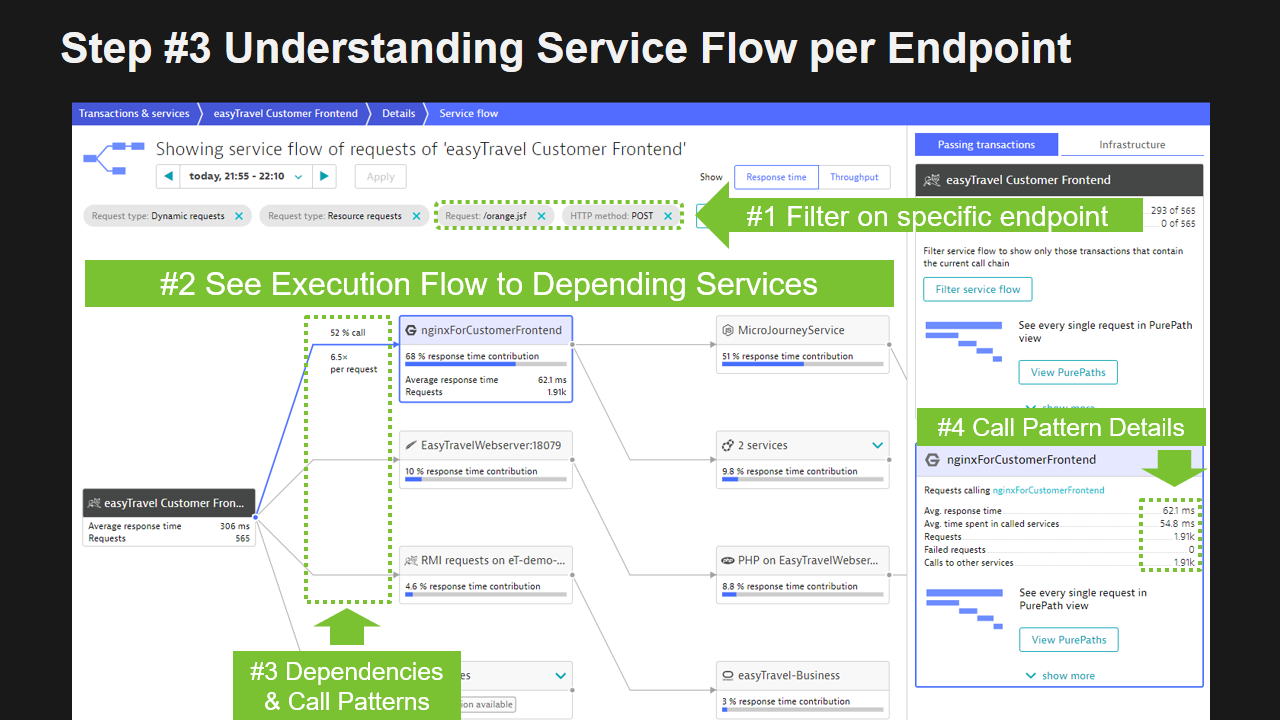
If we have strong dependencies on a backend service such as a database or an external service, make sure to factor this into any decisions when breaking out that implementation from your monolith. Your new service potentially runs in a different environment, maybe even in the cloud. The questions we have to ask ourselves:
- Can that service deal with connections from a new microservice?
- Was that backend service build to scale to many new incoming service requests?
- Will a potential change in network latency have an impact on our performance?
What have we learned so far with the help of Dynatrace?
Let’s take a short break and re-evaluate what we have learned so far:
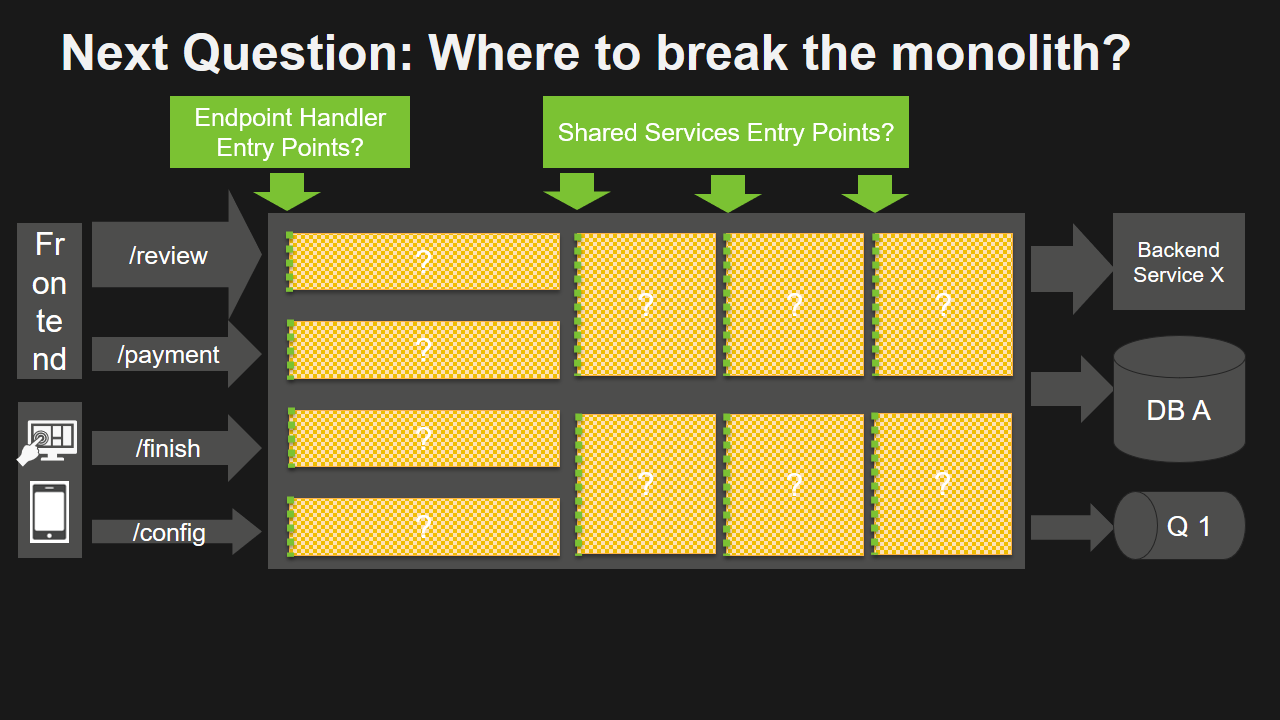
Next Question: WHERE to BREAK the Monolith?
By now we have a better understanding on WHAT to break out of the monolith and we have an understanding on how that potentially impacts the services & applications that are depending on us and those we are depending on.
The next big question is: HOW, or better, WHERE do we break the monolith?
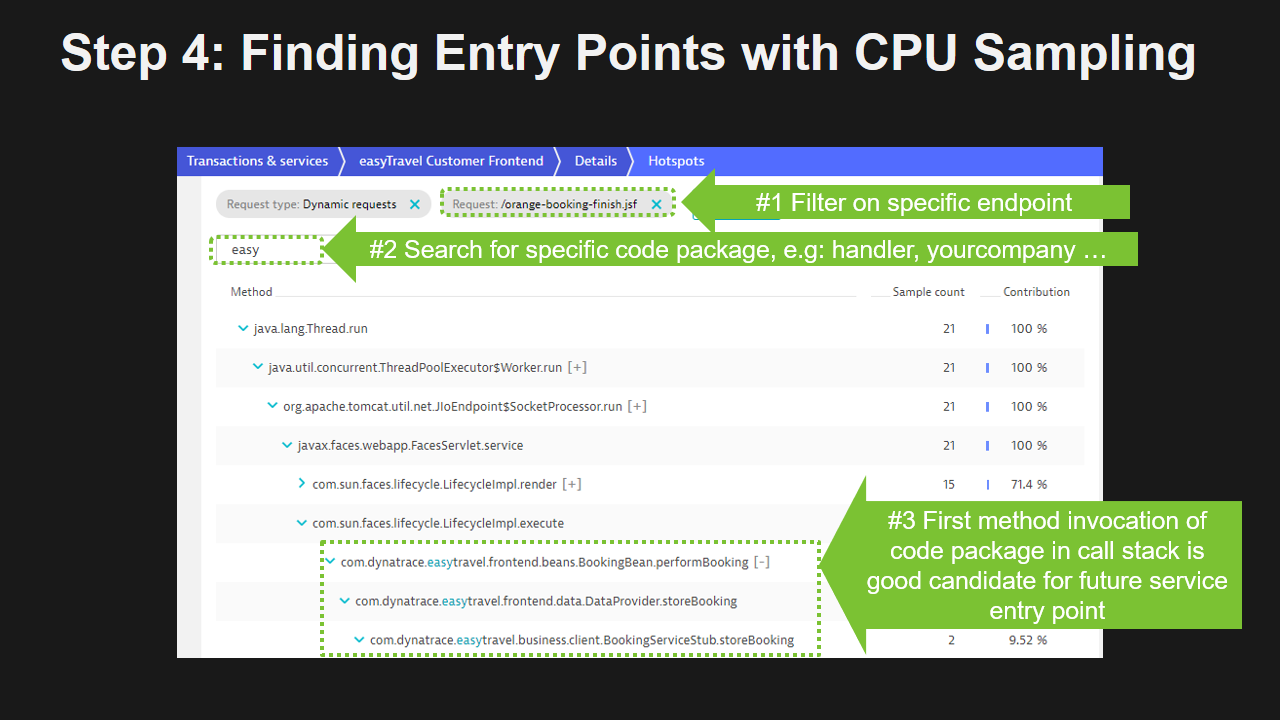
Step #4: Finding Entry Points with CPU Sampling Data
My approach to finding good candidates of current methods, classes or modules to break out of your monolithic code base is to learn which code gets executed when your endpoints are called. And more important: what is the first method that gets called in your own custom code in a certain module.
While Dynatrace automatically captures PurePaths based on our REST or Web Service Endpoints, it also automatically captures CPU Samples that shows us all the code that gets executed in your applications and services. The approach I take is to open up the CPU Sampling View, filter on the entry point method, and then try to find the first invocation of a method or a class that belongs to our own code base. For easyTravel I would therefore search for easy, or easyTravel as I assume that is part of the package or class name.
Another approach would be to find those methods that consume a lot of CPU. Might be a good thing to “break out” those parts of your code that are CPU intensive and try to run them in a separate service.
While this approach is not perfect – I believe it is a good way to start your “hunt for potential service entry points” within your monolithic code base.
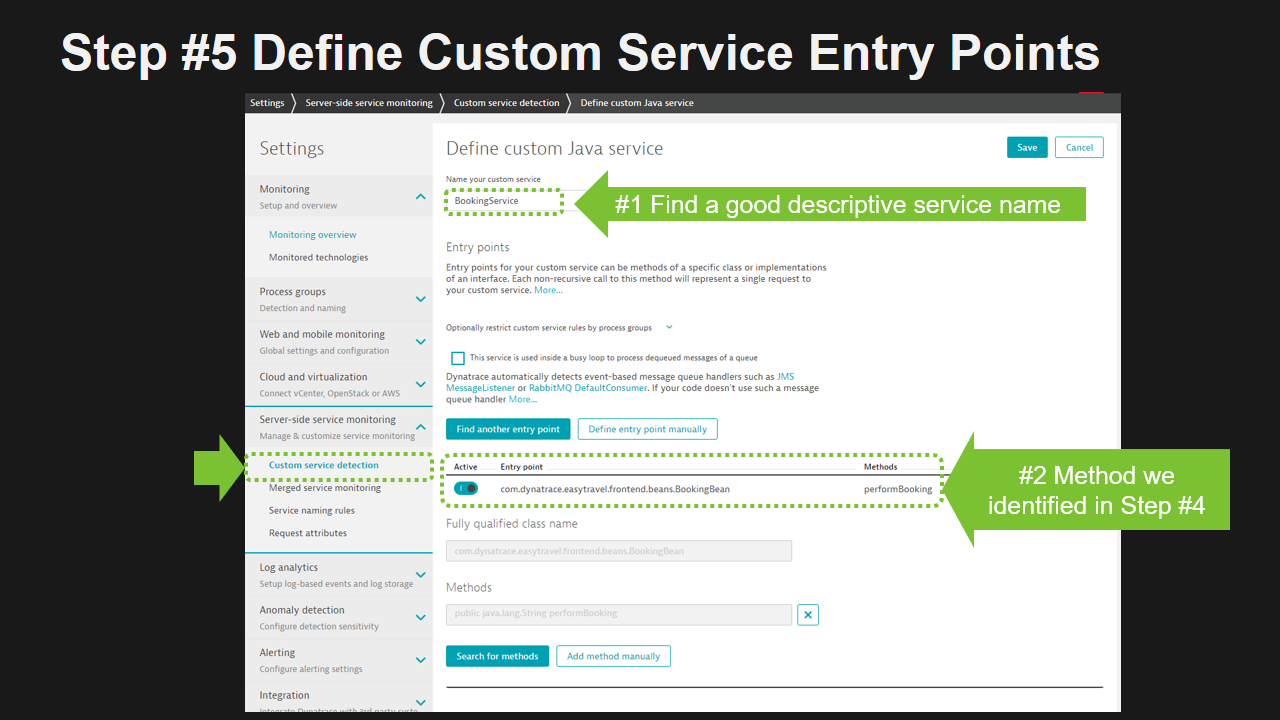
Step #5: Define Custom Service Entry Points
Once we found a good entry point candidate, we can use a feature in Dynatrace called “Custom Service Entry Points”. It is a feature that tells Dynatrace to treat a certain method in your code base as an entry point of a “logical service”. A method can either be defined to be an instance method of a class, an interface method or a method with a certain Java Annotation.
Repeat #4 & #5 for every entry point
We can repeat the following two steps and define more entry points. You should try to do it to virtually “break out” your code that handles incoming requests of certain endpoints. You should also do it for shared modules or components within your monolith that could potentially become shared services.
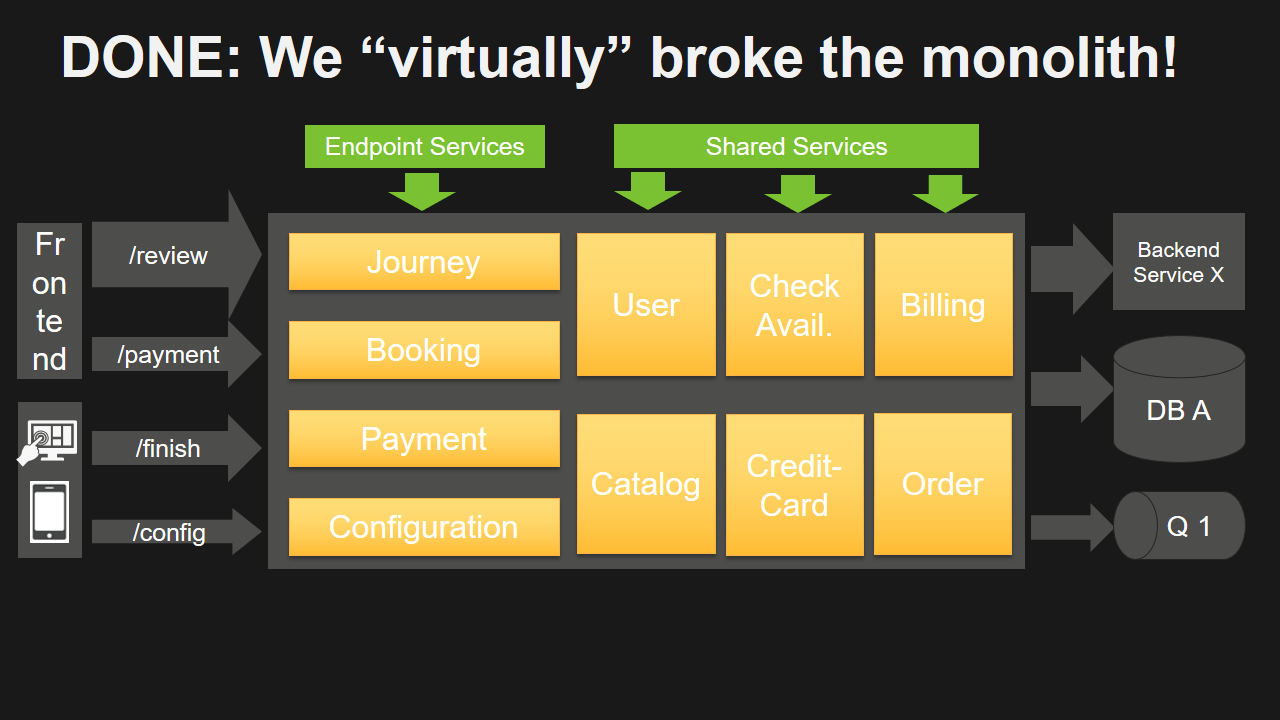
DONE: We “virtually” broke the Monolith
We came a long way from where we started:
Step #6: Learn and Refine based on Dynatrace Data
Now it’s time to learn on whether breaking out these functions, modules or components is in fact a good idea or not. For that we can start looking at Dynatrace Service Flow which now no longer just shows us the big monolith. It breaks the monolith into every single “virtual” service and shows us how these services are called, whom the call, how often, …
This is a great way to learn about actual dependencies between your individual pieces of your monolith and how these individual pieces are connecting with the backend services. You will learn which parts of your monolith are
- GOOD candidates, e.g: loose dependencies to one or more other components
- BAD candidates, e.g: they have very tight dependencies, are called multiple times (N+1 pattern) by the same depending component
Step #7: Start re-factoring your code
I see all steps above as a great way to “experiment” with your existing monolith. Remember – so far we have not done any actual code changes. We basically “simulated” how our code would look like if it would be “broken” along certain methods in our monolithic code base.
What we really have is better insights into our dependencies and our inner code workings. We can start our actual re-factoring based on more factual data. We can start breaking the monolith where our data shows it makes sense and we can leave those parts alone where it probably doesn’t make sense right now.
GO AHEAD! GO RE-FACTOR!
Step #8: Continuously Validate new Code Base
After you have broken out your first services make sure to continuously validate how your new code base really works. Compare what you had in mind and how it turned out. Also make sure to keep validating the ServiceFlow after every re-factoring project. This will alert you in case something doesn’t go as planned and allows you to correct actions before you push out your changes into a higher-level environment such as production!
Thanks to the Dynatrace REST API, we can automate this validation process. My recommendation is to add a Dynatrace quality gate into your CI/CD process that alerts the pipeline in case dependencies between your services change. Imagine this: you refactor your code, commit the change and your pipeline automatically tells you that you just added 2 new dependencies! Fully automated!
If you want to learn more check out the work I have done around the “Unbreakable Delivery Pipeline” where I show you to use Dynatrace data as a Build Validation / Quality Gate Step.
GO BREAK MONOLITHS!
I hope this blog shows you how Dynatrace can not only be used to monitor your existing applications, services, infrastructure and end users. Knowing that many of you out there will be challenged with the task of breaking legacy monolithic applications, I hope this shows you that Dynatrace can also support you in these projects. I believe Dynatrace will save you time as you can “experiment” on how to break the monolith without making code changes first. These types of experiments give you faster feedback on whether you are going down the right or the wrong path.
If you give it a try and have questions feel free to reach out. Happy to have a look at your monoliths and give you recommendations on how and where I would break it!


Looking for answers?
Start a new discussion or ask for help in our Q&A forum.
Go to forum