
Using tags to organize and label all the monitored components in your environment is a great way to filter server-side services for purposes of developing component-specific dashboard charts and assigning responsibility to specific team members or groups. However, managing and applying tagging within large, dynamic environments can be a real challenge. To address this, Dynatrace now provides a rule-based approach to tagging that gives you the flexibility you need to take maximum advantage of Dynatrace Smartscape topology modeling, auto-detection of processes and services, and built-in domain expertise.
To define a rule-based tag
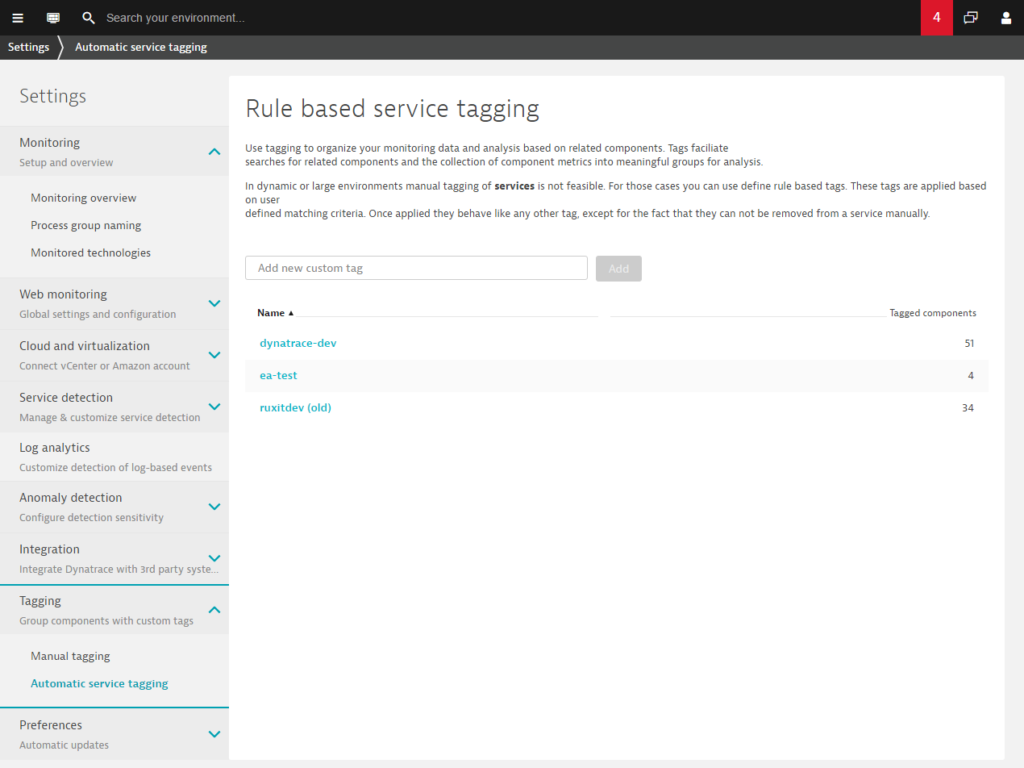
- Go to Settings > Tagging > Automatic tagging.
- Type a name for the new tag in the Add custom tag field.
- Click the Add button to add your new tag.
- Select the newly created tag from the list below to edit rules for the tag.
- You can define multiple rules for each tag. Rules are executed in order. As soon as one rule meets all conditions, the tag is applied and no further rules are executed.
- The first thing to consider is whether or not you want to restrict the rule to a specific process group, technology, or service type. While this step is optional, it provides a quick means of reducing the number of services that a rule applies to.
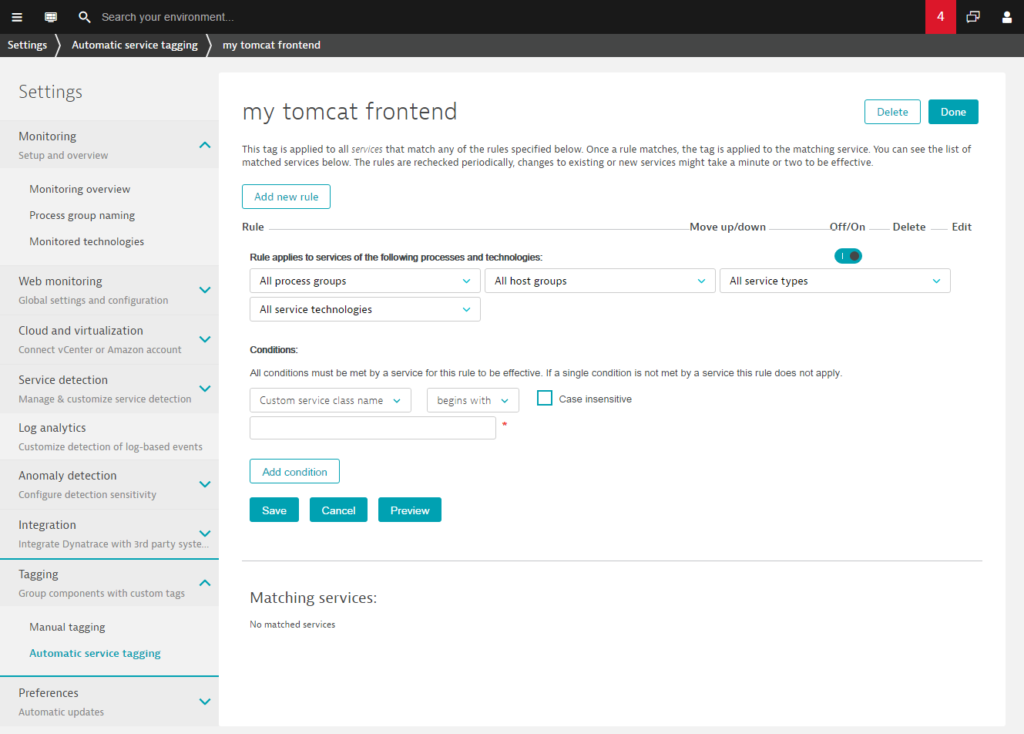
- You can then add one or more conditions to the rule that a service must meet before the tag applied.
Conditions can check for specific values within any service property that Dynatrace displays (for example, Web application ID). To find the Web application ID or other properties of your services, go to the service’s page and expand the Properties and tags section (as shown below). The list of conditions also contains properties of processes and hosts. If you select one of these, then the rule will be applied only to those services that run on that specific process or host.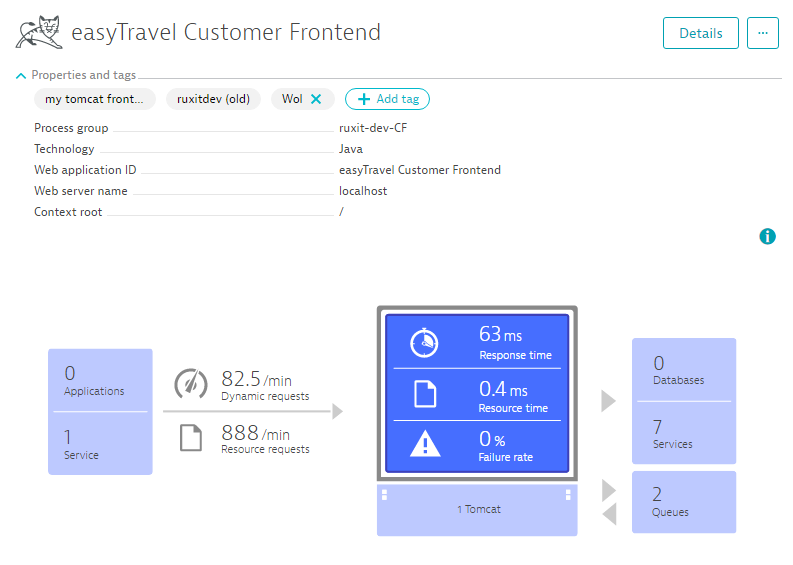
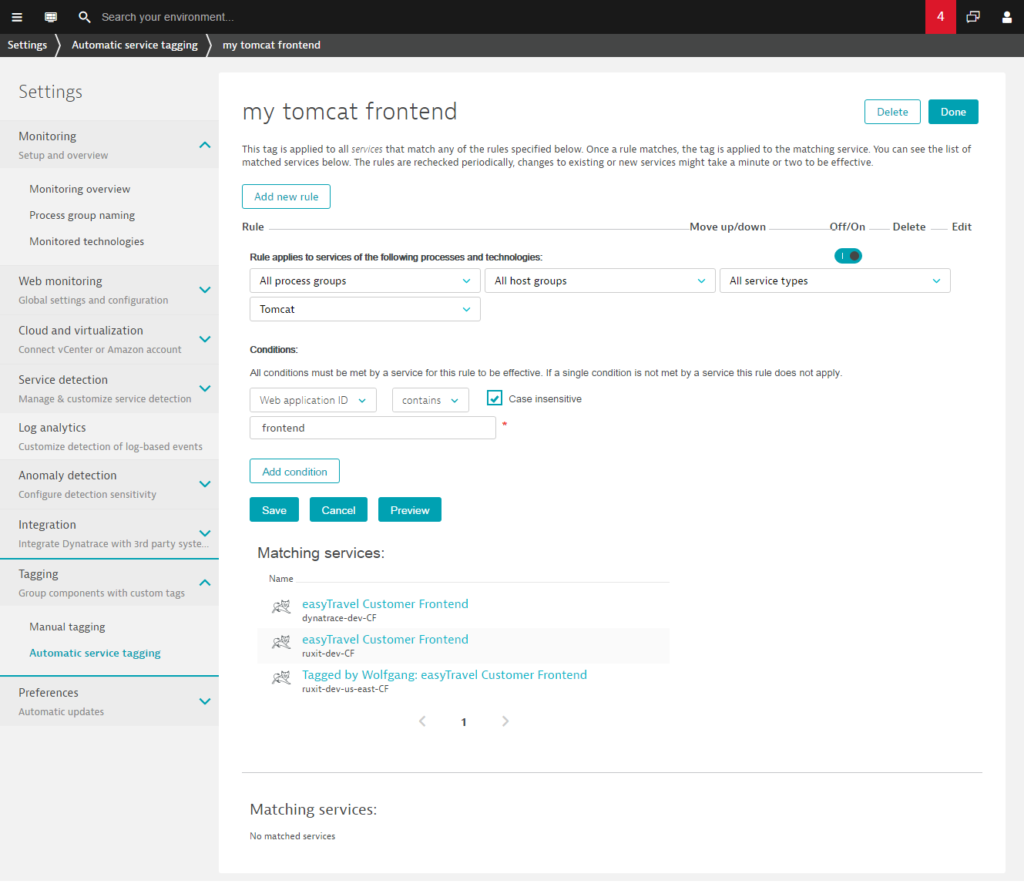
- Once you’ve created a rule, click the Preview button to verify the services that are returned by the rule. Note that to be successfully tagged, a service must meet all of the specified conditions of the rule.
- Click Done at the top of the page to save your tag. Rule-based tags are applied automatically to all existing and newly detected services.
Note: It may take up to a minute before your new tag is applied. Once a tag is applied to a service, the tag is listed on that service’s page within the Properties and tags section.
There are numerous ways by which you can combine tags, rules, and conditions when organizing your services. For example, you can define multiple conditions within a single rule or you can define multiple rules for a single tag. For a rule to be met, all conditions of the rule must be met. In other words, conditions are combined using an implied AND operator. The rules themselves are executed independently from one another other, and so are combined using an implied OR operator.
In this way, you can build tagging rules for all kinds of scenarios.
Define more complex & granular rules
Dynatrace automatically discovers all of your hosts, processes, process groups, and services—in addition to the dependencies between these components. Dynatrace also discovers metadata across each layer in your environment’s topology. This is the same metadata that Dynatrace uses to develop Smartscape topology maps. This same metadata and topology modeling can now be leveraged to define complex and powerful service-tagging rules. The example below shows a rule that filters services that are of type WebService, run in a Tomcat, and have detected process group names that include the string BB.
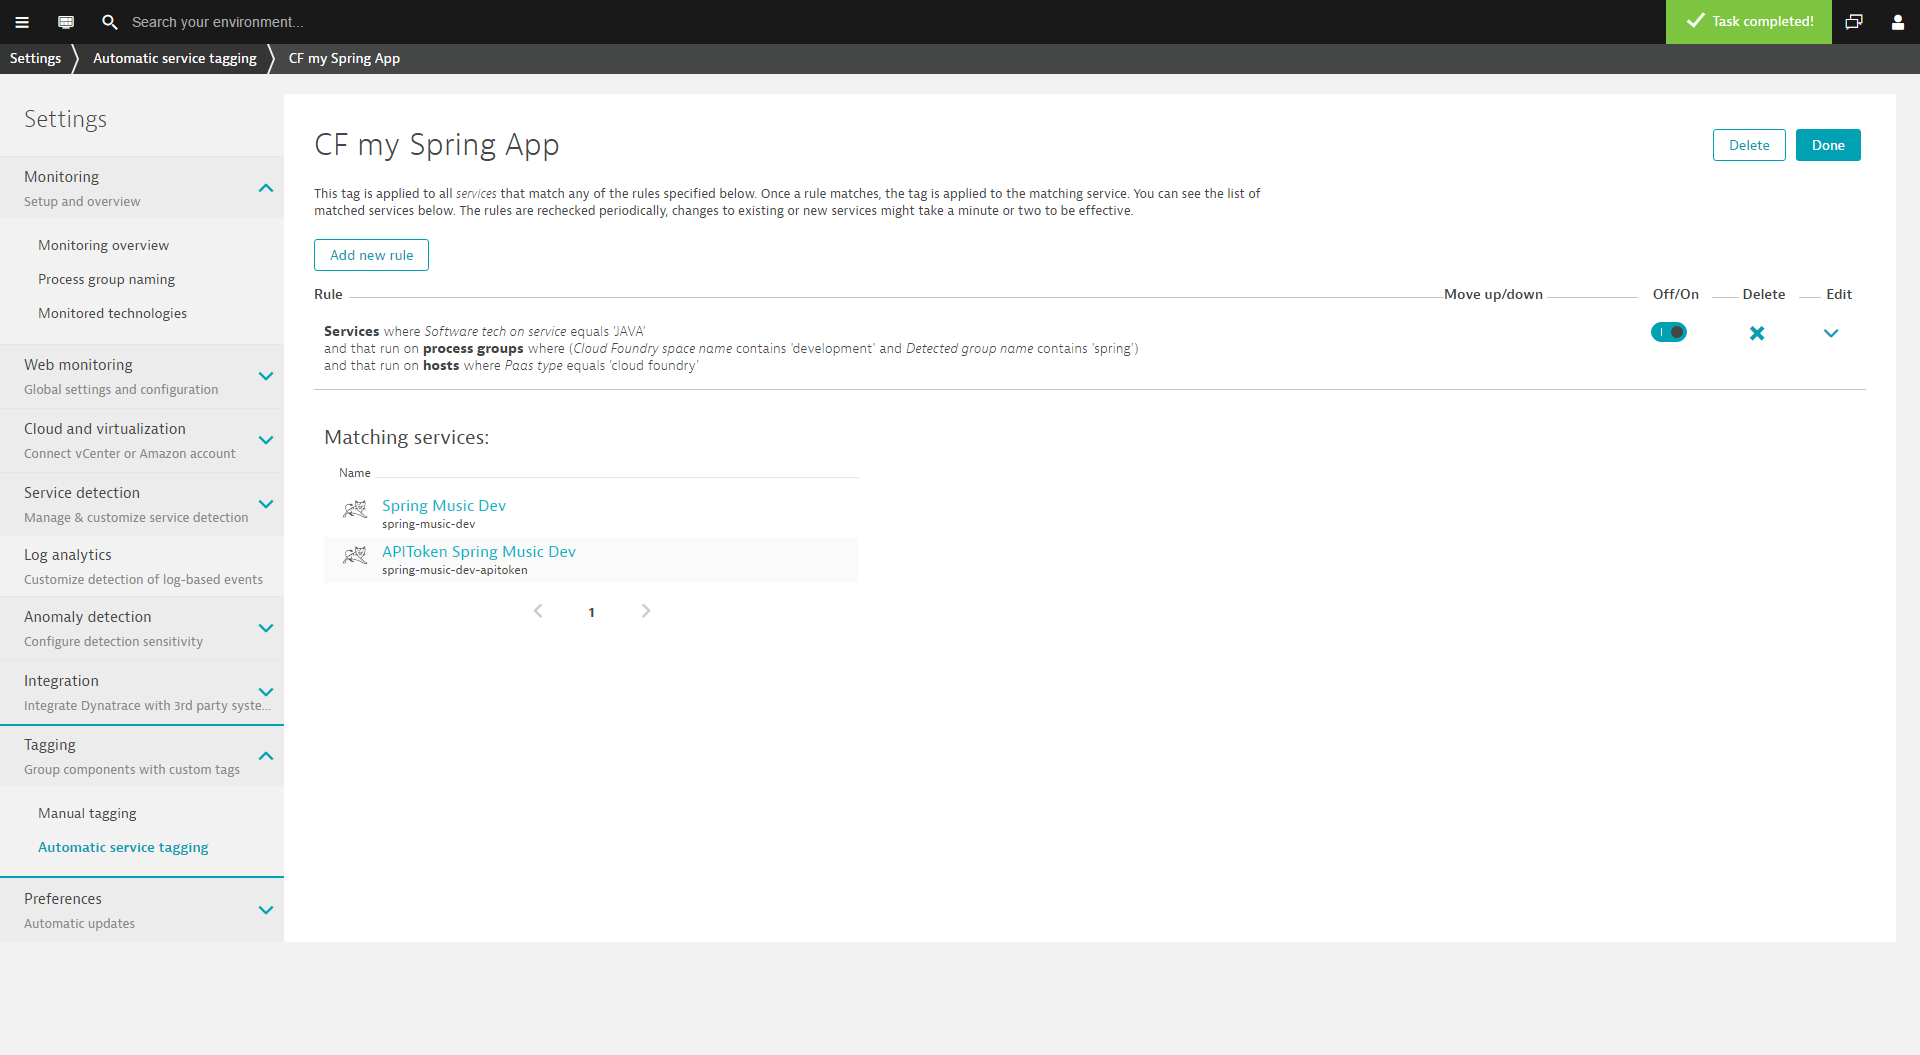
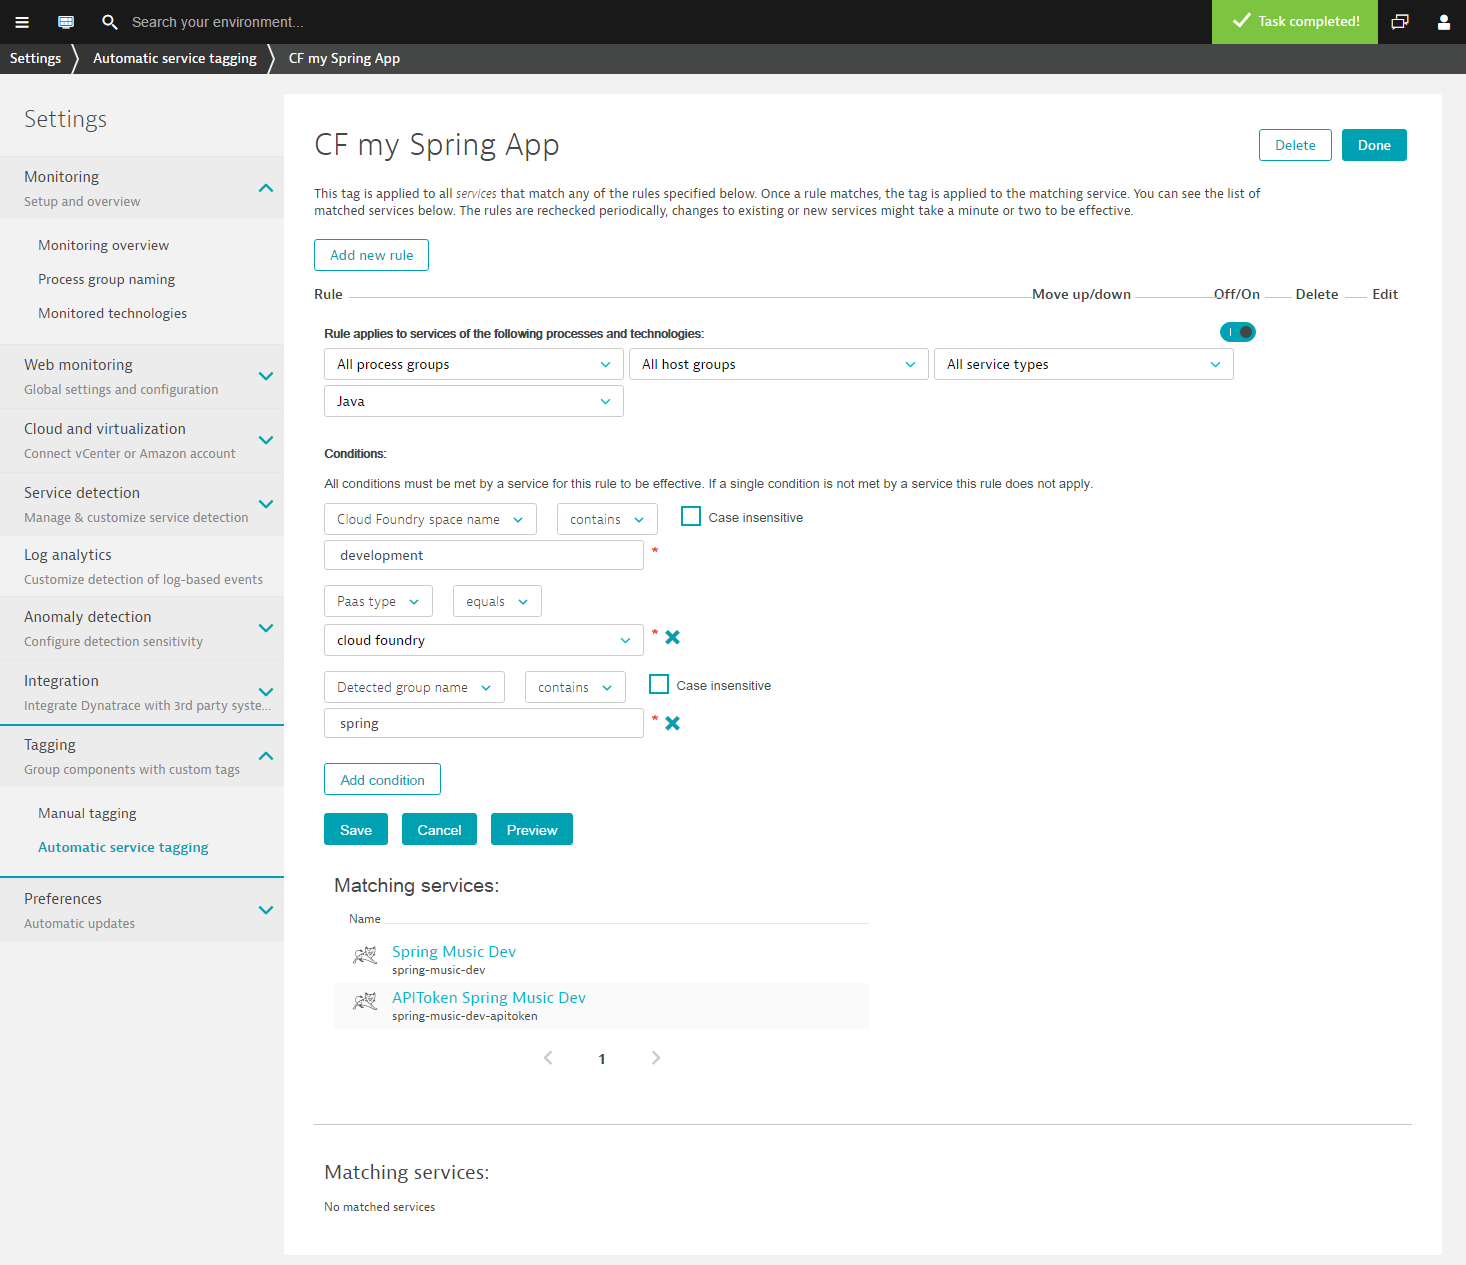
Another powerful service-tagging rule example (shown below) matches all Java services that run in specific process groups within a Cloud Foundry space called Development within a Cloud Foundry PaaS setup within a detected process group name that includes the string spring.

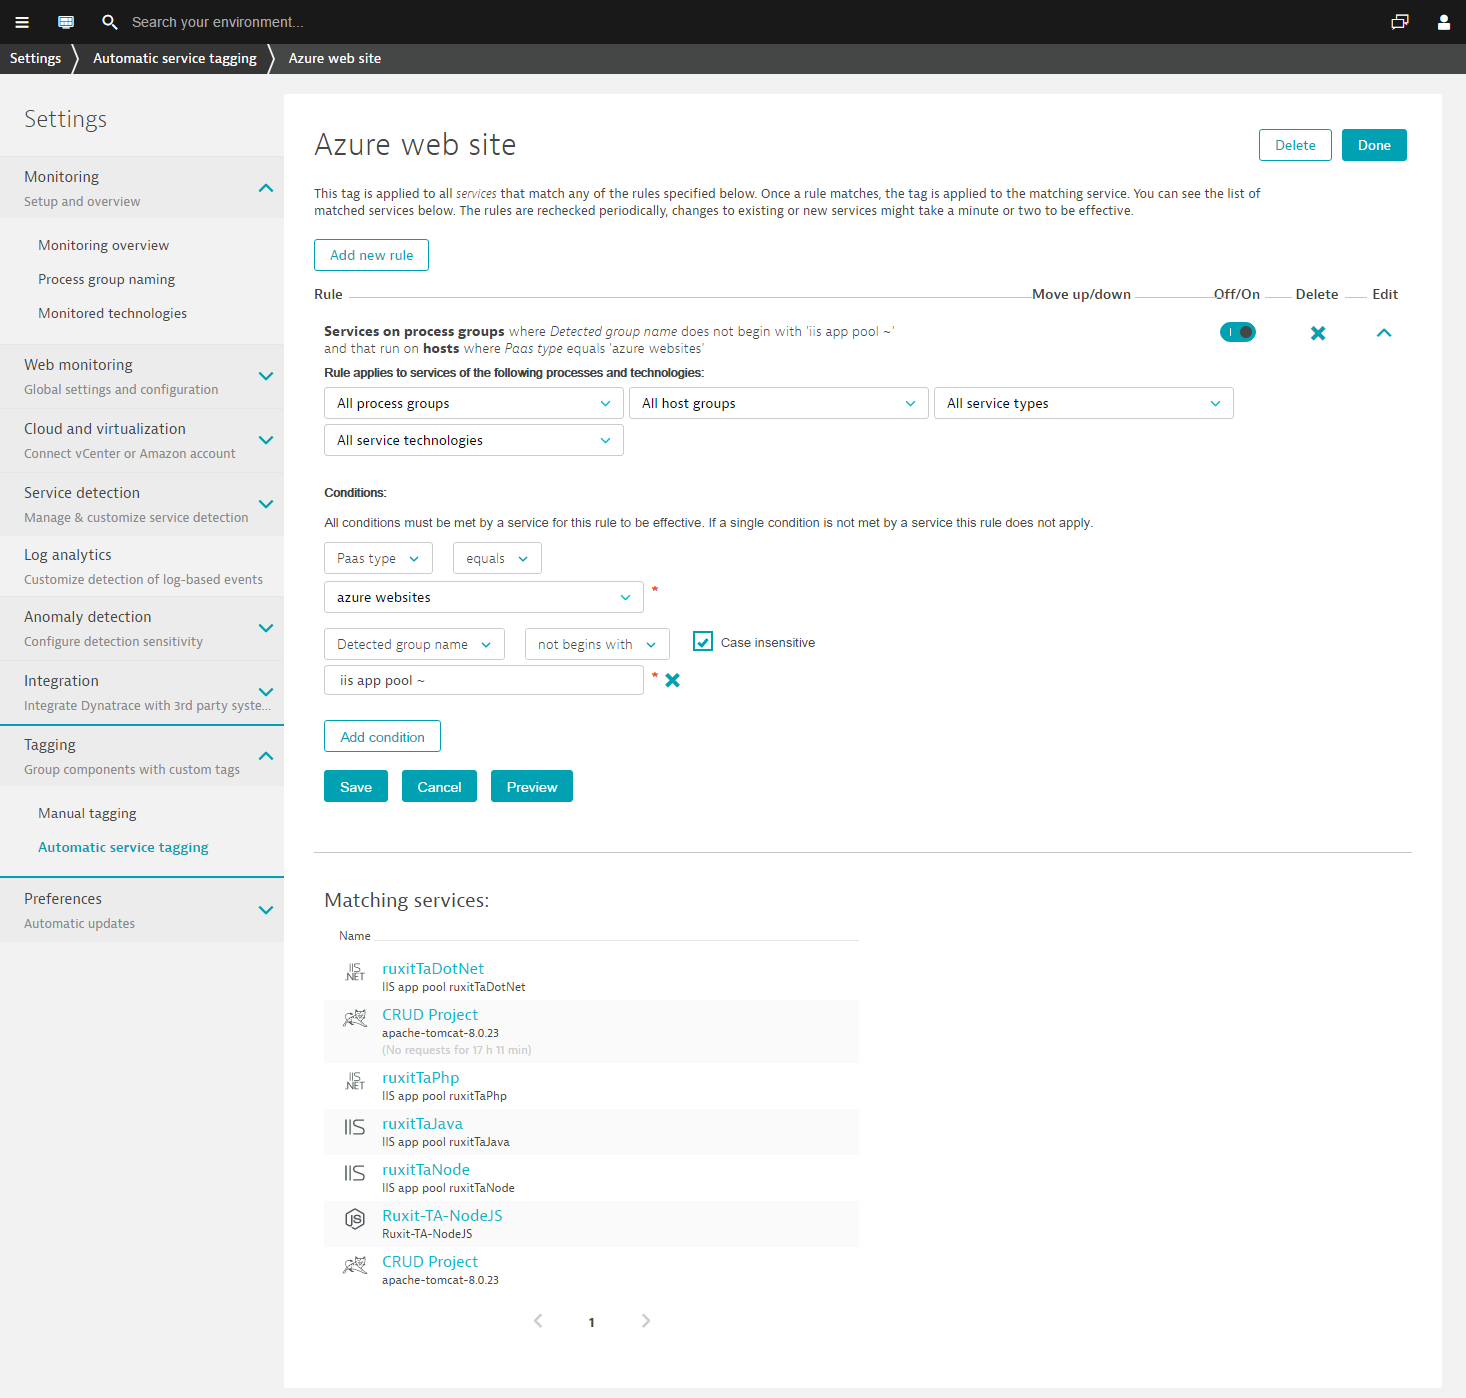
The example below shows a rule that applies a tag to all non-admin Azure Web Sites services.
Service properties available for tagging
The specific service properties available to you for tagging varies based on technology type.
To find out which properties a service provides
- Select Transactions & services from the navigation menu.
- Select the service that you want to tag.
- Expand Properties and tags to display the available properties.
To find out which properties a process group provides
- Select Hosts from the navigation menu.
- Select the host that includes the process group you want to tag.
- Expand Properties and tags to display the available properties.
Here is the current list of service properties supported by Dynatrace for automated service tagging. This group will be expanded over the coming weeks.
Service properties
Custom service class nameDatabase nameDatabase vendorDetected service nameService portService tagsWeb application IDWeb context rootWeb server nameWeb service nameWeb service namespace
Process properties
Apache config pathApache spark masteripaddressAzure web apphost nameAzure web app site nameCatalina baseCatalina homeCloud Foundry application nameCloud Foundry instance indexCloud Foundry space IDCloud Foundry space nameColdfusionjvmconfig fileColdfusion service nameDetected group nameDetected process nameDocker container nameDocker image nameDotnet commandDynatrace custom cluster IDDynatrace custom node IDElastic search cluster nameElastic search node nameExe nameExe pathGlassFish domain nameGlassFish instance nameIIS app poolIIS role nameJava jar fileJava jar pathJava main class- Jboss
home - Jboss
mode Jboss server nameKubernetes base pod nameKubernetes container nameKubernetes full pod nameKubernetes namespaceKubernetes poduidListen portNodejs app nameNodejs script nameRuby app root pathRuby script pathVarnish instance nameWeblogic homeWeblogic name- Webshpere
cell name - Webshpere
cluster name Websphere node nameWebsphere server name
Host properties
AWS availability zoneAzure SKUAzure compute modeAzure web app host name(s)Azure web app site name(s)Cloud typeDetected name of hostHostip addresseHost tagsInstance id of ec2Local host name of ec2Paas typePublic host name of ec2
Take full advantage of service tags
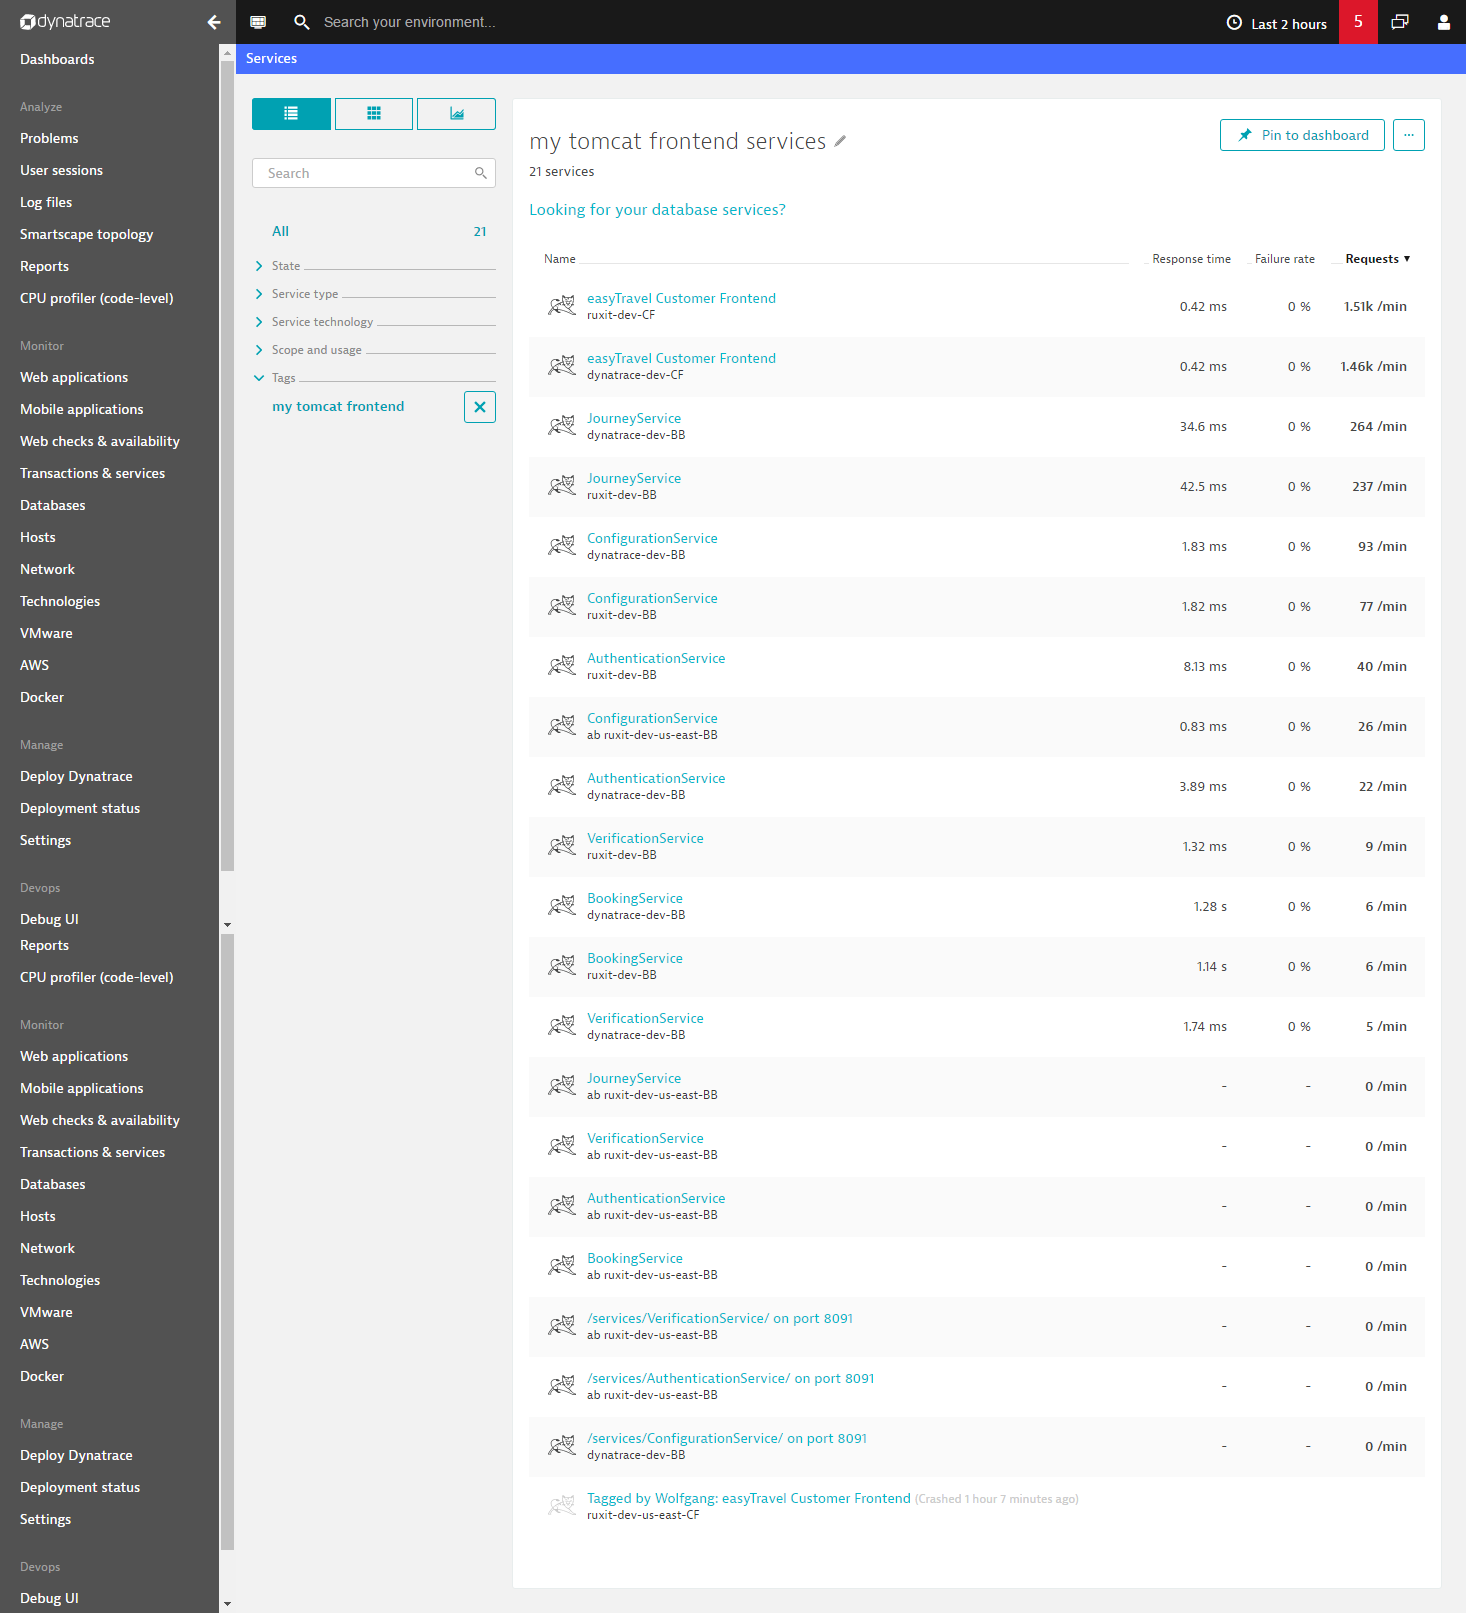
Service tags can be leveraged in a number of ways. For example, within the Services list (Transactions & services > Services) to filter services based on technology type or other criteria (see example below).
Once you’ve selected a tagged group of related services, it’s easy to focus your analysis on those services. For example, click the Chart button at the top of the Services list page to generate tag-specific charts for the selected services (see example below).

Newly deployed services that match your tagging rules are automatically tagged and added to your charts! Tag-specific charts can even be pinned to your home dashboard. This provides a great option for providing responsible teams and staff with performance insights into their specific areas of responsibility.
Tagging for efficient problem-notification routing
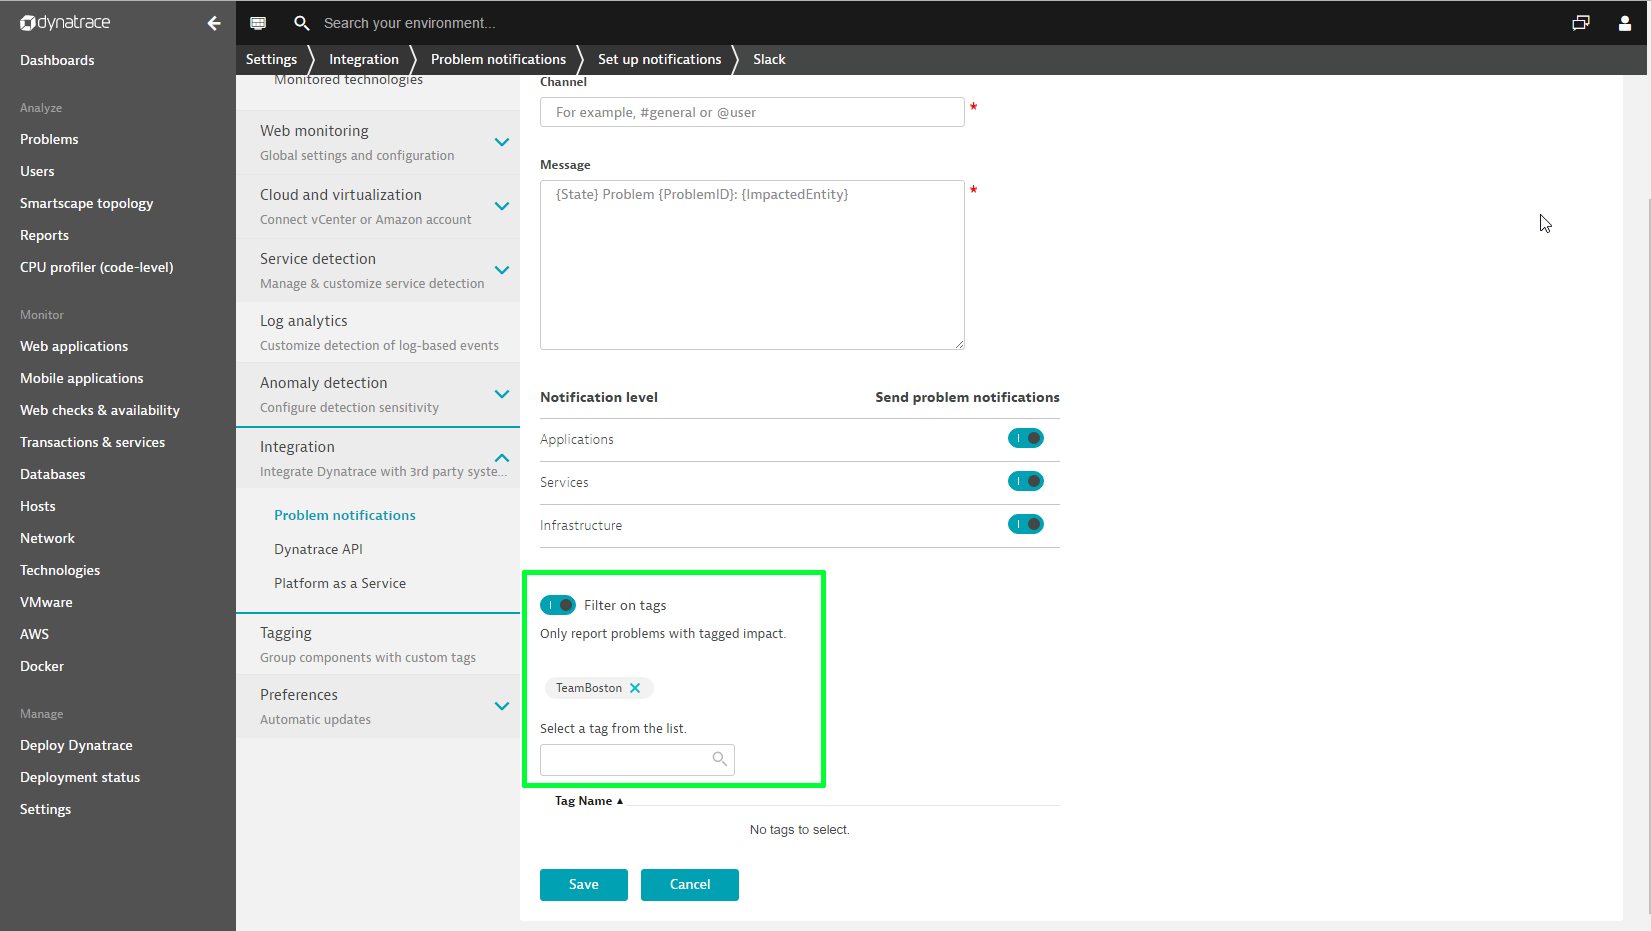
You can also use tags for efficient routing of problem notifications to responsible team members. When setting up notification integration (Settings > Integration > Problem notifications), enable the Filter on tags switch (see Slack example below) and assign relevant tags. Once set up, the next time a problem notification is sent out, Dynatrace will check to see if any affected services carry properties that you’ve defined in your service tags. In this way, when critical parts of your environment are affected by a detected problem, the related notification will be delivered to the appropriate teams.
Pre-requisites
- OneAgent version 1.111 or higher is required to generate the correct metadata for Cloud Foundry, OpenShift, and Azure Web Sites processes.
- Usage of the
DT_CLUSTER_IDenvironment ID leads to loss of some metadata within specific process. This issue will be addressed in OneAgent version 1.113.


Looking for answers?
Start a new discussion or ask for help in our Q&A forum.
Go to forum