
While machine learning and AI offer similar benefits, they're not the same. So, what is artificial intelligence? Discover how it differs from machine learning for IT operations and more.
As more organizations are moving from monolithic architectures to cloud architectures, IT complexity is exploding. These systems are generating more data than ever, and teams simply can’t keep up with a manual approach. In response, organizations are increasingly turning to artificial intelligence and machine learning technologies to get analytical insights from their growing volumes of data.
Both machine learning and artificial intelligence offer similar benefits for IT operations. As a result, they’re often used interchangeably. However, they’re not identical.
So, what is artificial intelligence? How exactly does it differ from machine learning? And where are these tools best used in IT operations?
What is artificial intelligence?
Artificial intelligence (AI) refers to a system’s ability to mimic human cognitive function. AI applies advanced analytics and logic-based techniques to interpret data and events, support and automate decisions, and even take intelligent actions.
As technological complexity and risks increase, human-only approaches prove insufficient. They need to be augmented with AI technologies to successfully tackle the challenges of complexity and uncertainty. By processing vast amounts of relevant data across domains and tiers and automatically finding relationships between systems and processes, AI becomes very good at answering even highly complex questions.
What is machine learning?
Machine learning (ML) is a subset of AI that uses data and algorithms to improve AI. Largely using statistical methods, ML algorithms are used to make classifications or predictions that are then used to uncover key insights. Machine learning applications may be developed standalone, but they’re often part of larger AI systems. Machine learning algorithms use vast amounts of data to train systems and allow them to draw accurate conclusions based on available information.
There are two broad types of machine learning: supervised and unsupervised. Supervised learning uses already-labeled data to train algorithms for specific outputs. For example, a supervised learning effort might supply machine learning tools with labeled pictures of cows and horses. After enough exposure to this data, the algorithm can accurately determine which is which. This is often known as classification applications. Unsupervised learning, meanwhile, uses unlabeled data that allows machine learning algorithms to discover potential patterns on their own. This is often known as prediction applications.
So, what’s the difference between AI and machine learning? Put simply, AI is the framework that allows systems and devices to think like humans and perform tasks without direct oversight. Machine learning algorithms make it possible for AI tools to develop their intelligence over time and improve the reliability of their outcomes.
What is artificial intelligence for IT operations?
AIOps is an emerging IT practice that combines machine learning and AI to help organizations cut through the noise of IT operations. This often includes high alert volumes, false positives, and ongoing user behaviors that require IT attention. AIOps tools aim to block out the noise and allow teams to pinpoint the source of problems as quickly as possible.
Rather than spending days or weeks searching for a specific process that’s triggering system-wide alerts, AIOps makes it possible to quickly track down and eliminate the source of the problem.
Machine-learning-enabled AIOps vs. deterministic AIOps
Much like the close-but-not-identical concepts of AI and machine learning, there are two common models for AIOps: traditional, machine-learning-enabled AIOps and deterministic AIOps that relies on causal AI.
In a machine learning model, a statistical analysis of current metrics, events, and alerts helps build a multidimensional model of a system to provide possible explanations for observed behavior. Often, the machine learning model uses correlation of time-stamps and other fields as the primary technique to relate disparate data streams. Over time, these models become more accurate as they ingest more data and improve at connecting the operational dots.
Deterministic AIOps, meanwhile, relies on high-quality data from all layers of the stack. It emphasizes not only data collection, but also how all the data is related to each other. Causality techniques are then used to derive the right context for analysis. It uses a step-by-step fault-tree analysis to precisely identify the cause of problems in near-real time. Deterministic AIOps offers the advantage of step-by-step process visibility that delivers precise answers powered by AI in addition to easily understood explanations.
Why machine learning falls short in cloud-native environments
Machine learning algorithms excel at using supplied data to derive connections. However, ML-enabled AIOps tools tend to fall short in cloud-native environments. Three characteristics contribute to this challenge:
- Building machine learning models takes time. Building robust machine learning models can take weeks or months. In turn, this reduces their efficacy in cloud environments.
- Machine learning lags in dynamic environments. The continually changing nature of cloud environments makes it difficult for machine learning tools to keep pace.
- Human operators must still determine root causes. Machine learning tools deliver a set of correlated alerts. Therefore, human operators are still required to discover and remediate root causes.
Why deterministic AIOps is essential for DevOps — and beyond
IT operations don’t exist in a vacuum. Many organizations now combine development and operations (DevOps) with security (DevSecOps) to help streamline the process of solution development without compromising security. To cope with these changing conditions, deterministic AIOps is essential. Common use cases include the following:
- Improved automation. Deterministic AIOps solutions’ ability to ingest and analyze data in real time with the right context makes it possible to automate key operations across DevOps, SecOps, and CloudOps pipelines, reducing time to deployment and improving innovation.
- Increased shift-left capabilities. Increased automation allows AIOps to shift left along the development and deployment pipeline by providing a simple and reliable way for users to track down and remediate issues, freeing up more time for IT teams to tackle new business initiatives.
- Enhanced visibility. Advanced AIOps tools also provide enhanced visibility with improved infrastructure monitoring and the ability to visualize problem resolution step by step, making it possible for teams to pinpoint potential problems even as they address root causes.
Make your business stronger with AI
Machine learning sets the stage, but AI puts on the show. Armed with deterministic AIOps platforms, businesses can streamline problem resolution, boost the speed of DevOps efforts, and frees engineers to focus on what really matters.
Keep reading
 ReportThe pulse of Agentic AI in 2026
 GuideAI observability 101 - Delivering AI performance and ROI
 Davis® AIHow Dynatrace AI Works
See how precise answers ensure software works perfectly.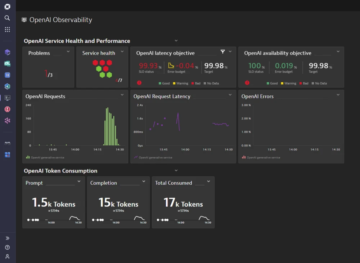 BLOG POSTMonitoring OpenAI ChatGPT
Learn how Dynatrace automatically collects OpenAI/GPT model requests and charts them within Dynatrace.


