
Network monitoring
Monitor process-specific network performance metrics like requests and retransmissions to proactively identify connection issues.
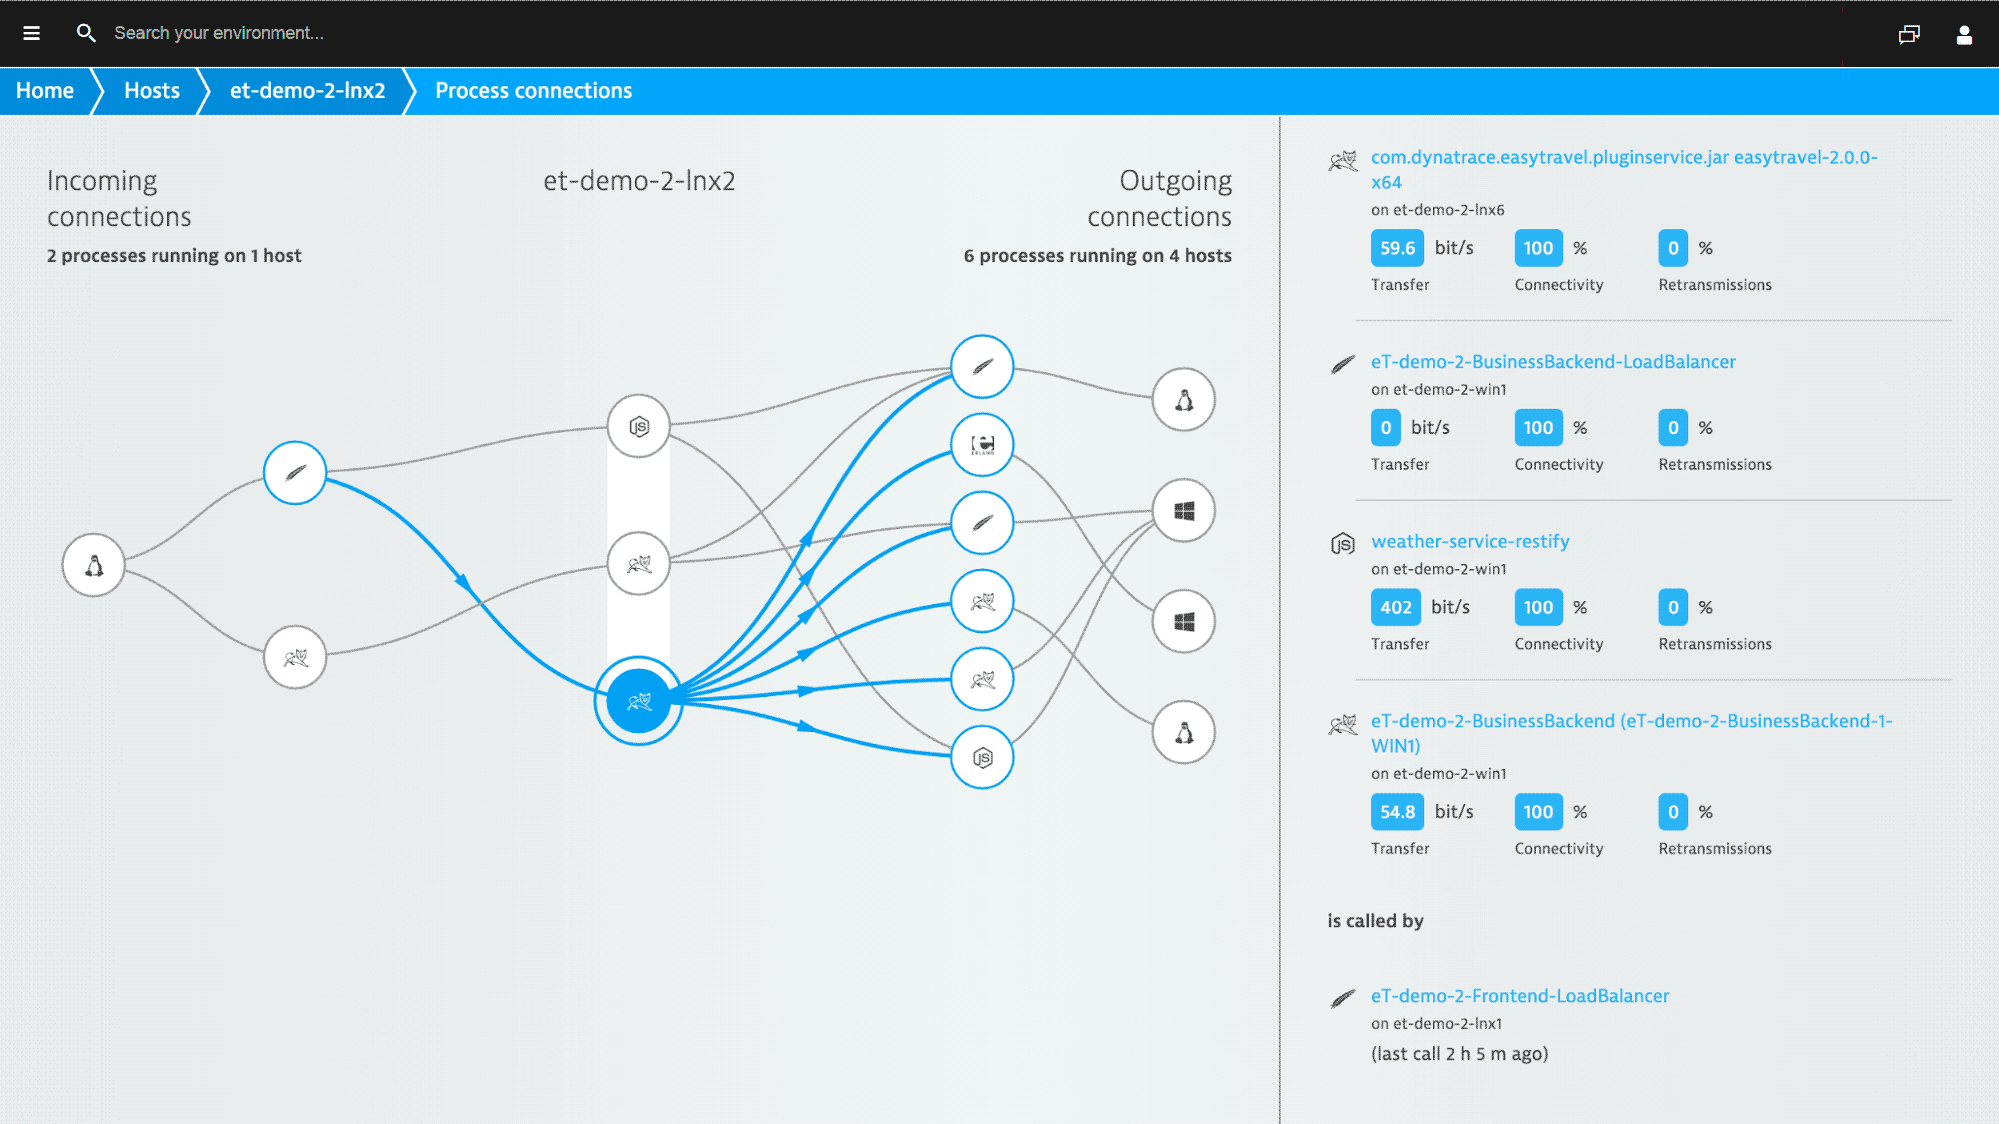
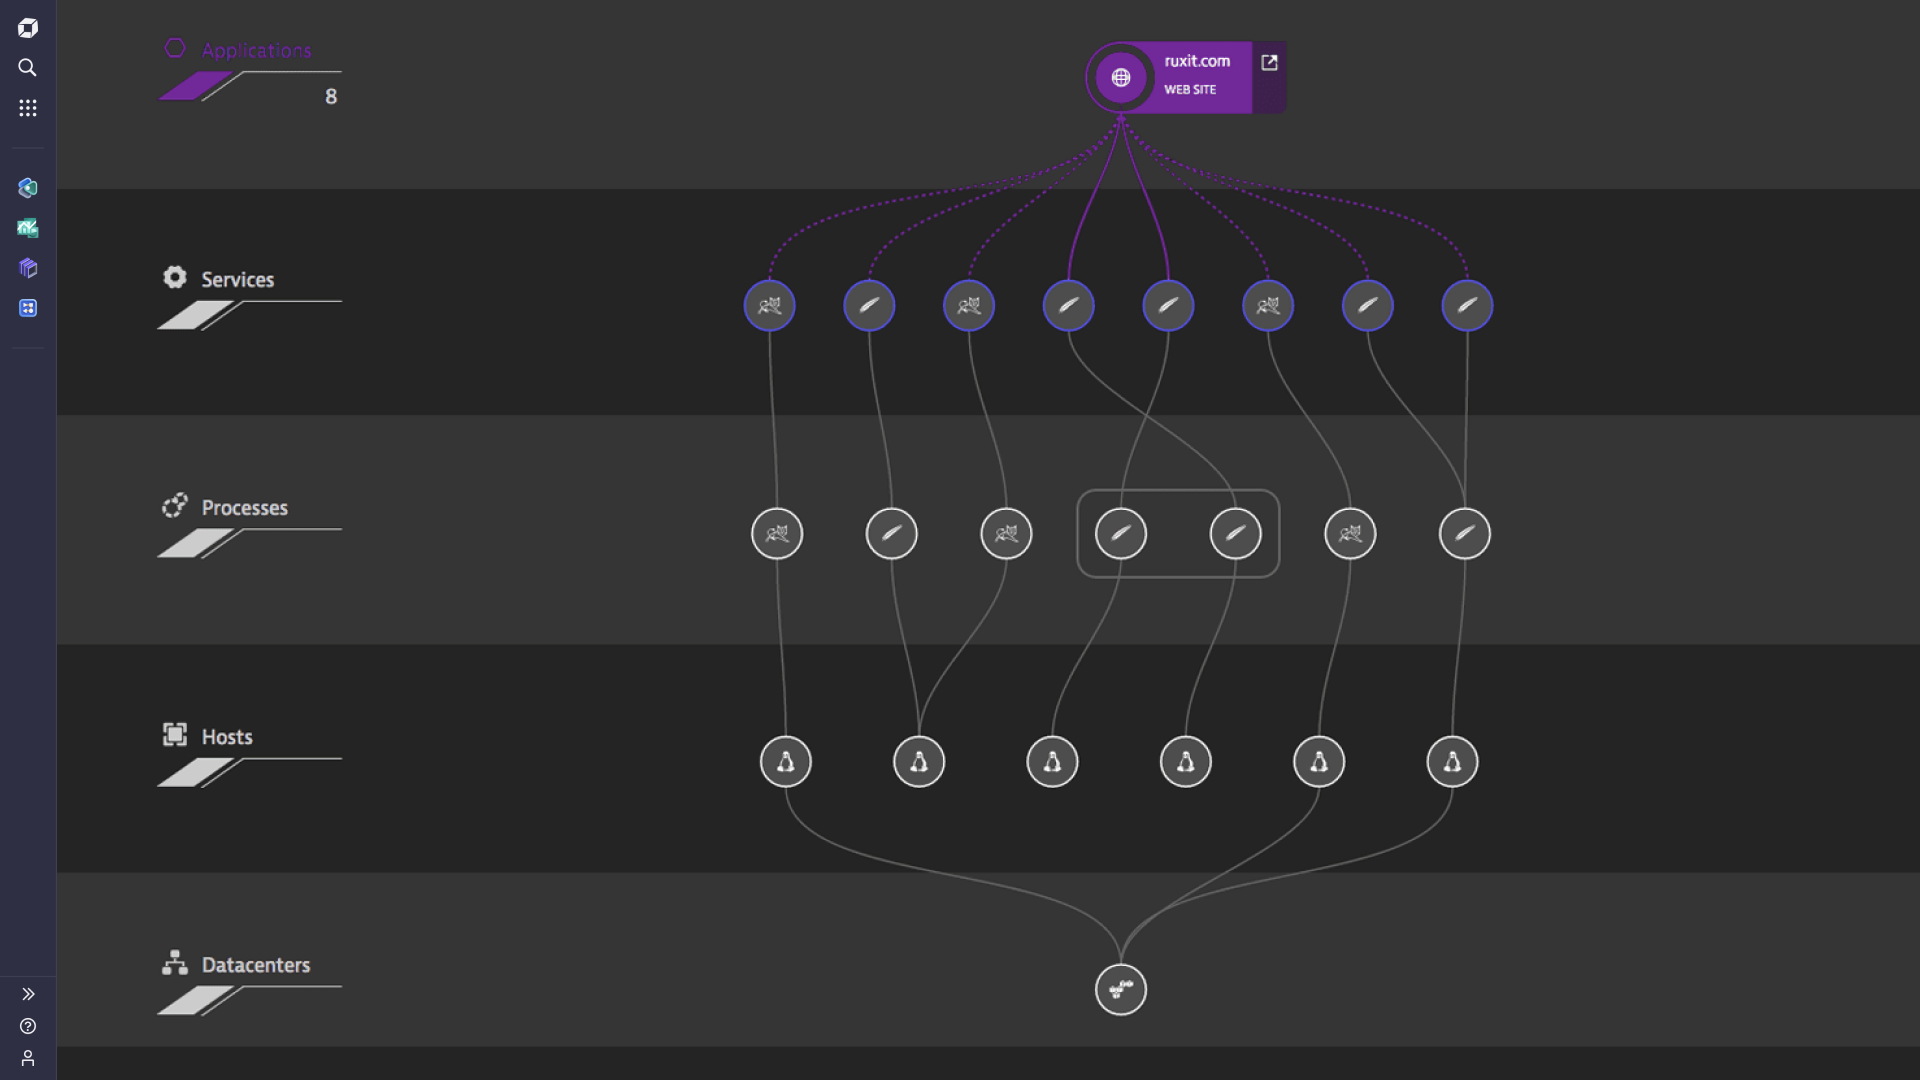
Only Dynatrace monitors process-to-process network communications
Monitoring network communications at the host level is no longer enough. That worked fine back when individual services ran on stand-alone machines. For any meaningful analysis today, you need to dig deeper and get network metrics at the process level.
But we don't stop there—only Dynatrace can go the extra mile and give you detailed metrics about process-to-process communications.
Ensure high-quality process communications over networks
Dynatrace reveals the quality and performance of all network connections between processes in your environment—including processes distributed across virtualized cloud environments and datacenters.
Know which of your services and processes suffer from network connection problems and enable your DevOps to improve the connections between vital infrastructure components.
Dynatrace provides a clear picture of all inbound and outbound process connections over your network interfaces (both physical and virtual).
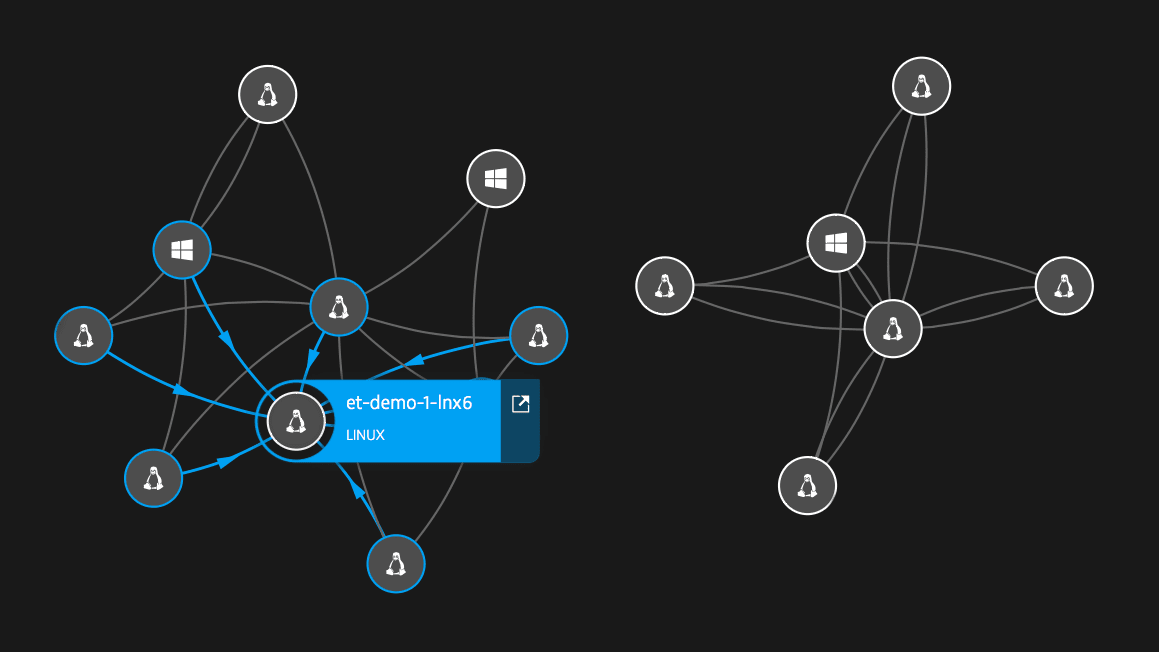
Understand your network topology in dynamic environments
Dynatrace gives you a comprehensive overview of your virtualized network infrastructure.
You always know the status of your VMs, ESXi hosts, and cloud instances.
Dynatrace recognizes changes within your infrastructure, and automatically monitors new machines and network interfaces.
Dynatrace is a G2 Leader in Network Monitoring


Why CloudOps teams should prioritize network performance monitoring
For cloud operations teams, network performance monitoring is a central task in ensuring application and infrastructure performance. If the network is sluggish, an application may also be slow, frustrating users. Worse, a malicious attacker may gain access to the network, compromising sensitive application data.
For these reasons, network activity becomes a key data source in IT observability. Teams need visibility into all dependencies and end-to-end traces for each and every session, including cloud and enterprise network traffic, to proactively identify risks to performance and security.
In this network performance monitoring handbook, readers will learn what effective network performance monitoring requires and how to achieve end-to-end visibility into multicloud and hybrid cloud environments.
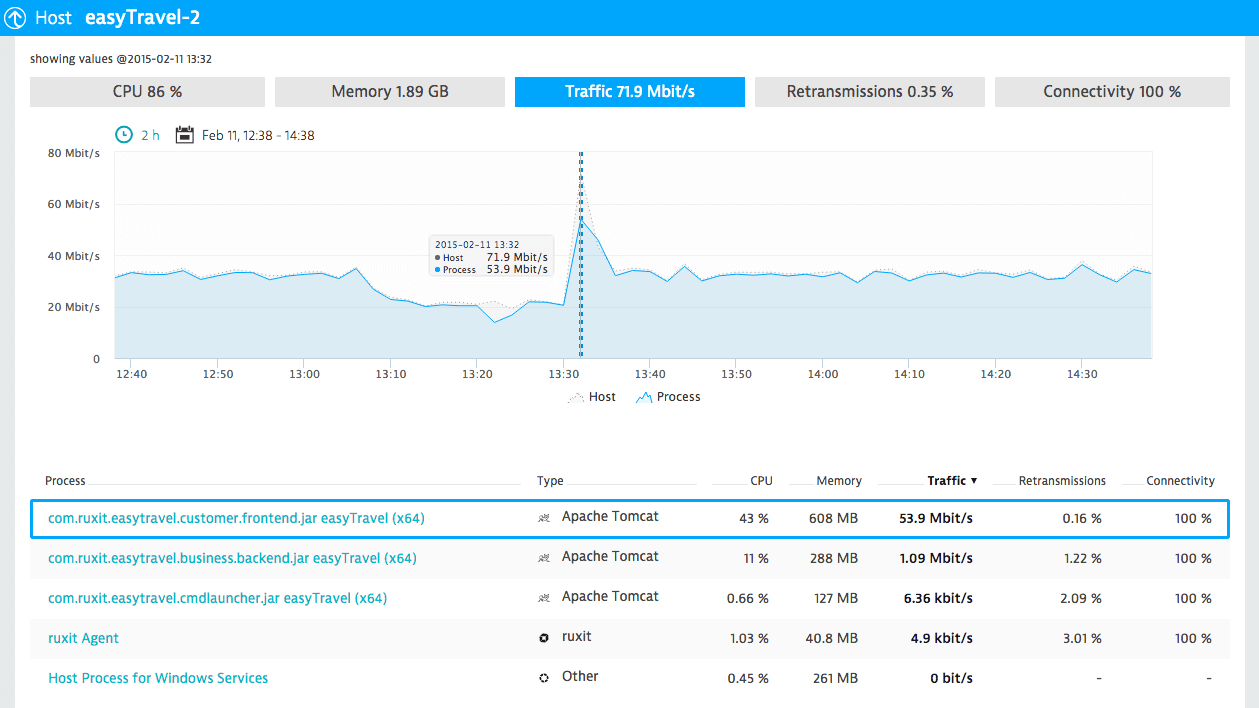
Process-level network capacity monitoring made easy
Dynatrace monitors your network traffic on both the host and process level. See which processes consume the most network bandwidth and have connection problems.
Gain insights for capacity planning. Resource-intensive processes are easily identified.
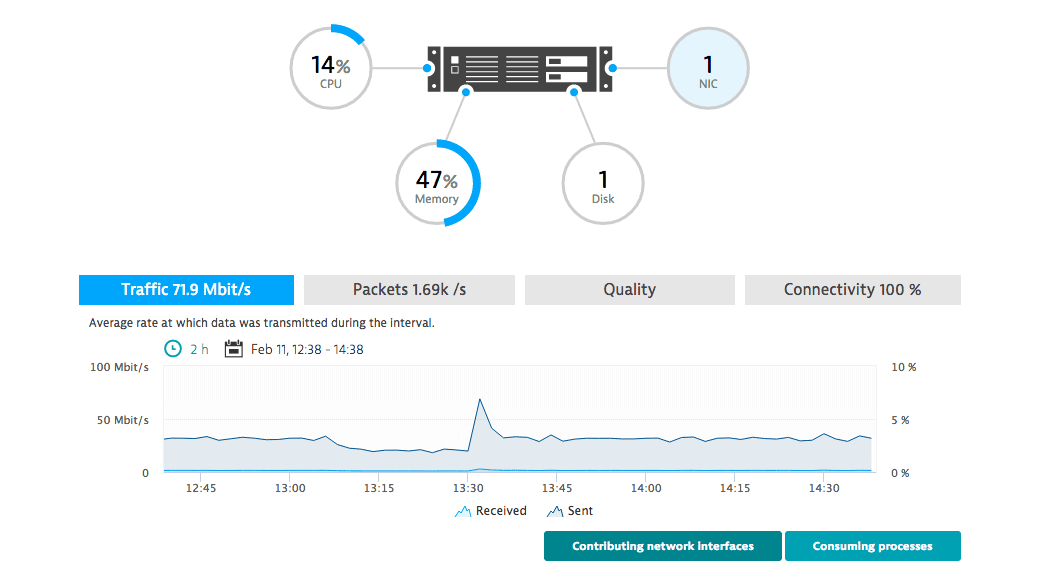
See integrated network health monitoring
Dynatrace shows you integrated network health metrics along with all other key machine resource metrics.
You see actual data throughput and quality of network connections between communicating hosts and processes.
Gain a clear picture of the metrics that really matter: CPU, memory, disk, and network health. All key machine resource metrics are displayed in a single view.
Get full-stack monitoring with a single tool
Dynatrace’s all-in-one approach seamlessly integrates all kinds of monitoring, from user-experience and application monitoring to server and network monitoring.
You see the impact and dependencies of issues across tiers and along your entire stack within a single network monitoring tool.
With a real-time map Dynatrace tells you how your components effectively interact with each other and how end-users are impacted by infrastructure problems.
Start your 15 day free Dynatrace trial today!
You’ll be up and running in under 5 minutes:
Sign up, deploy our agent and get unmatched insights out-of-the-box.


