
Trazas distribuidas
end-to-end a escala
Obtén una visibilidad sin precedentes de los sistemas distribuidos mediante la captura y el análisis de datos de trazas distribuidas, desde el cloud-native hasta las cargas de trabajo on-premise.


Transforma los datos de trazas en potentes fuentes de información
Optimiza el rendimiento de las aplicaciones con visibilidad del stack completo
- Entiende todo el contexto al vincular los detalles de trazas, métricas, logs y seguridad con los datos reales de la experiencia del usuario
- Descubre instancias dinámicas de forma automática con soporte para ecosistemas serverless y en contenedores
- Comprende las relaciones y dependencias topológicas de todos los ecosistemas (cloud, on-prem, híbrido)
- Que nada se te escape con un ecosistema abierto y extensible que integra datos adicionales provenientes de fuentes como OpenTelemetry o Prometheus, entre muchas otras
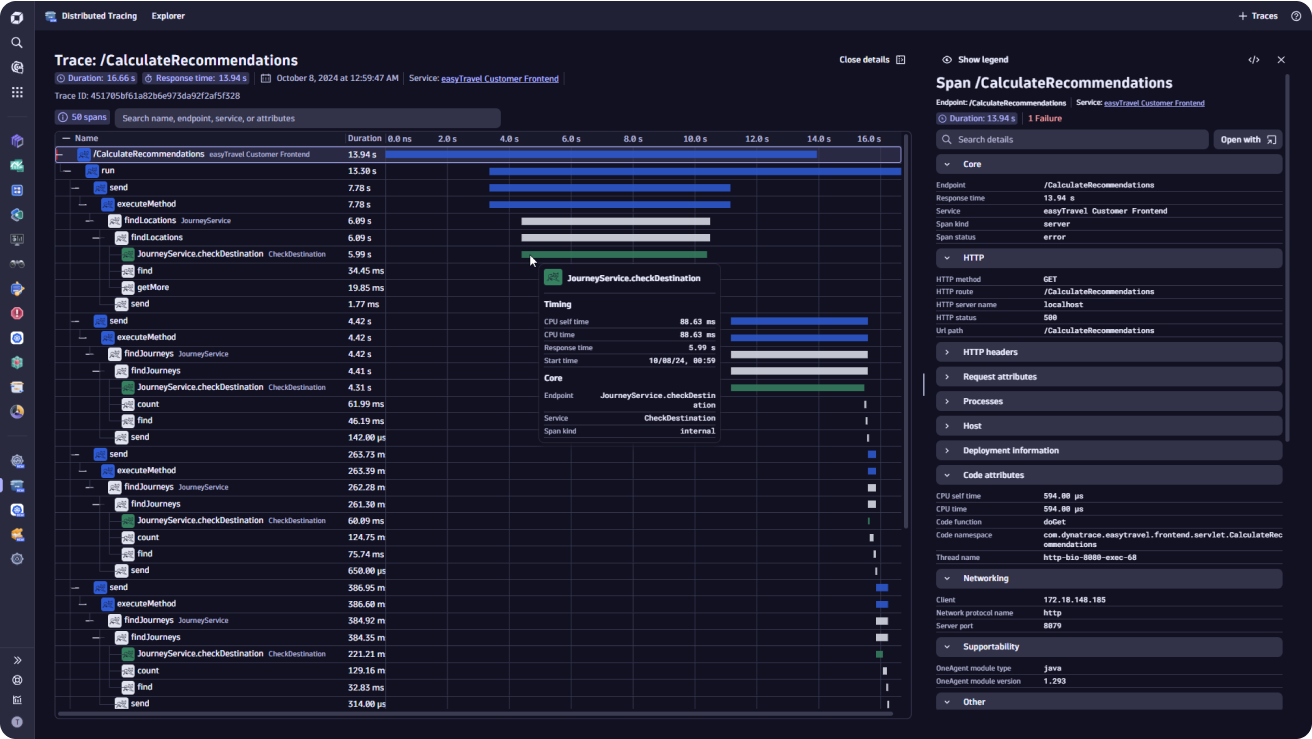
Resuelve problemas con un análisis pormenorizado
- Analiza dinámicamente los fallos y los valores atípicos mediante consultas a petabytes de datos de trazas en tiempo real
- Enriquece los datos de trazas con logs, errores y metadatos, incluidos los atributos de OpenTelemetry, con hasta 10 años de almacenamiento
- Pon los detalles de excepción en el contexto de la traza completa para encontrar la aguja en el pajar
- Agrupa y filtra trazas sin esfuerzo, y sin código ni cambios en el despliegue, con atributos de Kubernetes automáticamente en contexto
Con la asistencia de IA Davis, resuelve más rápido los problemas de errores y rendimiento
- Mejora el estado de las aplicaciones entendiendo qué ha fallado y determinando la causa raíz de forma automática
- Reduce el ruido con parámetros de referencia automáticos para detectar problemas en caso de errores y lentitud
- Toma medidas proactivas para prevenir futuros problemas con el análisis exploratorio y la IA predictiva para analizar los datos de trazas
- Prioriza las resoluciones de problemas con métricas que impactan en el negocio
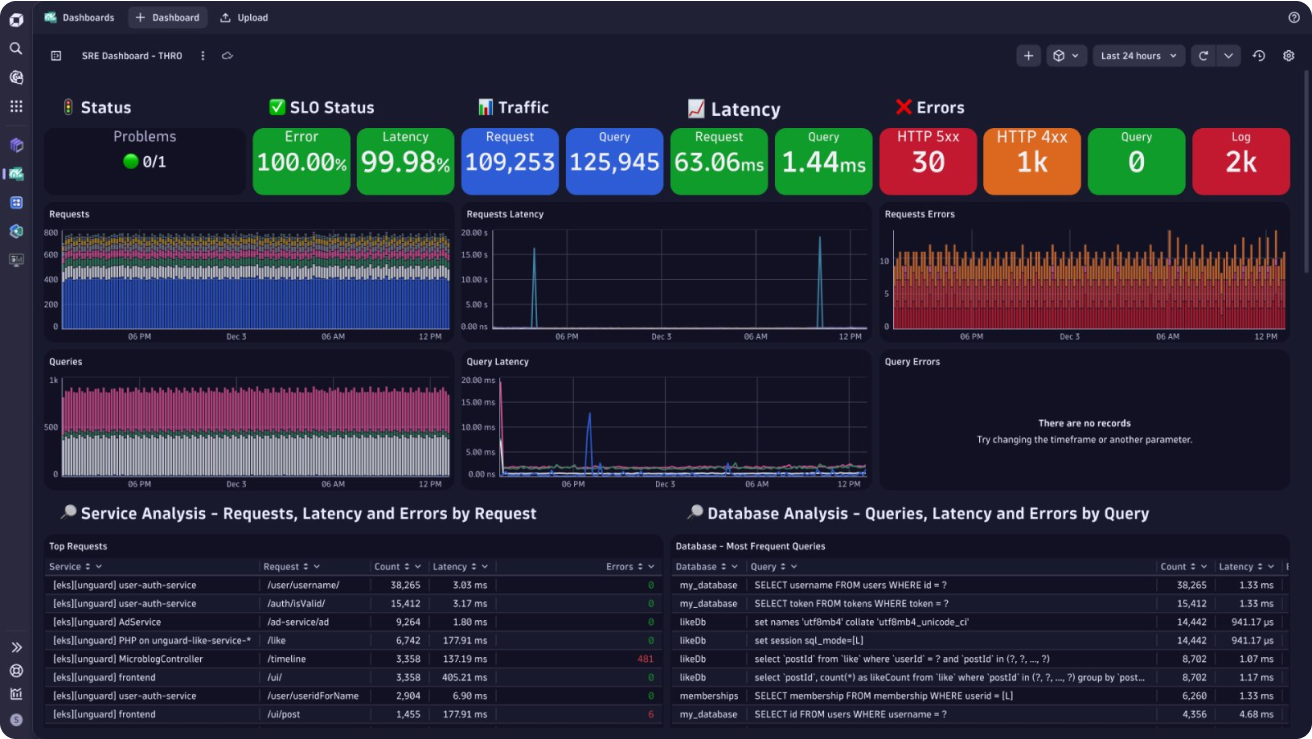
Descubre incógnitas desconocidas más rápido
- Combina todas las señales de observabilidad (trazas, logs, métricas y datos de topología) para crear dashboards y gráficos especializados
- Maximiza el rendimiento de las aplicaciones con identificación instantánea de los valores atípicos en el rendimiento
- Ejecuta flujos de trabajo automatizados en función de los datos de trazas con AutomationEngine de Dynatrace
- Disminuye la curva de aprendizaje para analizar datos de trazas utilizando el diccionario semántico estandarizado para OpenTelemetry
Así hacemos las trazas distribuidas
-
OpenTelemetry
Ingiere los datos de OpenTelemetry, ánclalos en un panel y haz el análisis junto con las métricas, los logs y el diagnóstico. Utiliza un diccionario semántico para lograr una incorporación sencilla y aplicaciones sólidas.
-
Grail
La tecnología Grail® patentada de Dynatrace es un lakehouse de datos causal que proporciona respuestas precisas con rapidez y a escala en una plataforma de inteligencia unificada.
-
OneAgent
Obtén trazas distribuidas, análisis y respuestas prácticas end-to-end y a escala, con soporte para OneAgent® sin necesidad de configuración extra.
Profundiza en los detalles
Recursos de trazas distribuidas
 BlogInformación de trazas sin esfuerzo: una nueva experiencia para trazas distribuidas
Con Dynatrace, descubre de manera sencilla las trazas distribuidas: filtrado intuitivo, visualización y análisis para una resolución más rápida de los problemas. Performance ClinicTrazas distribuidas con Dynatrace
Descubre cómo Dynatrace realiza automáticamente trazas de las transacciones en entornos dinámicos del cloud. BLOGDynatrace y la observabilidad de OpenTelemetry brindan respuestas prácticas a escala
Potencia los datos de OpenTelemetry con Dynatrace


Obtén una prueba gratuita
¿Quieres ver lo que la observabilidad inteligente e impulsada por IA y la automatización pueden hacer por ti? Disfruta ahora de una prueba gratuita la plataforma de Dynatrace.