
Database access is a core feature of most applications. Based on our experience, it seems that for at least 80% of all applications we see, simple database performance tuning can speed up applications significantly.
Fortunately, there isn’t a lot of rocket science involved until you get really deep under the hood of database tuning. When you’re ready to take database tuning to the next level, there are many great tools around for you to consider, for example from our friends at Vivid Cortex. For this post, however, we will only focus on quick wins that you can easily achieve without any help from third parties.
Is your database server healthy?
First and foremost, make sure that the host that’s serving your database process has sufficient resources available. This includes CPU, memory, and disk space.
CPU
CPU will most likely not be a bottleneck, but database servers induce continuous base load on machines. To keep the host responsive, make sure that it has at the very least two CPU cores available.
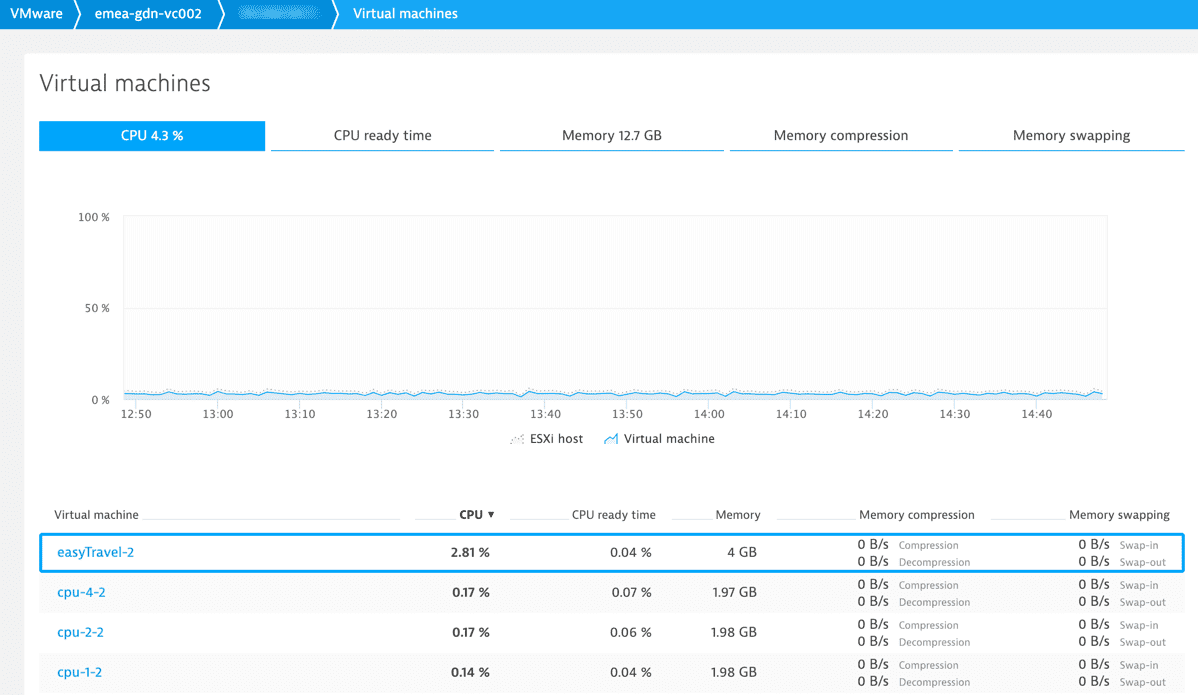
I will assume that at least some of your hosts are virtualized. As a general rule of thumb, when monitoring virtual machines, also monitor the virtual host that the machines run on. CPU metrics of individual virtual machines won’t show you the full picture. Numbers like CPU ready time are of particular importance, as they tell you, how much CPU time the virtual machines are really able to utilize.
Besides the technical implications, the number of CPUs also impacts licensing. You might want to ensure that your database server license closely matches your CPU count. Otherwise, you might be overspending or not be able to fully leverage on your hardware.
Memory
Keep in mind that memory usage is not the only metric to keep an eye on. Memory usage does not tell you how much additional memory may be needed. The important number to look at is page faults per seconds.
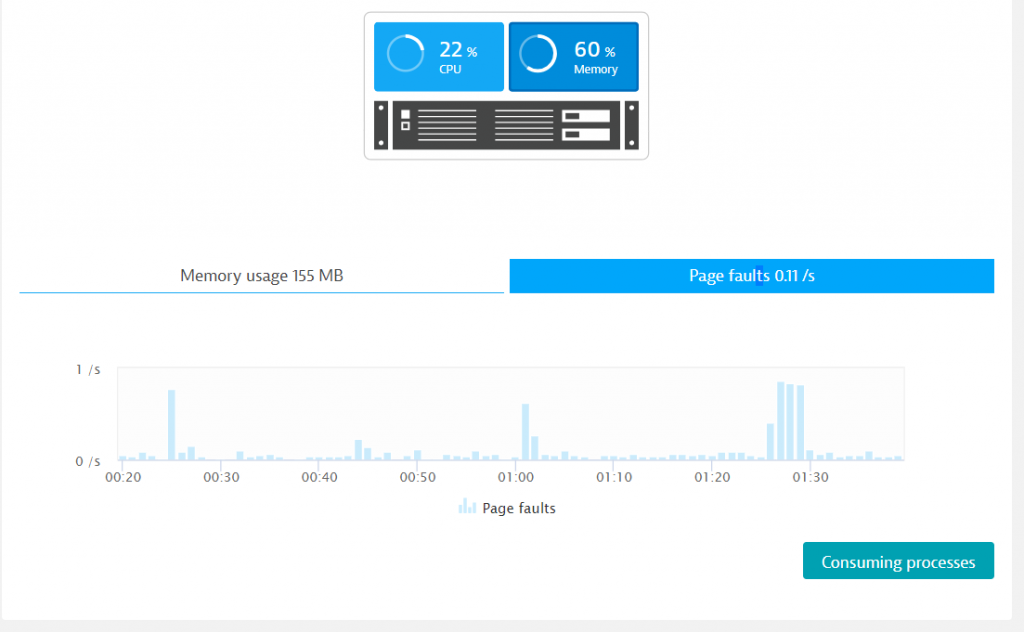
Having thousands of page faults per second indicates that your hosts are out of memory (this is when you start to hear your server’s hard drive grinding away).
Disk space
Because of indices and other performance improvements, databases use up a LOT more disk space than what the actual data itself requires (indices, you know). NoSQL databases in particular (Cassandra and MongoDB for instance) eat up a lot more disk space than you would expect. And while MongoDB might take up less RAM than a common SQL database, it’s a real disk space hog.
I can’t emphasize this too much: make sure you have lots of storage available for your database server. Also, make sure your database runs on dedicated hard drives, as this should keep disk fragmentation caused by other processes to a minimum.
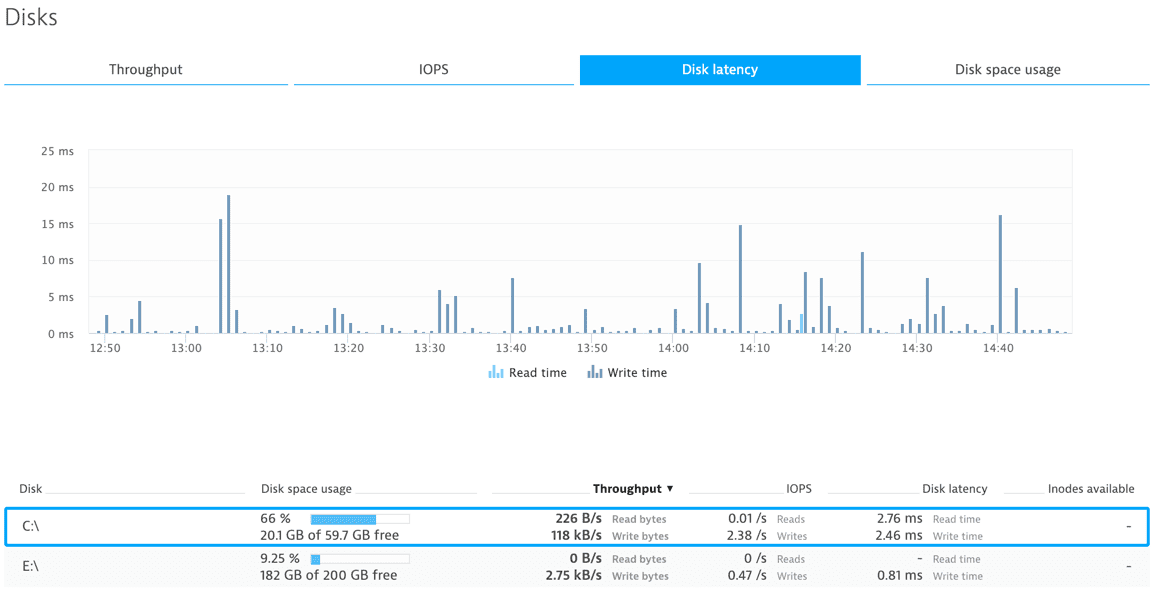
One number to keep an eye on is disk latency. Depending on hard drive load, disk latency will increase, leading to a decrease in database performance. What can you do about this? Firstly, try to leverage your application’s and database’s caching mechanisms as much as possible. There is no quicker and more cost-effective way of moving the needle.
If that still does not yield the expected performance, you can always add additional hard drives. Read performance can be multiplied by simply mirroring your hard drives. Write performance really benefits from using RAID 1 or RAID 10 instead of, let’s say, RAID 6. If you want to get your hands dirty on this subject, read up on disk latency and I/O issues.
If that still doesn’t help, give Solid State Drives a try. Make sure you pick a model that’s designed for database usage, as databases will apply more read/write cycles to storage than most common applications. Despite decreasing prices, they still come at a higher price than traditional hard disks. But if you need a boost in performance, they are worth the price.
Who is accessing the database?
Once your database is residing on healthy hardware you should take a look at which applications are actually accessing the database. If one of your applications or services suffers from bad database performance, do not jump to the conclusion that you know which application or service is responsible for the bad performance.
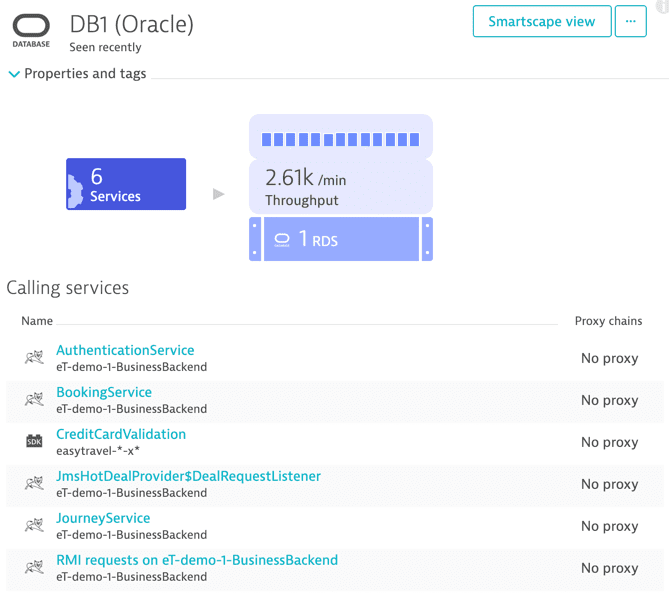
When talking about inferior database performance, you’re really talking about two different things. On one hand, the database as a whole may be affected. On the other hand, there may be just a single client that’s experiencing bad performance.
If all of the database’s clients experience bad performance, go back and check if your host is truly healthy. Chances are that your hardware is not up to the challenge. If there is only one service suffering from bad database response times, dig deeper into that service’s metrics to find out what’s causing the problem.
Understand the load and individual response time of each service instance
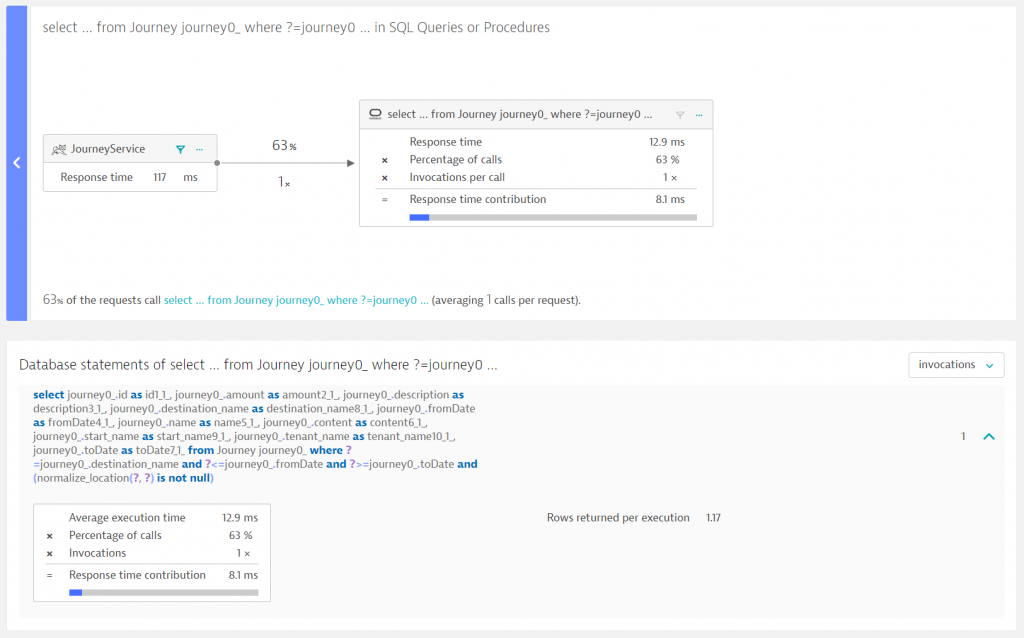
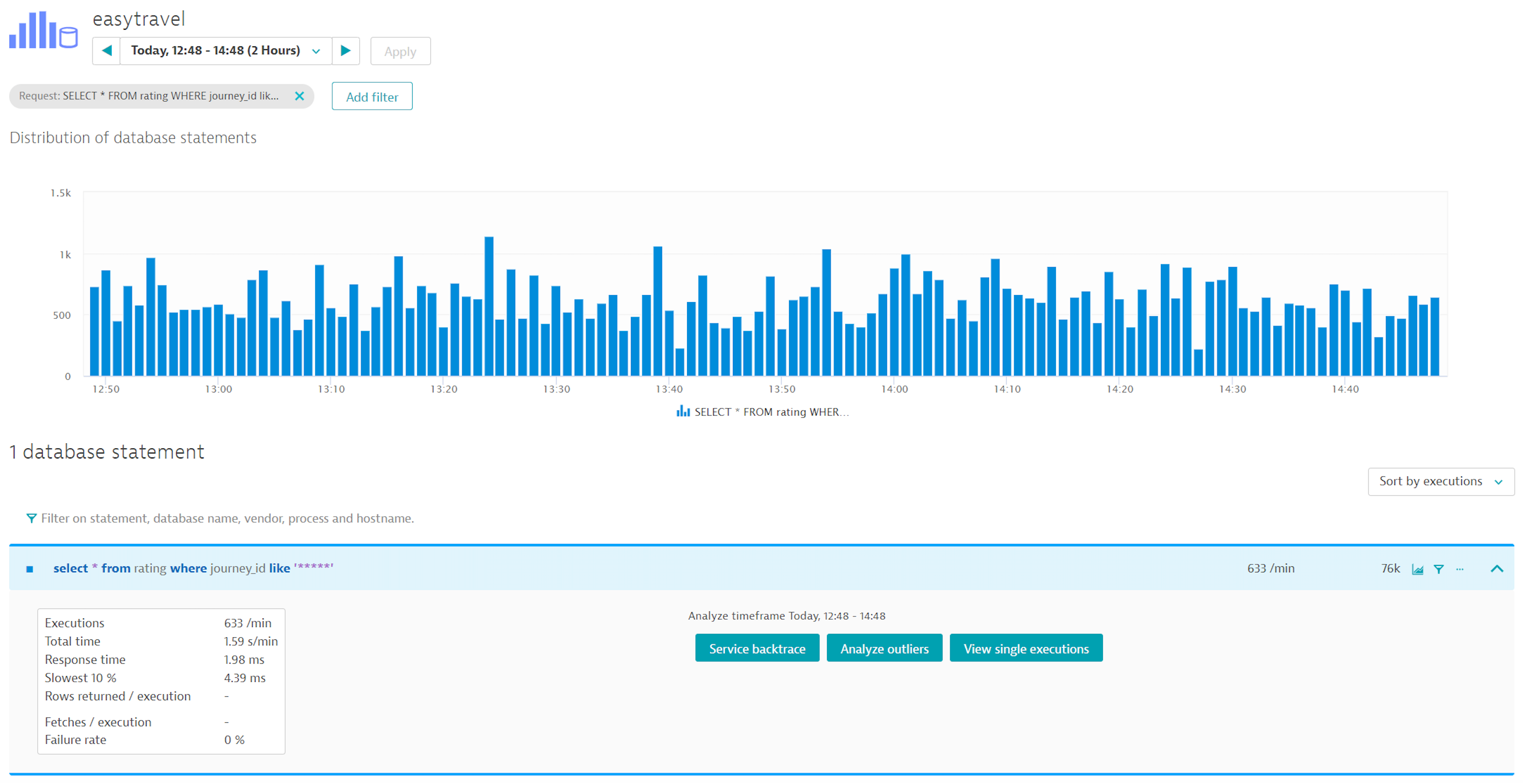
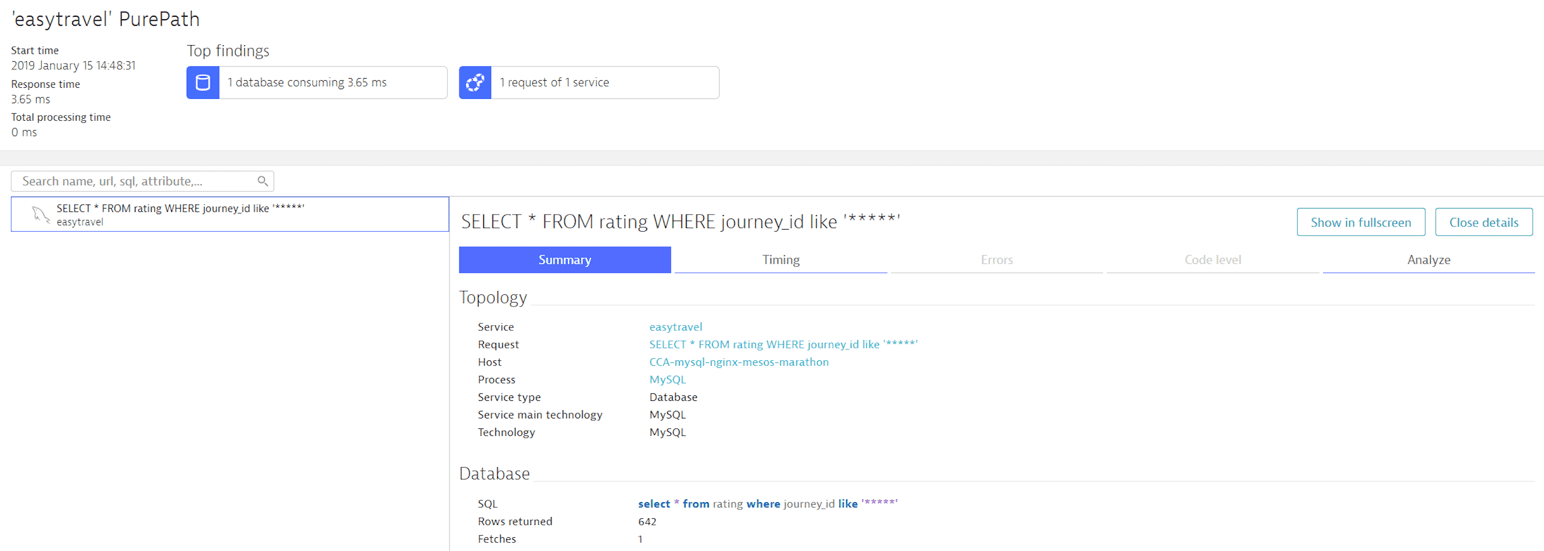
If an individual service is having bad database performance, you should take a deeper look into the service’s communication with the database. Which queries are executed? How often are the queries executed per request? How many rows do they return?
Also, if you’re running multiple instances of a single service (and you really should), you should check whether all instances are affected, or just single ones.
It’s important to know that issues that materialize on the database level may be rooted elsewhere. Very often there is an issue related to the way a database is accessed.
Look at how often queries are called per request. Maybe you can reduce the number of actual database queries by improving the database cache of your service. Question everything. Is there any reason why a single query should be executed more than once per request? If there is, maybe you can unlock some potential performance by applying smart caching strategies.
Do you have enough database connections?
Even if the way you query your database is perfectly fine, you may still experience inferior database performance. If this is your situation, it’s time to check that your application’s database connection is correctly sized.
When configuring a connection pool there are two things to consider:
1) What is the maximum number of connections the database can handle?
2) What is the correct size connection pool required for your application?
Why shouldn’t you just set the connection pool size to the maximum? Because your application may not be the only client that’s connected to the database. If your application takes up all the connections, the database server won’t be able to perform as expected. However, if your application is the only client connected to the database, then go for it!
How to find out the maximum number of connections
You already confirmed in Step #1 that your database server is healthy. The maximum number of connections to the database is a function of the resources on the database. So to find the maximum number of connections, gradually increase load and the number of allowed connections to your database. While doing this, keep an eye on your database server’s metrics. Once they max out—either CPU, memory, or disk performance—you know you’ve reached the limit. If the number of available connections you reach is not enough for your application, then it’s time to consider upgrading your hardware.
Determine the correct size for your application’s connection pool
The number of allowed concurrent connections to your database is equivalent to the amount of parallel load that your application applies to the database server. There are tools available to help you in determining the correct number here.
Increasing load will lead to higher transaction response times, even if your database server is healthy. Measure the transaction response time from end-to-end to see if Connection Acquisition time takes up increasingly more time under heavy load. If it does, then you know that your connection pool is exhausted. If it doesn’t, have another look at your database server’s metrics to determine the maximum number of connections that your database can handle.
By the way, a good rule of thumb to keep in mind here is that a connection pool’s size should be constant, not variable. So set the minimum and maximum pool sizes to the same value.
Don’t forget about the network
We tend to forget about the physical constraints faced by our virtualized infrastructure. Nonetheless, there are physical constraints: cables fail and routers break. Unfortunately, the gap between works and doesn’t work usually varies. This is why you should keep an eye on your network metrics. If problems suddenly appear after months or even years of operating flawlessly, chances are that your infrastructure is suffering from a non-virtual, physical problem. Check your routers, check your cables, and check your network interfaces. It’s best to do this as early as possible following the first sign that there may be a problem because this may be the point in time when you can fix a problem before it impacts your business.
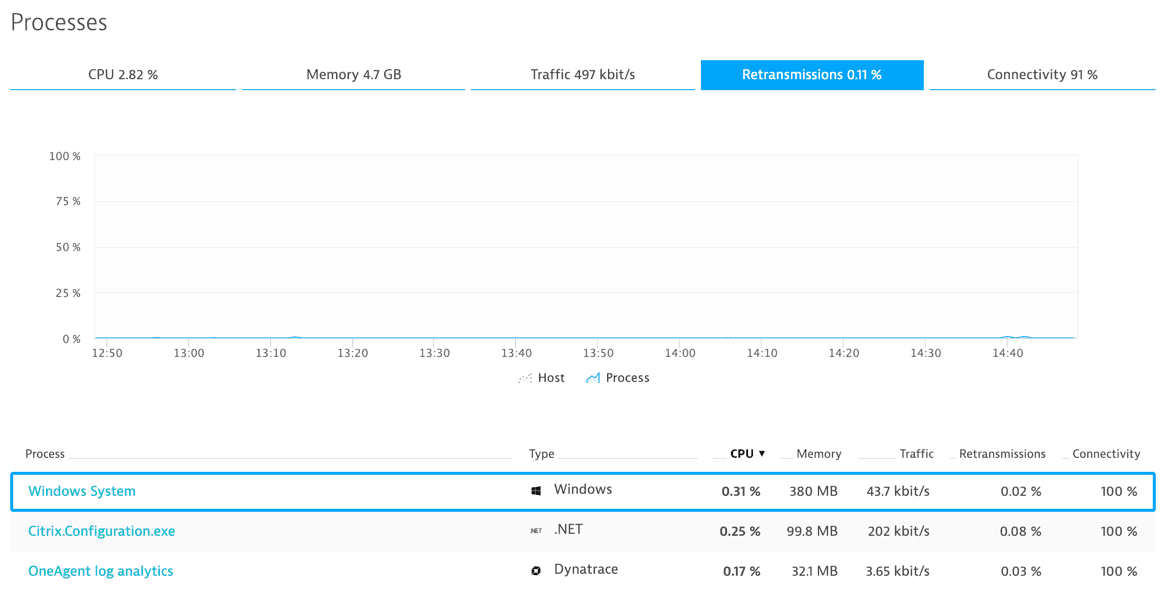
Very often, over-stressed processes start to drop packets due to depleted resources. Just in case your network issue is not a hardware problem, process level visibility can definitely come in handy in identifying a failing component.
Database performance wrap up
Databases are sophisticated applications that are not built for bad performance or failure. Make sure your databases are securely hosted and resourced so that they can perform at their best.
Here’s what you’ll need to optimize your database:
- Server data to check host health
- Hypervisor and virtual machine metrics to ensure that your virtualization is okay
- Application data to optimize database access
- Network data to analyze the network impact of database communication.
Many tools can provide you with this information. I used Dynatrace for my examples here because it provides all the data I need in a single tool. Though, obviously, I am a bit biased.
Give it a try!
Dynatrace is free to use for 15 days! The trial stops automatically, no credit card is required. Enter your email address, choose your cloud location and install our agent.
Monitoring your database performance was never easier!


Looking for answers?
Start a new discussion or ask for help in our Q&A forum.
Go to forum