
Detecting errors like dropped packets or retransmissions on the network level is relatively easy. Figuring out if those errors affect the performance and connectivity of your services is however another matter. Some network errors are mitigated and compensated for by network protocols and active networking components, like network interfaces. Meanwhile, other network errors lead to performance problems that negatively affect your services.
Following is an overview of common network errors and root causes, means and approaches of detecting such errors, and suggestions as to how monitoring tools can support you in staying on top of your services’ connectivity and performance.
TCP – Your protocol of choice since 1981
The TCP/IP protocol suite that we all know so well has been around for almost 40 years now. Although some alternatives have been developed over the years, TCP/IP still works well and it’s the foundation of almost all networking as we know it today. One of the reasons this protocol stack is still around is that it’s capable of compensating for many errors on its own. TCP, appropriate to the season, is the Santa Claus of protocols. It knows if your service is sleeping, it knows if it’s awake, it knows if the connections run bad or good, so [listen closely to what it says]. Your services need not worry about retransmissions or network congestion. TCP/IP does everything in its power to makes sure that your stateful connections are reliable and perform well. Nevertheless anybody running applications in production needs to understand TCP and its basics.
The top five common network errors
Network collisions
This is an oldie, but a goodie that’s now almost irrelevant because of full duplex switches and technology advances. Back in the days if two devices on the same Ethernet network (e.g., connected through a hub) tried to transmit data at the same time, the network would detect the collision and drop both packets. The CSMA/CD protocol, which made sure that nobody else was transmitting data before a device started transmitting its own data, was a step in the right direction. With full duplex switches, where communication end-points can talk to each other at the same time, this potential error is obsolete. Even in wireless networks, which still work basically like hubs, network collisions can be neglected because there are procedures in place to avoid collisions in the first place (e.g., CSMA/CA or RTS/CTS).
Checksum errors
When you download files from the Internet you often have the option of checking a file’s integrity with a MD5 or SHA-1 hash. With the help of checksums on the network level we are able to detect if a bit was toggled, missing, or duplicated by network data transmission. Checksums assure that received data is identical to the transmitted data.
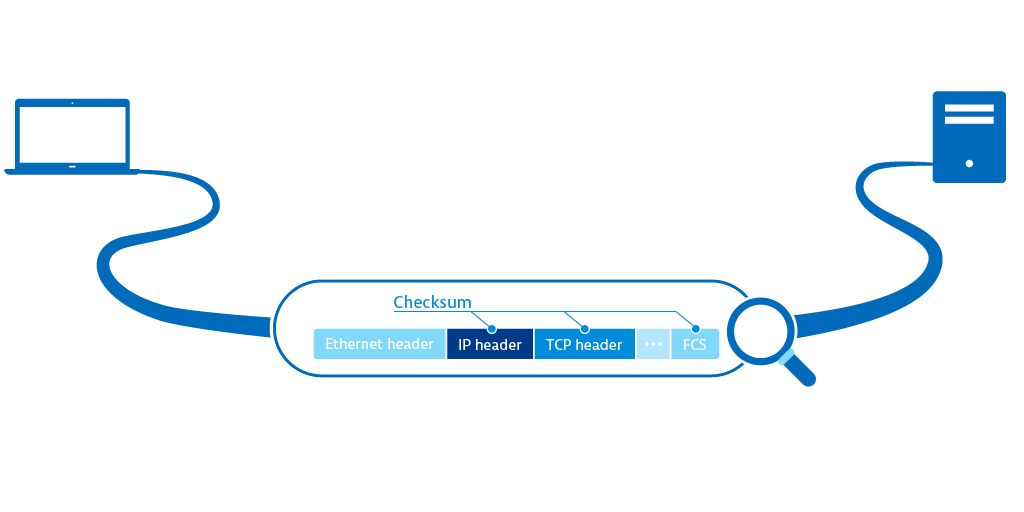
Packets with incorrect checksums aren’t processed by the receiving host. If the Ethernet checksum (CRC) is wrong the Ethernet frame is silently dropped by the network interface and is never seen by the operating system, not even with packet capturing tools. With the IP checksum and TCP checksum in the respective headers there are two additional supervisory bodies that can detect integrity errors. Be aware that despite the efforts of checksumming, there are some errors that can’t be detected.
Full queues
If the processing queue on a switch or router is overloaded, the incoming packets will be dropped. Also if the queue for incoming packets on the host you try to connect to is full, the packets will also be dropped. This behavior is actively exploited during DoS/DDoS attacks. So while it’s actually a good thing that a host only accepts the number of packets than it can process, this behavior can be used to take down your service.
Time to live exceeded
The Time to live (TTL) field in the IPv4 header has a misleading name. Every router that forwards an IP packet decreases the value of the field by one — it actually has nothing to do with time at all. In the IPv6 header this field is called “hop limit”. If the TTL value hits 0, an ICMP message “time to live exceeded” is sent to the dispatcher of the packet. Meanwhile, some network components drop packets with TTL equal to zero silently. This mechanism is useful for preventing packets from becoming caught up in an endless routing loop within your network. The observant reader and network veteran is familiar with this technique because traceroute uses it to identify all hops that a packet makes on its route to its destination.
Packet retransmissions
First off, retransmissions are essential for assuring reliable end-to-end communication in networks. Retransmissions are a sure sign that the self-healing powers of the TCP protocol are working — they are the symptom of a problem, not a problem in themselves. Common reasons for retransmissions include network congestion where packets are dropped (either a TCP segment is lost on its way to the destination, or the associated ACK is lost on the way back to the sender), tight router QoS rules that give preferential treatment to certain protocols, and TCP segments that arrive out of order at their destination, usually because the order of segments became mixed up on the way from sender to destination. The retransmission rate of traffic from and to the internet should not exceed 2%. If the rate is higher, the user experience of your service may be affected.
The three commands you need to know to gather information about network errors
Now we know about common errors – let’s take a look at network troubleshooting. The good news is that most of the problems are findable using standard tools that are usually part of your operating system.
ifconfig
The first place to go to find basic information about your network interfaces is good old ifconfig.
ifconfig shows details about the specified network interfaceBesides the MAC address and the IP address information for v4 and v6 you’ll find detailed statistics about received and transmitted packets. The line that starts with RX contains information about received packets. The TX lines contain information about transmitted packets.
RX information

- packets shows the number of successfully received packets.
- errors can result from faulty network cables, faulty hardware (e.g., NICs, switch ports), CRC errors, or a speed or duplex mismatch between computer and switch, which would also manifest itself in a high number of collisions (CSMA/CD sends its regards). You can check the configuration on your computer using
ethtool <device>to find out at which speed your network interface is operating and if the connection is full duplex or not. - dropped can indicate that your system can’t process incoming packets or send outgoing packets fast enough, you’re receiving or sending packets with bad VLAN tags, you’re using unknown protocols, or you’re receiving IPv6 packets and your computer doesn’t support IPv6. You can counter the first error by increasing the ring-buffer. This is the buffer that the NIC transfers frames to before raising an IRQ in the kernel, for RX of your network interface using
ethtool. - overruns display the number of fifo overruns, which indicates that the kernel can’t keep up with the speed of the ring-buffer being emptied.
- frame counts the number of received misaligned Ethernet frames.
TX information

- packets shows the number of successfully transmitted packets.
- errors shows the number of errors that occurred while transmitting packets due to carrier errors (duplex mismatch, faulty cable), fifo errors, heartbeat errors, and window errors.
- dropped indicates network congestion, e.g., the queue on the switchport your computer is connected to is full and packets are dropped because it can’t transmit data fast enough.
- overruns indicates that the ring-buffer of the network interface is full and the network interface doesn’t seem to get any kernel time to send out the frames stuck in the ring-buffer. Again, increasing the TX buffer using
ethtoolmay help. - carrier shows the number of carrier errors, indicating a duplex mismatch or faulty hardware.
- collisions shows the number of collisions that occurred while transmitting packets which, in modern networks, should be zero.
- txqueuelen controls the length of the transmission buffer of the network interface. This parameter is relevant only for some queueing disciplines and can be overwritten using the
tccommand. For more information about queueing disciplines, take a look at this deep dive into Queueing in the Linux Network Stack and the tc-pfifo main page.
netstat
To see more detailed network statistics for the protocols TCP, UDP, IP, and ICMP you can use netstat -s. This returns a lot of information and the output format is in a human-readable format, like the number of retransmitted and dropped packets sorted by protocol. If you want to focus on TCP retransmissions you can filter out the relevant information.

netstat shows details about TCP retransmissionsnetstat shows that there are 54 retransmitted segments. Meaning, for 54 TCP segments the corresponding ACK was not received within the timeout. Three TCP segments were “fast retransmitted” following the fast retransmission algorithm in RFC 2581. TCP SYN retransmission can happen if you want to connect to a remote host and the port on the remote host isn’t open (see example below).
ethtool
This tool allows you to query and control the settings of the network interface and the network driver, as seen before. It shows you a detailed list of all errors that can occur on the network interface level, like CRC errors and carrier errors. If you have no retransmissions on the TCP layer but ifconfig still shows you a lot of erroneous packets, this is the place to look for the specifics. If a lot of errors show up in the ethtool output, it usually means that there is something wrong with the hardware (NIC, cable, switchport).
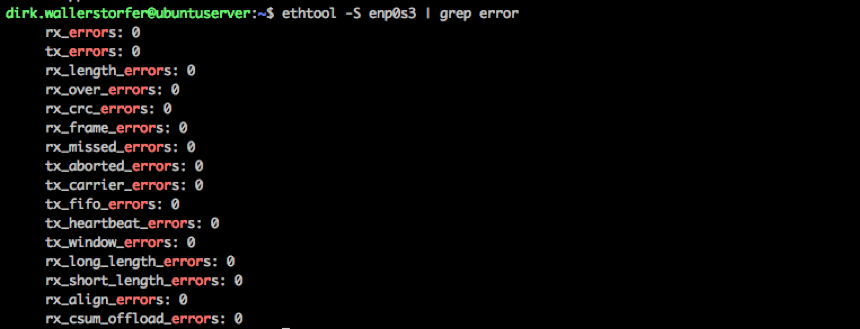
ethtool knows everything there is to know about your network interface, including errorsSome might still want to dig deeper to find out everything about those errors. The next step would be to read the Linux Device Drivers book, digest it, and then start reading through the kernel source code (e.g., linux/netdevice.h) and network driver code (e.g., Intel e1000 driver).
Three helpful tools for gathering information about network errors
tcpretrans
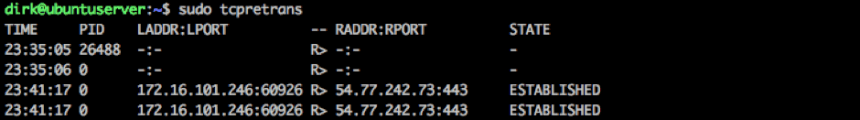
tcpretrans is part of the perf-tools package. It offers you a live ticker of retransmitted TCP segments, including source and destination address and port, and TCP state information. If you suspect that more than one application or service is responsible for TCP retransmissions, tcpretrans allows you to debug your network connections if you call your services in isolation from each other and watch the output of tcpretrans.
tcpdump
tcpdump is a command-line network analyzer that shows the traffic specified by filters directly on the command line. With a command line parameter you can write the output to a file for future analysis. tcpdump is available in almost every *nix distribution out of the box and is therefore the tool of choice for a quick pragmatic network analysis.
Wireshark
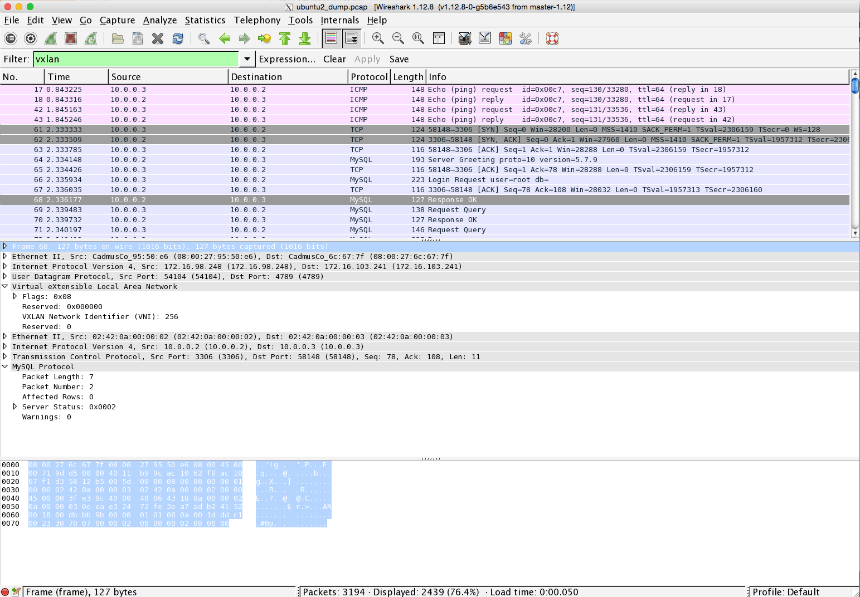
Wireshark, formerly ethereal, is the Swiss Army knife of network and protocol analyzer tools for Windows and Unix when it comes to analyzing TCP sessions, identifying failed connections, and seeing all network traffic that travels to and from your computer. You can configure it to listen on a specific network interface, specify filters to, for example, concentrate on a certain protocol, host, or port, and you can dump captured traffic to a file for an future analysis. Also, Wireshark can read tcpdump files, so you can capture traffic on one host on the command line and open the file for analysis in Wireshark on your computer for an analysis. Another feature of wireshark is that it knows a lot of common application protocols (e.g., HTTP and FTP). Thus you can see what’s going on above layer 4 and get insight into the payloads that are sent using TCP.
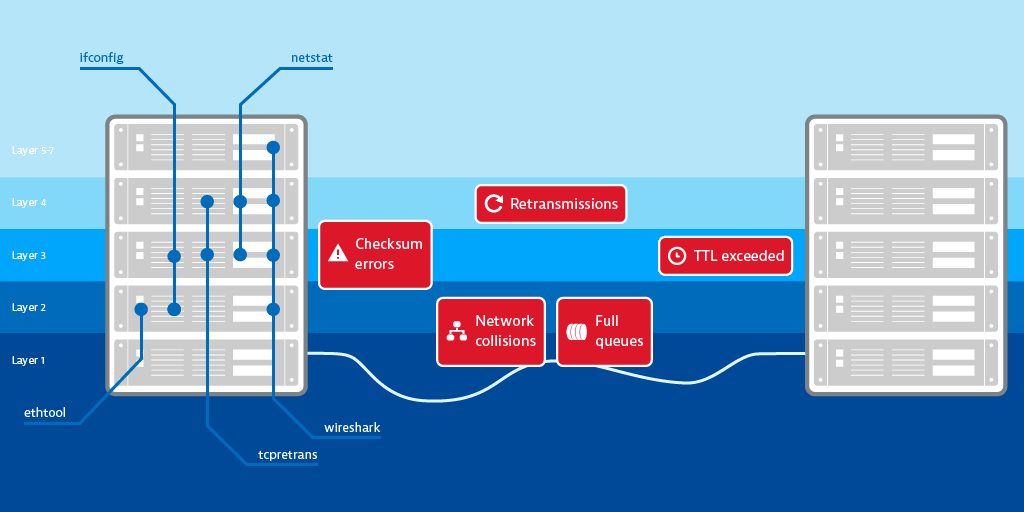
Following is an overview that shows which OSI layers the tools mentioned above cover and on which OSI layer the above-mentioned network errors occur.
Now you know how and where to find information about network errors. But what can you learn from this information? For starters, you can learn what type of errors you’re dealing with, which will guide your further investigation. Though do you really need to investigate anything at all? After all, investigating each retransmitted or dropped packet is pointless—the network protocol stack has self-healing powers and some of the alleged errors are simply part of the game.
What really counts
Usually, more than one computer, switches, and routers are involved in networking. When you have several hosts and detect a problem in your network it’s not efficient to ssh each computer and perform all these exercises to find out what’s going on. Ultimately, in more complex environments, you need tool support to stay on top of things.
You need a monitoring tool that monitors all the hosts that are part of your infrastructure — a tool that notifies you when something out of the ordinary occurs. The tool should automatically create performance baselines for all running services, as well as incoming/outgoing network traffic, average response time to service calls, and the availability of the service from the network’s point of view. You need to be notified if any of these measurements fall in comparison to the baseline.
Although network errors may be the root cause of why your services aren’t available or are performing poorly, as a service provider in the real world you shouldn’t need to focus on networking errors. Your main concern should be providing high-performance services that are easy to use and always available. In general, you don’t want to be notified about all errors that occur in the network layer (or anywhere else in the application for that matter).
There are a number of networking and service-related metrics you can measure and evaluate. The following three are a good starting point.
Network traffic
Measuring network traffic provides a good overview of the overall usage and performance of your service. It’s also a good indicator of whether or not you need to upscale your infrastructure (e.g., your one server may no longer be enough to handle all the load).
Responsiveness
Responsiveness measures the time from the last request packet that the service receives to the first response packet that the service sends. It measures the time a process needs to produce a response to a given request and should be watched in correlation with hardware resources.
Connectivity
Connectivity shows the percentage of properly established TCP connections compared to TCP connections that were refused or timed out. It shows when services were available to clients and when they were not, over time.
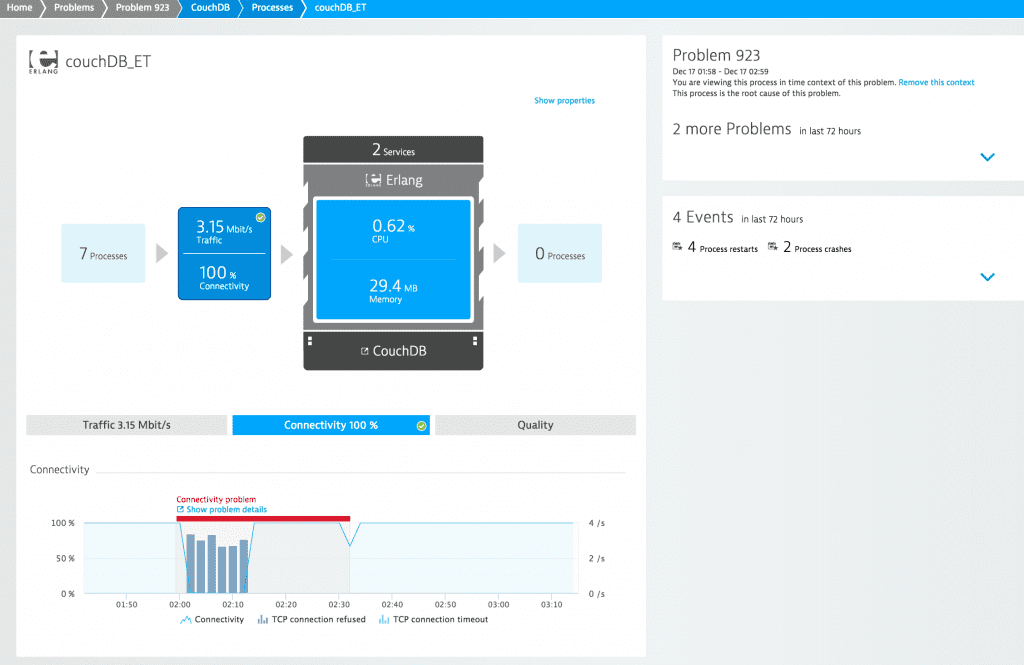
My tool of choice for network analysis in the datacenter is Dynatrace, but I’m obviously a bit biased. In analyzing the network health of one of my Tomcat servers (see the example below), I found out that my service had a responsiveness time of about 3 ms, not much traffic, and 100% availability over the last two hours.

Now the interesting part is how you can relate network errors to actual service response times. If response times or service availability deviate from the baseline you’ll see a summary of the resulting problems that shows how many users are affected and what the root cause of the issue is. The really neat thing about Dynatrace is how well it integrates all this information to help me assess and fix this problem.
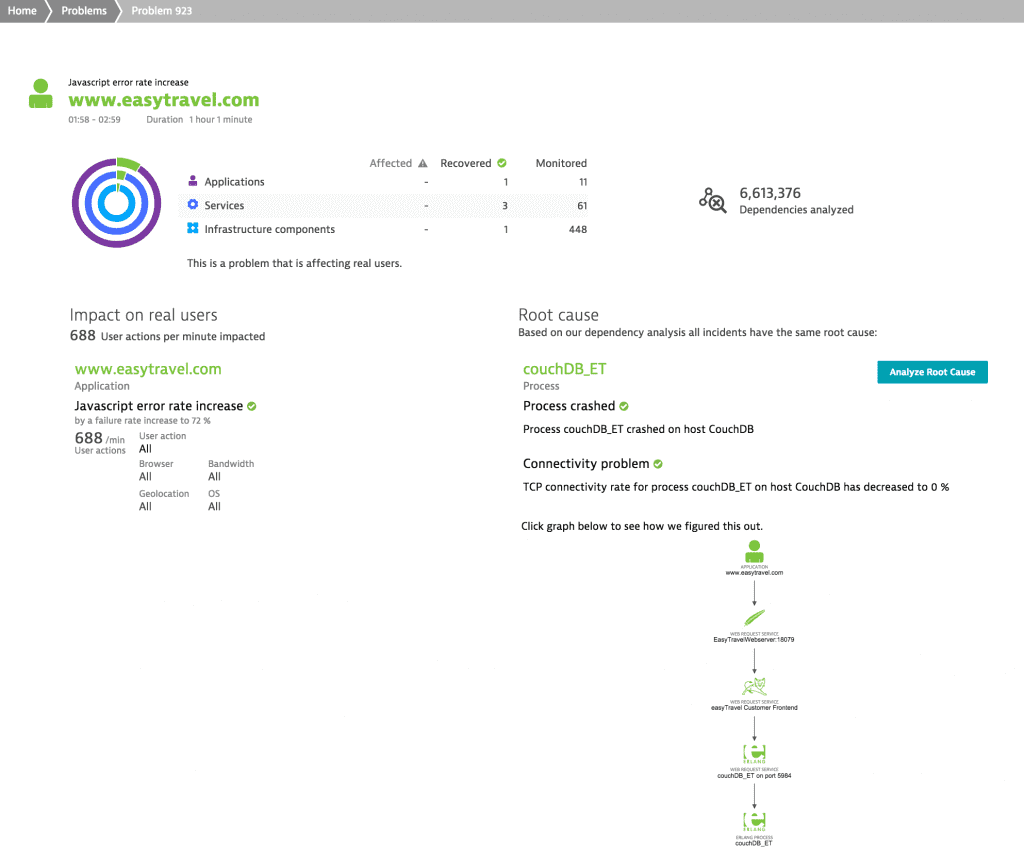
If you take a close look at the problem view you’ll see that this problem affected real users, 688 user actions per minute to be specific. Furthermore, you can see that the JavaScript error rate increased and that the root cause of this problem is a crashed couchDB process (i.e., the TCP connectivity rate for the process decreased to 0%). If you click on the process name you’ll see the following screen, where you can clearly see that the TCP connections were refused and the connectivity dropped to 0% while the process was restarted. This is what a common network error looks like from a services’ point of view.
Conclusion
Assessing the quality of your services on physical hosts with an underlying network consisting of physical switches and physical routers is a piece of cake with the right tools in place. However monitoring connectivity and performance in more complex infrastructures with network overlays and encapsulation, virtual switches that run as applications, and intra-VM traffic that you never see on any physical network interface add additional layers of complexity. But that’s another story. So stay tuned!
A word from my sponsor: Take your network monitoring to a new level with a Dynatrace!
If you’re curious about taking Dynatrace network monitoring for a test drive, you should definitely go for it. There is a free usage tier so you can walk through all the functionality described here and see for yourself how well it works in your own environment.
Discover how you can proactively identify connection issues with Dynatrace.


Looking for answers?
Start a new discussion or ask for help in our Q&A forum.
Go to forum