
Performance monitoring is making CIOs anxious. According to IDG Research, 80% of CIOs rank application and network performance as a top priority, but only 16% believe they are doing it well.
What is holding them back? A lack of visibility, to start
CIOs don’t have the benefit of unified, dashboard-level insights into their domain that their CMO and CFO counterparts enjoy. CMOs can easily see the results and plans of their marketing efforts, and CFOs have immediate insight to the financial condition of their organization. Unfortunately, there aren’t many solutions that provide the level of insight into application and network performance at the level their colleagues in the C-suite have access to.
CIOs have had to deal with a rapidly changing environment and must piece together information from different tools and different teams, to understand the performance of their systems. The network team reports on the network, the infrastructure guys provide information about the servers, and then you have different application teams with app-specific information. When a problem occurs, many of these tools provide conflicting information (even if they are from the same vendor), which leads to finger pointing and the need for getting everyone in a room to sort through the disconnected data and look for correlation. CIOs don’t have time for this. When things go wrong, business leaders are breathing down their neck for a fast solution.
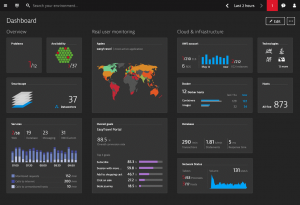
Dynatrace understands the predicament that CIOs, and all other IT leaders, are in. That is why we reinvented monitoring with a unified full stack solution that gives answers and not just data. And everything is visible in a clean, customizable dashboard.
Enter automation and artificial intelligence
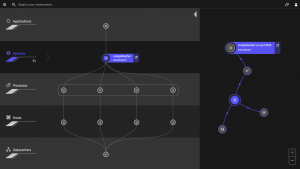
To keep the dashboards updated in real-time, Dynatrace employs automation and artificial intelligence (AI). Dynatrace uses automation to deploy its single agent that works with almost any technology. Dynatrace auto-discovers all components of the full stack, auto-instruments them, and then auto-analyzes the performance of each using AI. The Dynatrace Smartscape® view shows everything – data centers (on-premise and cloud), hosts, processes, services and applications – in a single view and in real-time. It gives CIOs and their teams a view of how everything is working together and all the dependencies that exist. It gives them unified information on performance from the network to the end user’s interactions with their applications. Dynatrace dynamically baselines everything and the AI continuously monitors the system looking for anomalies.
As more companies move to containers and microservices, the need for full stack, automated monitoring increases. With these highly dynamic, distributed systems, where millions of dependencies exist and are constantly changing, it is impossible for humans to manage, and even harder to troubleshoot. Dynatrace’s fully-automated approach, along with its artificial intelligence engine, understands the relationships between all the components and provide instant insights to the performance of each in relation to the others.
Multiple, siloed tools make it hard to find problems
Using siloed, disconnected tools makes it harder for CIOs and their teams to find the root cause of problems. It requires correlation of the different data sources to try and isolate what was going on with each part of the stack when the problem occurred. Even if this is done efficiently, correlation does not equal causation, and my colleague Joseph Hoffman wrote a nice piece explaining why. Correlated events can sometimes send teams on a wild goose chase, and this adds time to finding the real cause. The IDG survey supports this with almost half the CIOs stating that it takes their teams too much time to resolve problems.
Where Dynatrace is different
Once the root cause of a problem can be definitively identified, it usually doesn’t take long to fix it. Finding it is the hard part, especially if you’re dealing with microservices and distributed architectures. Dynatrace is reinventing monitoring with full automation and an artificial intelligence engine that dynamically sets baselines and understands the normal behavior of your application. When anomalies are detected, Dynatrace automatically analyzes all the dependencies and performs root cause analysis. A single alert with the identified root cause of the problem is then sent to the appropriate people. CIOs and their teams no longer have to contend with late-night, arduous war rooms.
“After deploying a new release, we spent over 30 hours trying to find a performance problem. Once we found the issue, it only took us 30 minutes to fix it. With [Dynatrace], finding a similar problem would only take us minutes to identify”
Eugenia Gillian, VP of Engineering, ZoomInfo (see case study)
CIOs now have a way to address their needs and feel confident about their team’s ability to resolve problems quickly.
At Dynatrace, we subscribe to the belief that “Seeing is believing,” and have made is very easy for you to experience Dynatrace on your terms in your environment with our free trial. Within minutes, Dynatrace will auto-discover and provide a visual map of all the dependencies of each component in the full stack.
Just as the technology landscape is quickly evolving, so is Dynatrace with new features and functionality upgrades happening every two weeks. Even if you have tried Dynatrace in the past, try us again.


Looking for answers?
Start a new discussion or ask for help in our Q&A forum.
Go to forum