To get your summer started off right, Dynatrace is launching a public beta of our new web check analysis page!

You can now dive into the details of any web check run Analysis page to troubleshoot external outages and performance violations.
To access a web check run Analysis page
- Open the Dynatrace menu and select Availability & SLA.
- Select a web check.
- On the Web checks page, select one of the Top findings (Status, Performance violation, Slowest run, and Fastest run) to view web check runs that Dynatrace has identified as being of particular importance for analysis.

Each finding type features a web check run that’s specific to that finding.
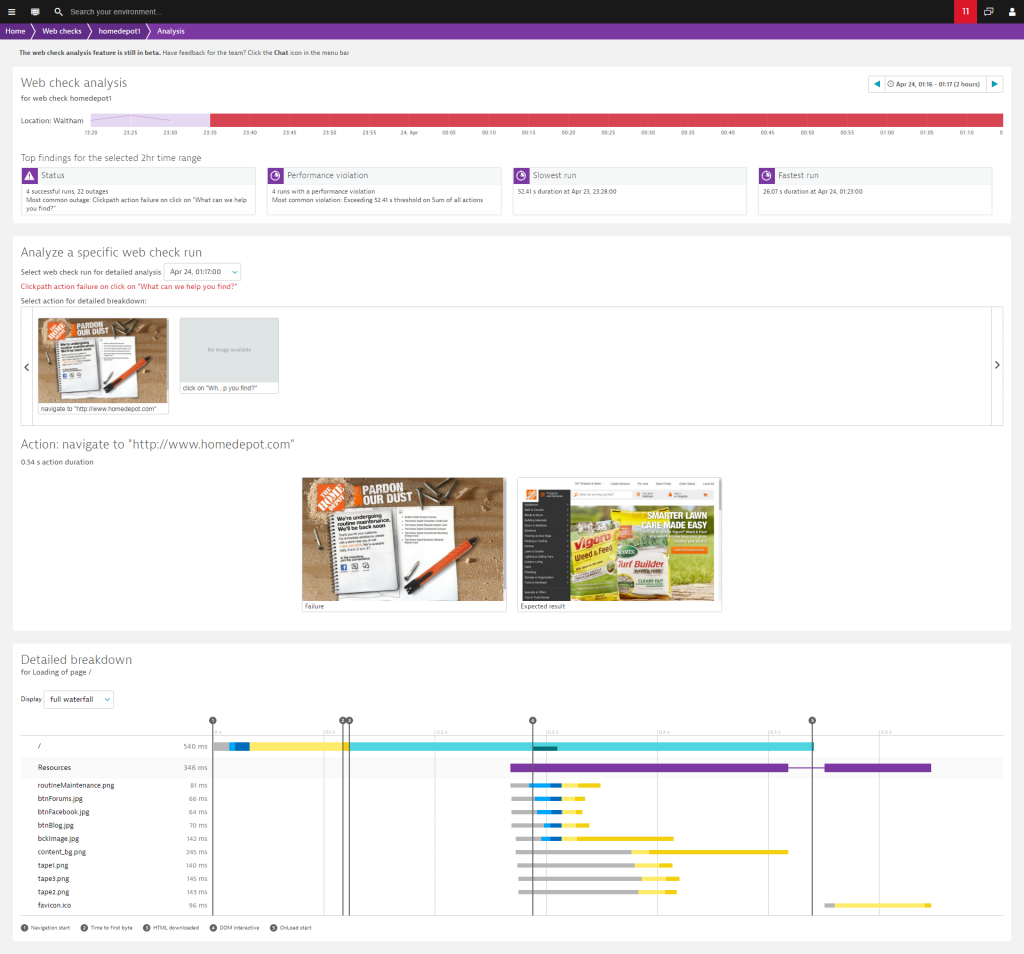
Have an outage?
You can now compare screenshots of failure states alongside screenshots of those same pages that show the correct rendering of the page.
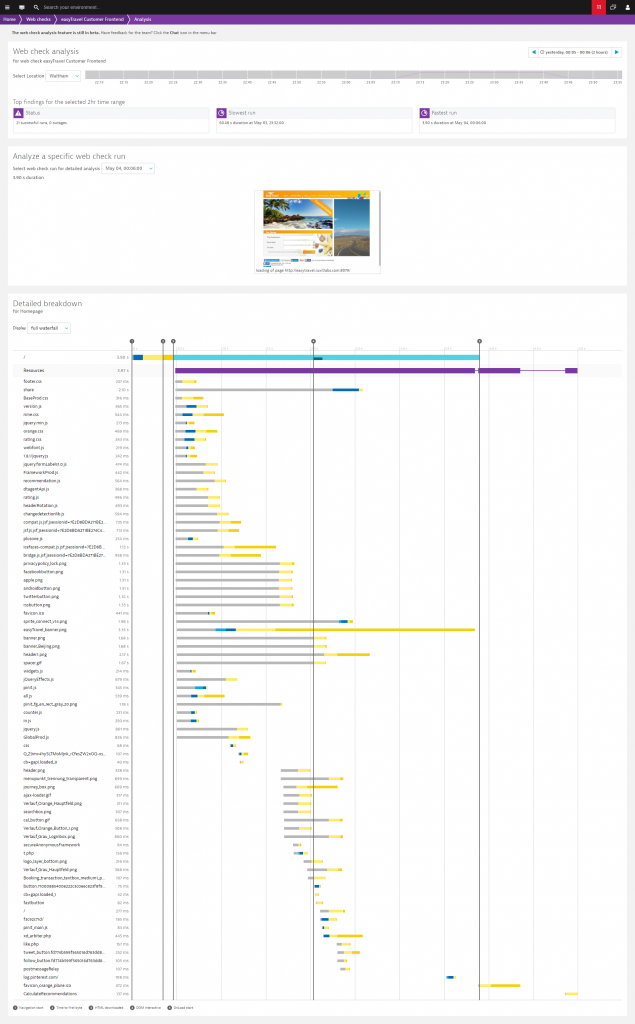
Receive a performance-threshold violation notification?
View a Full waterfall breakdown of any web check run that triggers a violation to see resource timings for all downloaded objects.
To analyze a short time frame or specific event
- Open the Dynatrace menu and select Availability & SLA.
- Select a web check.
- On the Web checks page, scroll down to the Location list.
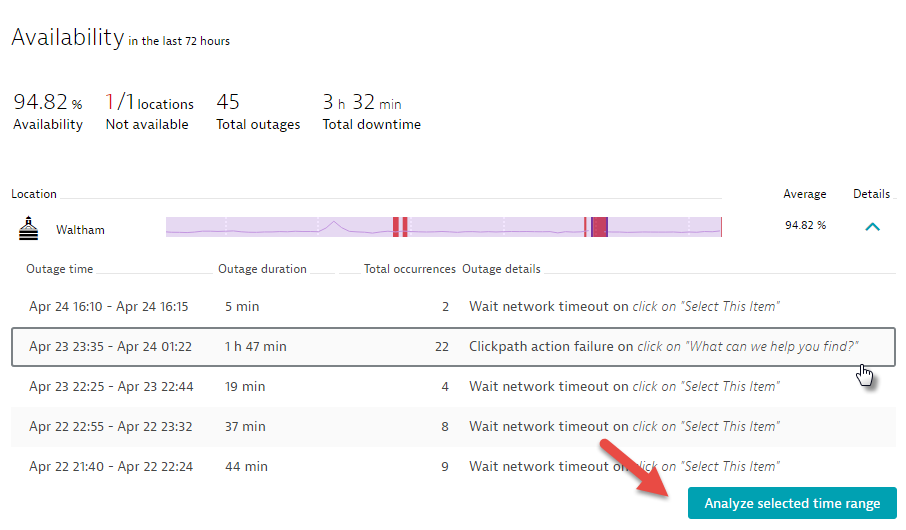
- Expand the Details view of any listed location to view the list of availability and performance violation events that were encountered at this location.
- Click Analyze selected time range.
The most relevant two-hour time range for the event is selected automatically.
Analyze web checks any time
You can analyze the performance of your web checks anytime–no need to wait until a violation is triggered. It’s always worth analyzing how well your 1st party, 3rd party, and CDNs are performing in markets you’re already in (or may venture into soon).
To analyze a web check at any time
- Open the Dynatrace menu and select Availability & SLA.
- Select a web check.
- On the Web checks page, scroll down to the Location list.
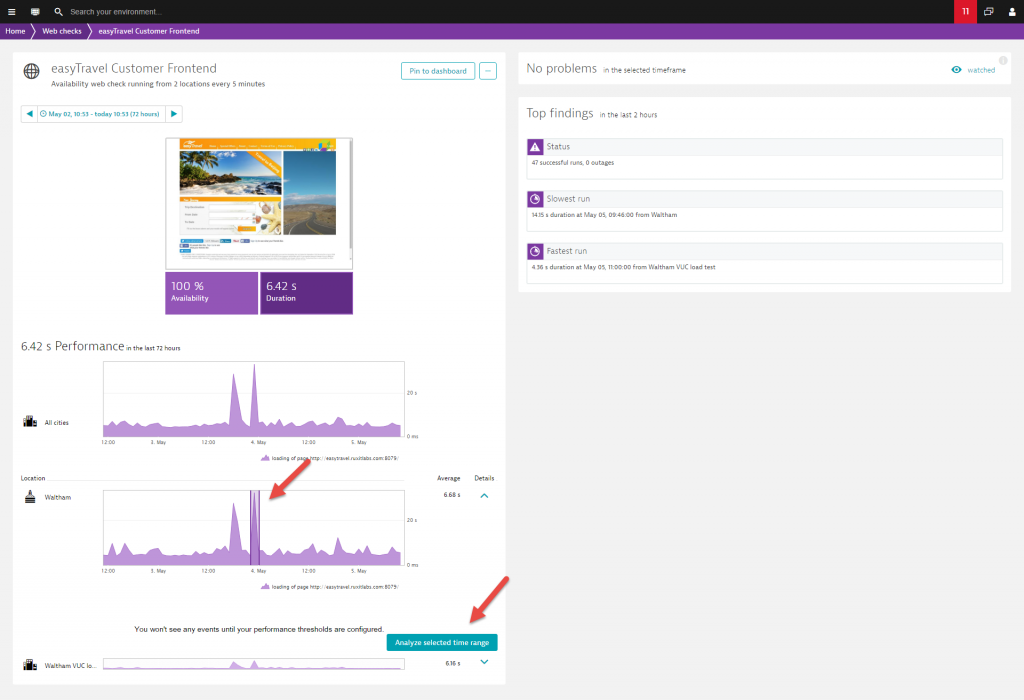
- Expand the Details view of any listed location and select a 2-hour time frame for analysis.
- Click Analyze selected time range.




Looking for answers?
Start a new discussion or ask for help in our Q&A forum.
Go to forum