Message queue monitoring
Dynatrace automatically monitors your message queues like Apache Kafka, ActiveMQ, IBM MQ, RabbitMQ and their microservices. Detect anomalies that may impact your mission-critical apps fast.
What is a message queue?
A message queue is a form of middleware used in software development to enable communications between services, programs, and dissimilar components (such as operating systems and communication protocols). A message queue enables the smooth flow of information to make complex systems work.
Start monitoring your asynchronous microservices
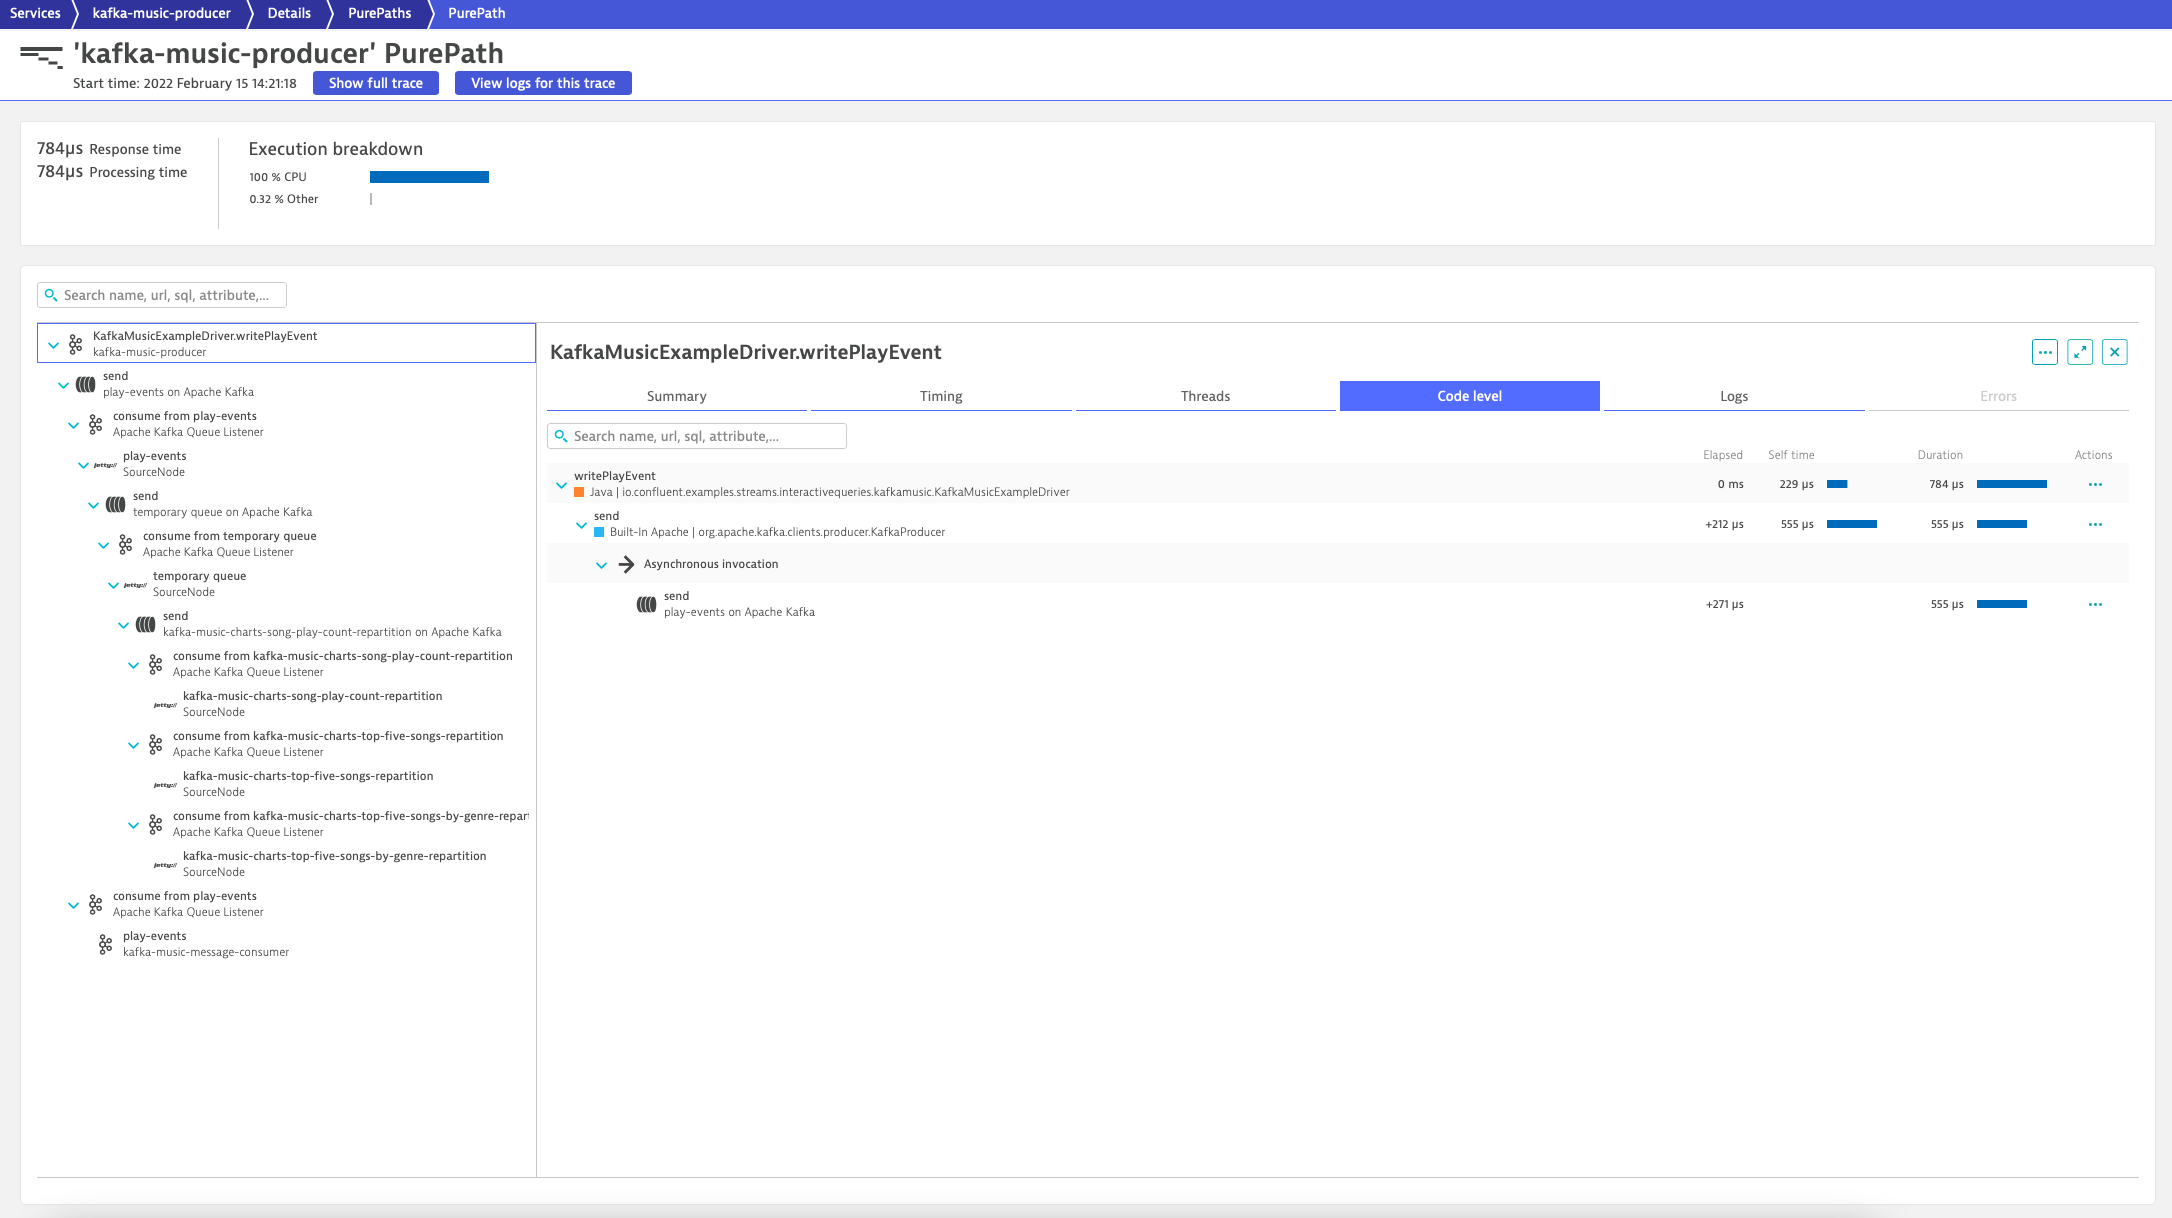
Dynatrace automatically monitors microservices that interact with topics and queues to detect anomalies at the code level.
- Avoid manual configuration with automated discovery and monitoring
- Automatically detect new hosts that are running message queues
- Instantly gain access to all metrics, traces, and logs
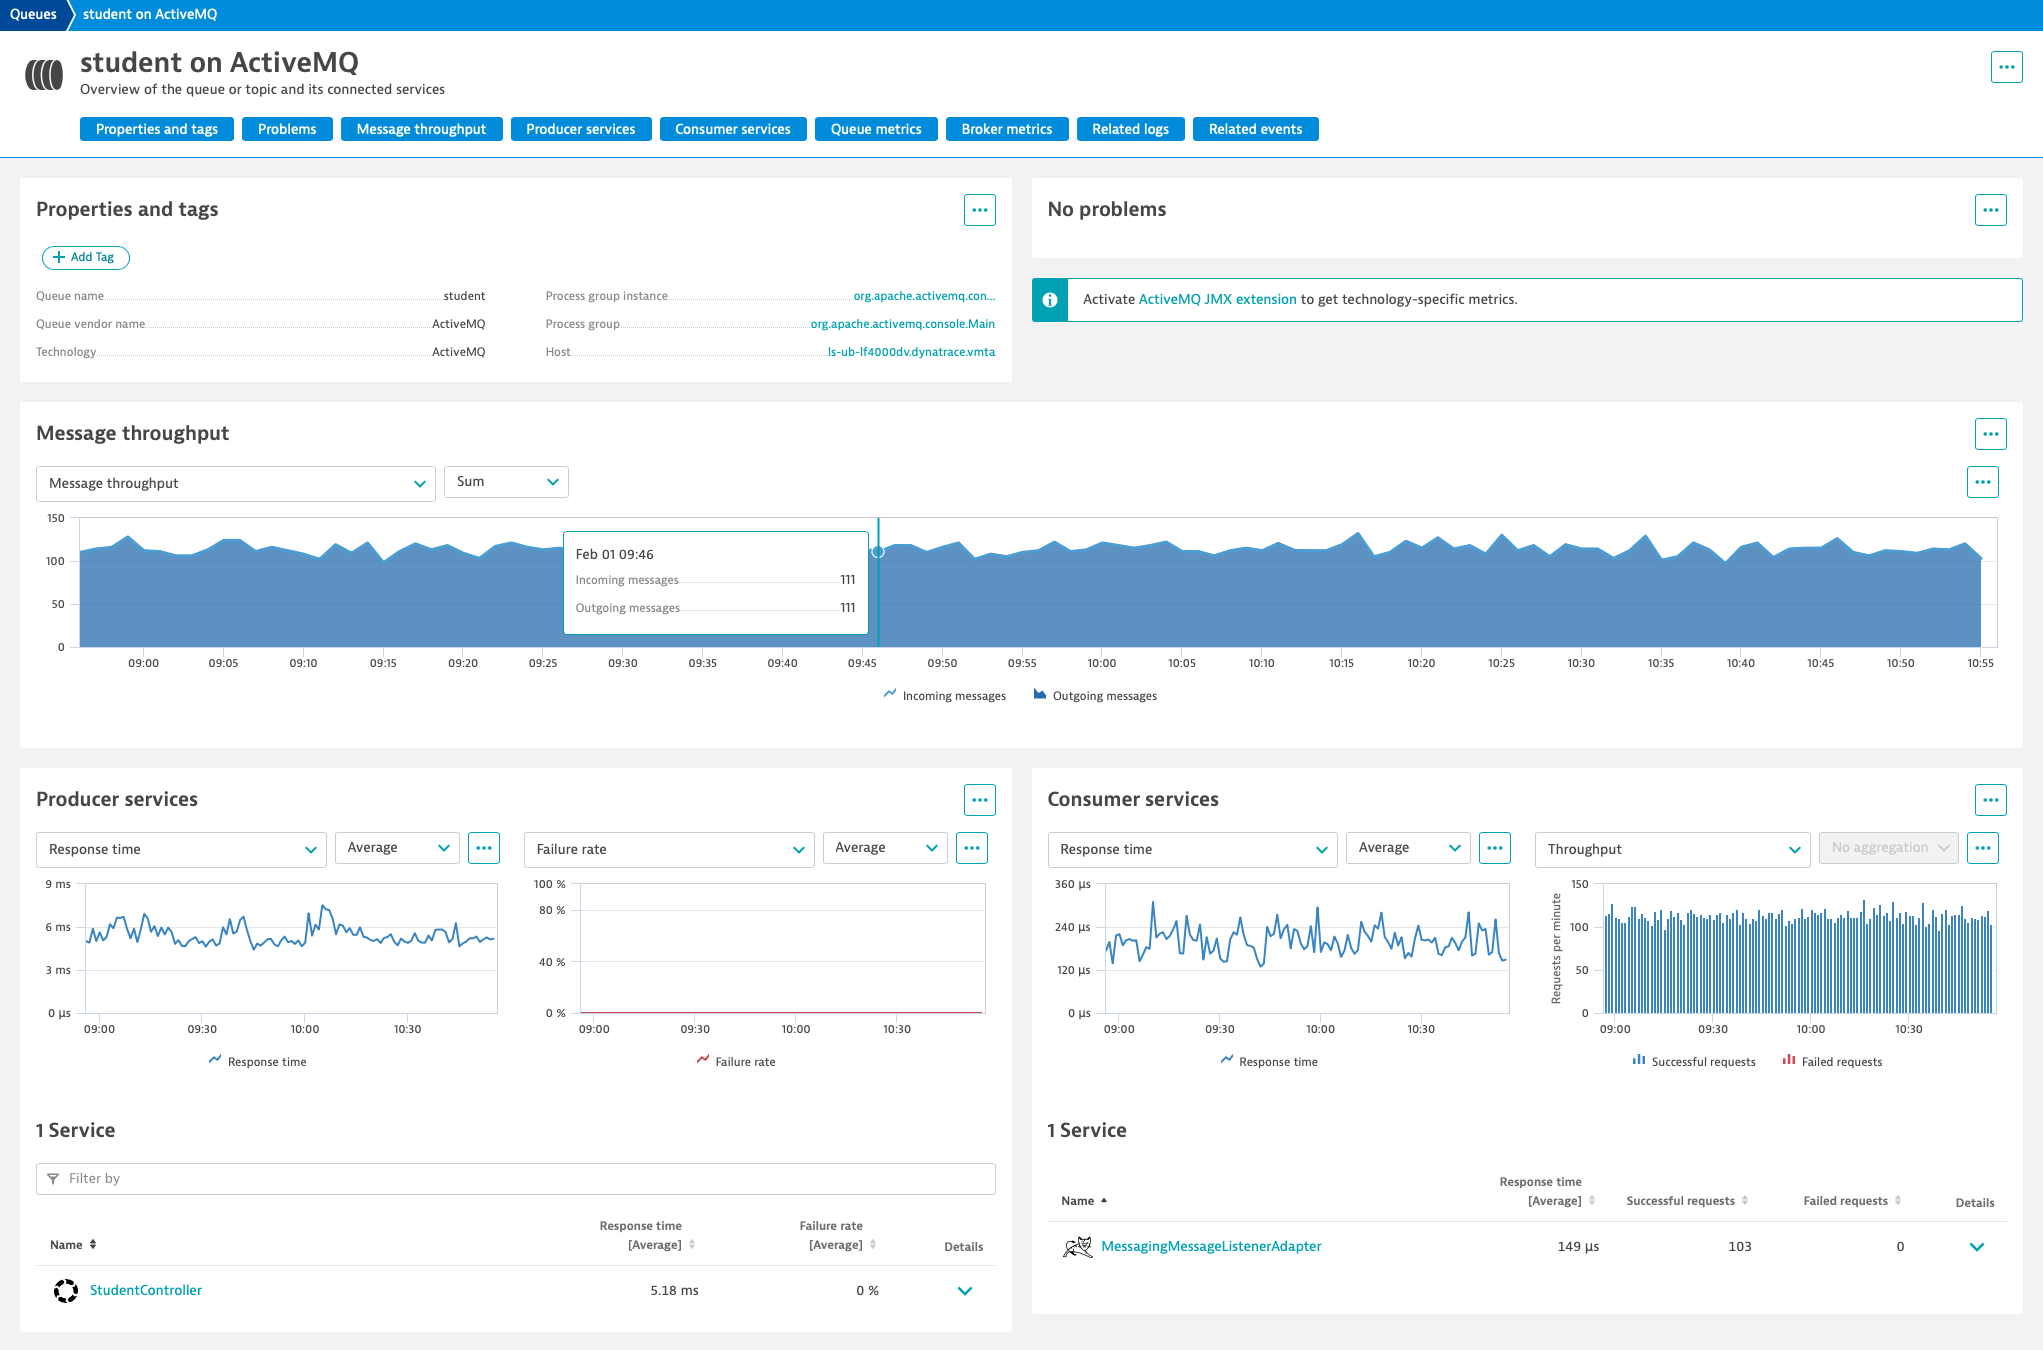
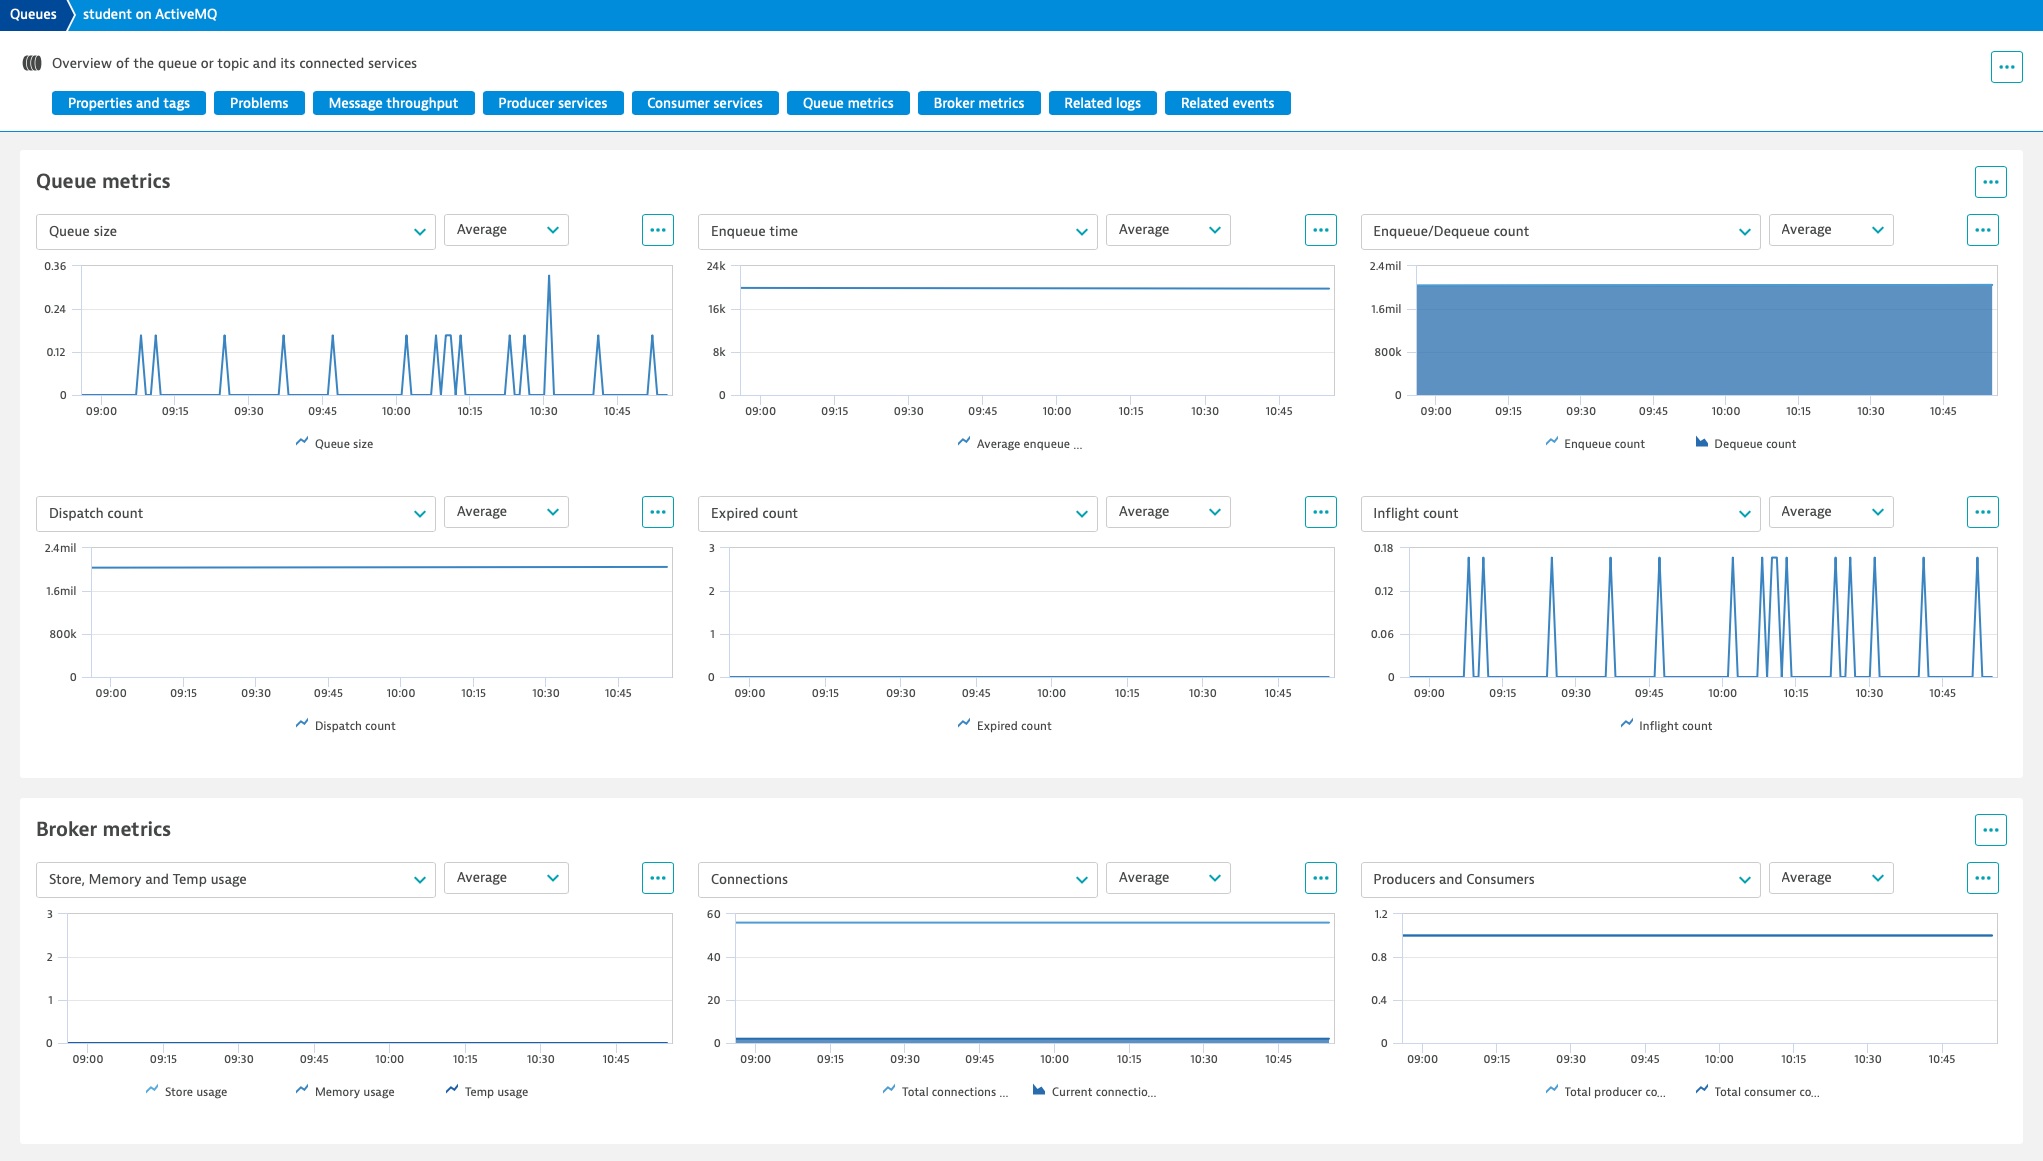
Gather valuable message queue health and performance data
Seamless end-to-end tracing complemented with technology-specific message queue performance metrics, will give you a better understanding of anomalies that impact your mission-critical apps.
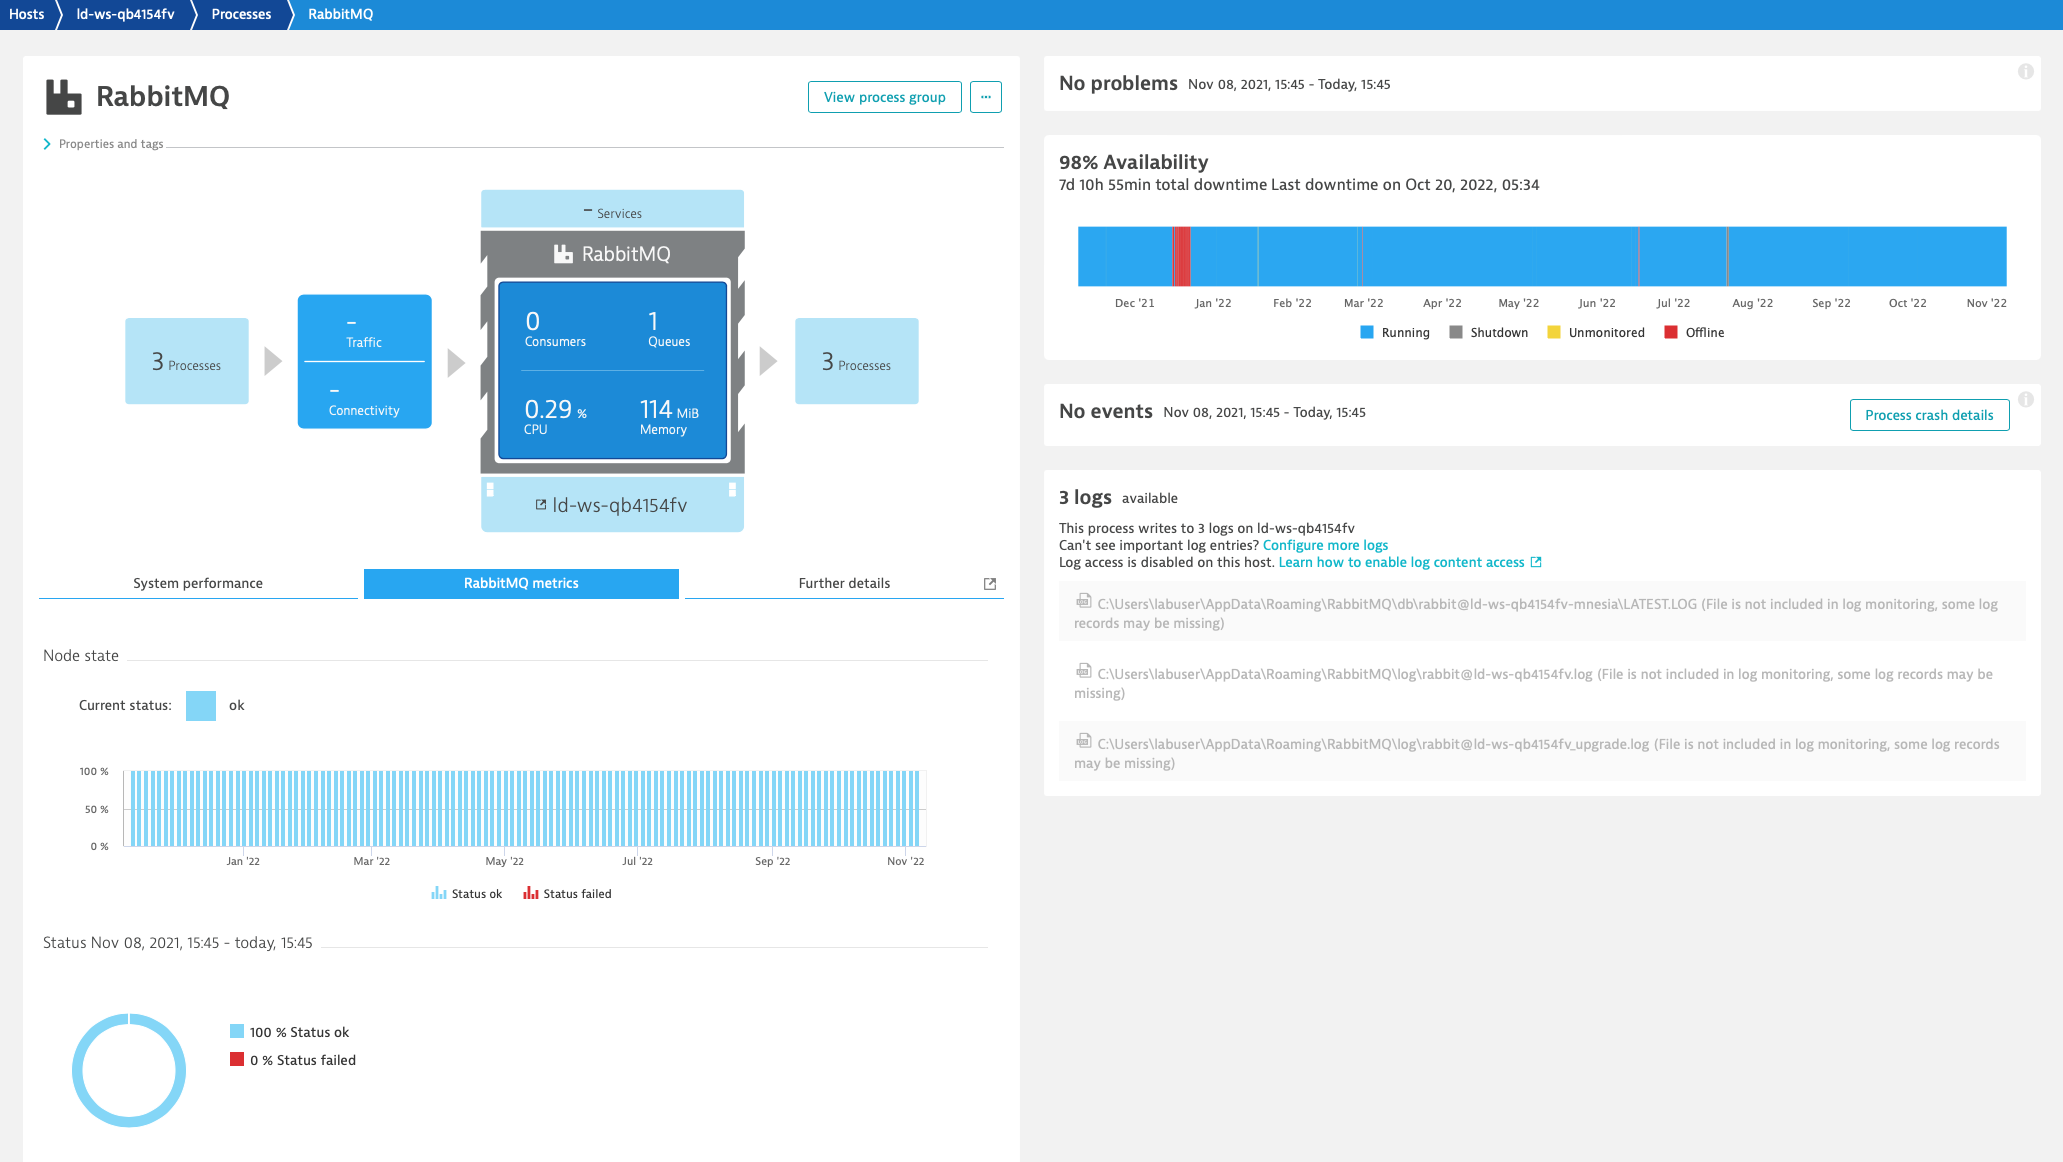
Track your mission-critical apps down to the underlying infrastructure
Comprehensive host metrics and logs give you insights about the availability and health of your message queue deployment. Reduce mean time to repair with events pointing to critical anomalies in your underlying infrastructure.
Get a free trial


Enable ActiveMQ monitoring globally
By enabling Active MQ globally, you let Dynatrace automatically collect ActiveMQ metrics whenever a new host running ActiveMQ message queueing is detected in your environment.


