
Anyone who ever monitored or analyzed an application uses or has used averages. They are simple to understand and calculate. We tend to ignore how wrong the picture is that averages paint of the world. To emphasize the point, let me give you a real-world example outside of the performance space I recently read in a newspaper.
The article explained that the average salary in a certain region in Europe was 1,900 Euro (to be clear, this would be good in that region!). However, when looking closer, they found that most people, namely 9 out of 10 people, only earned around 1000 Euro and one would earn 10,000 (I oversimplified this of course, but you get the idea). If you do the math, you’ll see that the average of this is indeed 1,900 Euro, but we can all agree that this does not represent the “average” salary, as we would use the word in daily life. So now let’s apply this thinking to application performance.
The average response time
The average response time is by far the most commonly used metric in application performance management. We assume this represents a “normal” transaction, but this would only be true if the response time is always the same (all transactions run at equal speed) or the response time distribution is roughly bell-curved.

In a Bell Curve, the average (mean) and median are the same. In other words, observed performance would represent the majority (half or more than half) of the transactions.
In reality, most applications have few heavy outliers. A statistician would say the curve has a long tail. A long tail does not imply many slow transactions, but a few magnitudes slower than the norm.

We recognize that the average no longer represents the bulk of the transactions, but can be much higher than the median.
You can now argue that this is not a problem, as long as the average doesn’t look better than the median. I would disagree, but let’s look at another real-world scenario experienced by many of our customers:

In this case, a considerable percentage of transactions are very, very fast (10-20 percent), while the bulk of transactions are several times slower. The median would still tell us the true story, but the average all of a sudden looks a lot faster than most of our transactions actually are. This is typical in search engines or when caches are involved. Some transactions are very fast, but the bulk are normal. Another reason for this scenario are failed transactions, more specifically transactions that failed fast. Many real-world applications have a failure rate of 1-10 percent (due to user errors or validation errors). These failed transactions are often magnitudes faster than the real ones, and consequently distorted an average.
Of course, performance analysts are not stupid and regularly try to compensate with higher frequency charts (compensating by looking at smaller aggregates visually) and by taking in minimum and maximum observed response times. However, we can often only do this if we know the application very well. Those unfamiliar with the application might easily misinterpret the charts. Because of the depth and type of knowledge required for this, it’s difficult to communicate your analysis to other people. Think how many arguments between IT teams have been caused by this. And that’s before we even think about communicating with business stakeholders!
A better metric by far are percentiles, because they allow us to understand the distribution. But before we look at percentiles, let’s take a look at a key feature in every production monitoring solution: Automatic baselining and alerting.
Automatic baselining and alerting
In real-world environments, performance gets attention when it is poor and negatively impacts the business and users. But how can we quickly identify performance issues to prevent negative effects? We cannot alert on every slow transaction since there are always some. In addition, most Operations teams have to maintain a large number of applications and are not familiar with all of them, so manually setting thresholds can be inaccurate, painful, and time-consuming.
The industry has come up with a solution called Automatic Baselining. Baselining calculates the “normal” performance and only alerts us when an application slows down or produces more errors than usual. Most approaches rely on averages and standard deviations.
Without going into statistical details, this approach again assumes the response times are distributed over a bell curve:

Typically, transactions that are outside 2 times standard deviation are treated as slow and captured for analysis. An alert is raised if the average moves significantly. In a bell curve, this would account for the slowest 16.5 percent (and you can of course adjust that), however, if the response time distribution does not represent a bell curve it becomes inaccurate. We either end up with a lot of false positives (transactions that are a lot slower than the average but when looking at the curve lie within the norm) or we miss a lot of problems (false negatives). In addition, if the curve is not a bell curve than the average can differ a lot from the median, applying a standard deviation to such an average can lead to quite a different result than you would expect! To work around this problem these algorithms have many tunable variables and a lot of “hacks” for specific use cases.
Percentile vs average
A percentile tells me at which part of the curve I am looking at and how many transactions are represented by that metric. To visualize this look at the following chart:
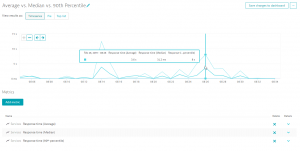
As you can see in the above graph, the average is very volatile. The other two lines represent the median and 90th percentile. As we can see the median is rather stable but has a couple of jumps. These jumps represent real performance degradation for the majority (50%) of the transactions. The 90th percentile (this is the start of the “tail”) is a lot more volatile, which means that the outliers’ slowness depends on data or user behavior. What’s important here is that the average is heavily influenced (dragged) by the 90th percentile, the tail, rather than the bulk of the transactions.
If the 50th percentile (median) of a response time is 500ms, that means that 50% of my transactions are either as fast or faster than 500ms. If the 90th percentile of the same transaction is at 1000ms it means that 90% are as fast or faster and only 10% are slower. The average, in this case, could either be lower than 500ms (on a heavy front curve), a lot higher (long-tail), or somewhere in between. A percentile gives me a much better sense of my real-world performance because it shows me a slice of my response time curve.
For exactly, that reason percentiles are perfect for automatic baselining. If the 50th percentile moves from 500ms to 600ms I know that 50% of my transactions suffered a 20% performance degradation. You need to react to that.
In many cases, the 75th or 90th percentile does not change at all in such a scenario. This means the slow transactions didn’t get any slower; only the normal ones did. Depending on how long your tail is, the average might not have moved at all in such a scenario!
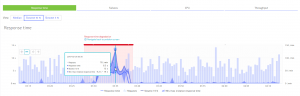
In other cases, we see the 98th percentile degrading from 1s to 1.5 seconds, while the 95th is stable at 900ms. This means your application is stable, but a few outliers got worse, nothing to worry about immediately. Percentile-based alerts do not suffer from false positives, are a lot less volatile and don’t miss any important performance degradations! Consequently, a baselining approach that uses percentiles does not require a lot of tuning variables to work effectively.
The following screenshot explains how percentile-based alerts do not suffer from false positives, are a lot less volatile, and don’t miss important performance degradation.
How can we use percentiles for tuning?
Percentiles are also great for tuning and giving your optimizations a particular goal. Let’s say that something within my application is too slow in general and I need to make it faster. In this case, I want to focus on bringing down the 90th percentile. This would ensure that the overall response time of the application goes down. In other cases, I have unacceptably long outliers I want to focus on bringing down response time for transactions beyond the 98th or 99th percentile (only outliers). We see many applications that have perfectly acceptable performance for the 90th percentile, with the 98th percentile being magnitudes worse.
In throughput-oriented applications on the other hand I would want to make the majority of my transactions very fast while accepting that optimization makes a few outliers slower. I might therefore make sure that the 75th percentile goes down while trying to keep the 90th percentile stable or not getting a lot worse.
I could not make the same kind of observations with averages, minimum and maximum, but with percentiles, they are very easy indeed.
Conclusion
Averages are ineffective because they are too simplistic and one-dimensional. Percentiles are a really great and easy way of understanding the real performance characteristics of your application. They also provide a great basis for automatic baselining, behavioral learning, and optimizing your application with a proper focus. In short, percentiles are great!
Start a free trial!
Dynatrace is free to use for 15 days! Want to see intelligent autobaselining in action? Just enter your email address, and get up and running in under 5 minutes.


Looking for answers?
Start a new discussion or ask for help in our Q&A forum.
Go to forum