
An exception does not always mean that something in your systems failed, but they can indicate current performance problems or issues that could cause failures in the future. For developers, investigating exceptions has traditionally been slow and tedious, requiring you to juggle different tools to assess the impact of an exception.
The new Exception Analysis in the Dynatrace Distributed Tracing app is designed to make this part of your job easier. It offers a new way to spot, group, and understand exceptions across the full trace, with readable stack traces, aggregated insights, and visual markers to highlight problematic spans. In minutes, it can help take you from “something looks odd,” to “this is actually important; it happens 1,000 times an hour; and here is the root cause.”
In this article, we’ll dive into a demo of exception analysis and explore how to investigate and analyze the exceptions over time.
But first, let’s take a closer look at why we care about exceptions in the first place.
Why investigate exceptions?
Exceptions are often the real reason a trace fails or slows down. When you scroll through spans trying to spot the problem, you may find a slow call—but the real issue is an exception somewhere else.
If you do find an exception, you still must figure out:
- Which span threw it?
- Is it happening all the time or just once?
- Is it the same error repeating?
- Which service is triggering it?
This is why Exception Analysis comes in handy. Having an aggregated view of all exceptions over a specific time frame helps you to see and investigate them clearly. It allows you to quickly answer questions like: What broke or slowed down? Where? How often? What is the impact?
Even if an exception hasn’t broken anything yet, issues like unsupported versions of dependencies, deprecated functions, etc. could cause headaches further down the line. An aggregated view helps you see clearly over time which exceptions caused specific failures, and by investigating exceptions that are “only” slowing the system down, you can proactively prevent major incidents in the future and spot slowdowns that would otherwise go undetected.
An example of exception analysis investigation
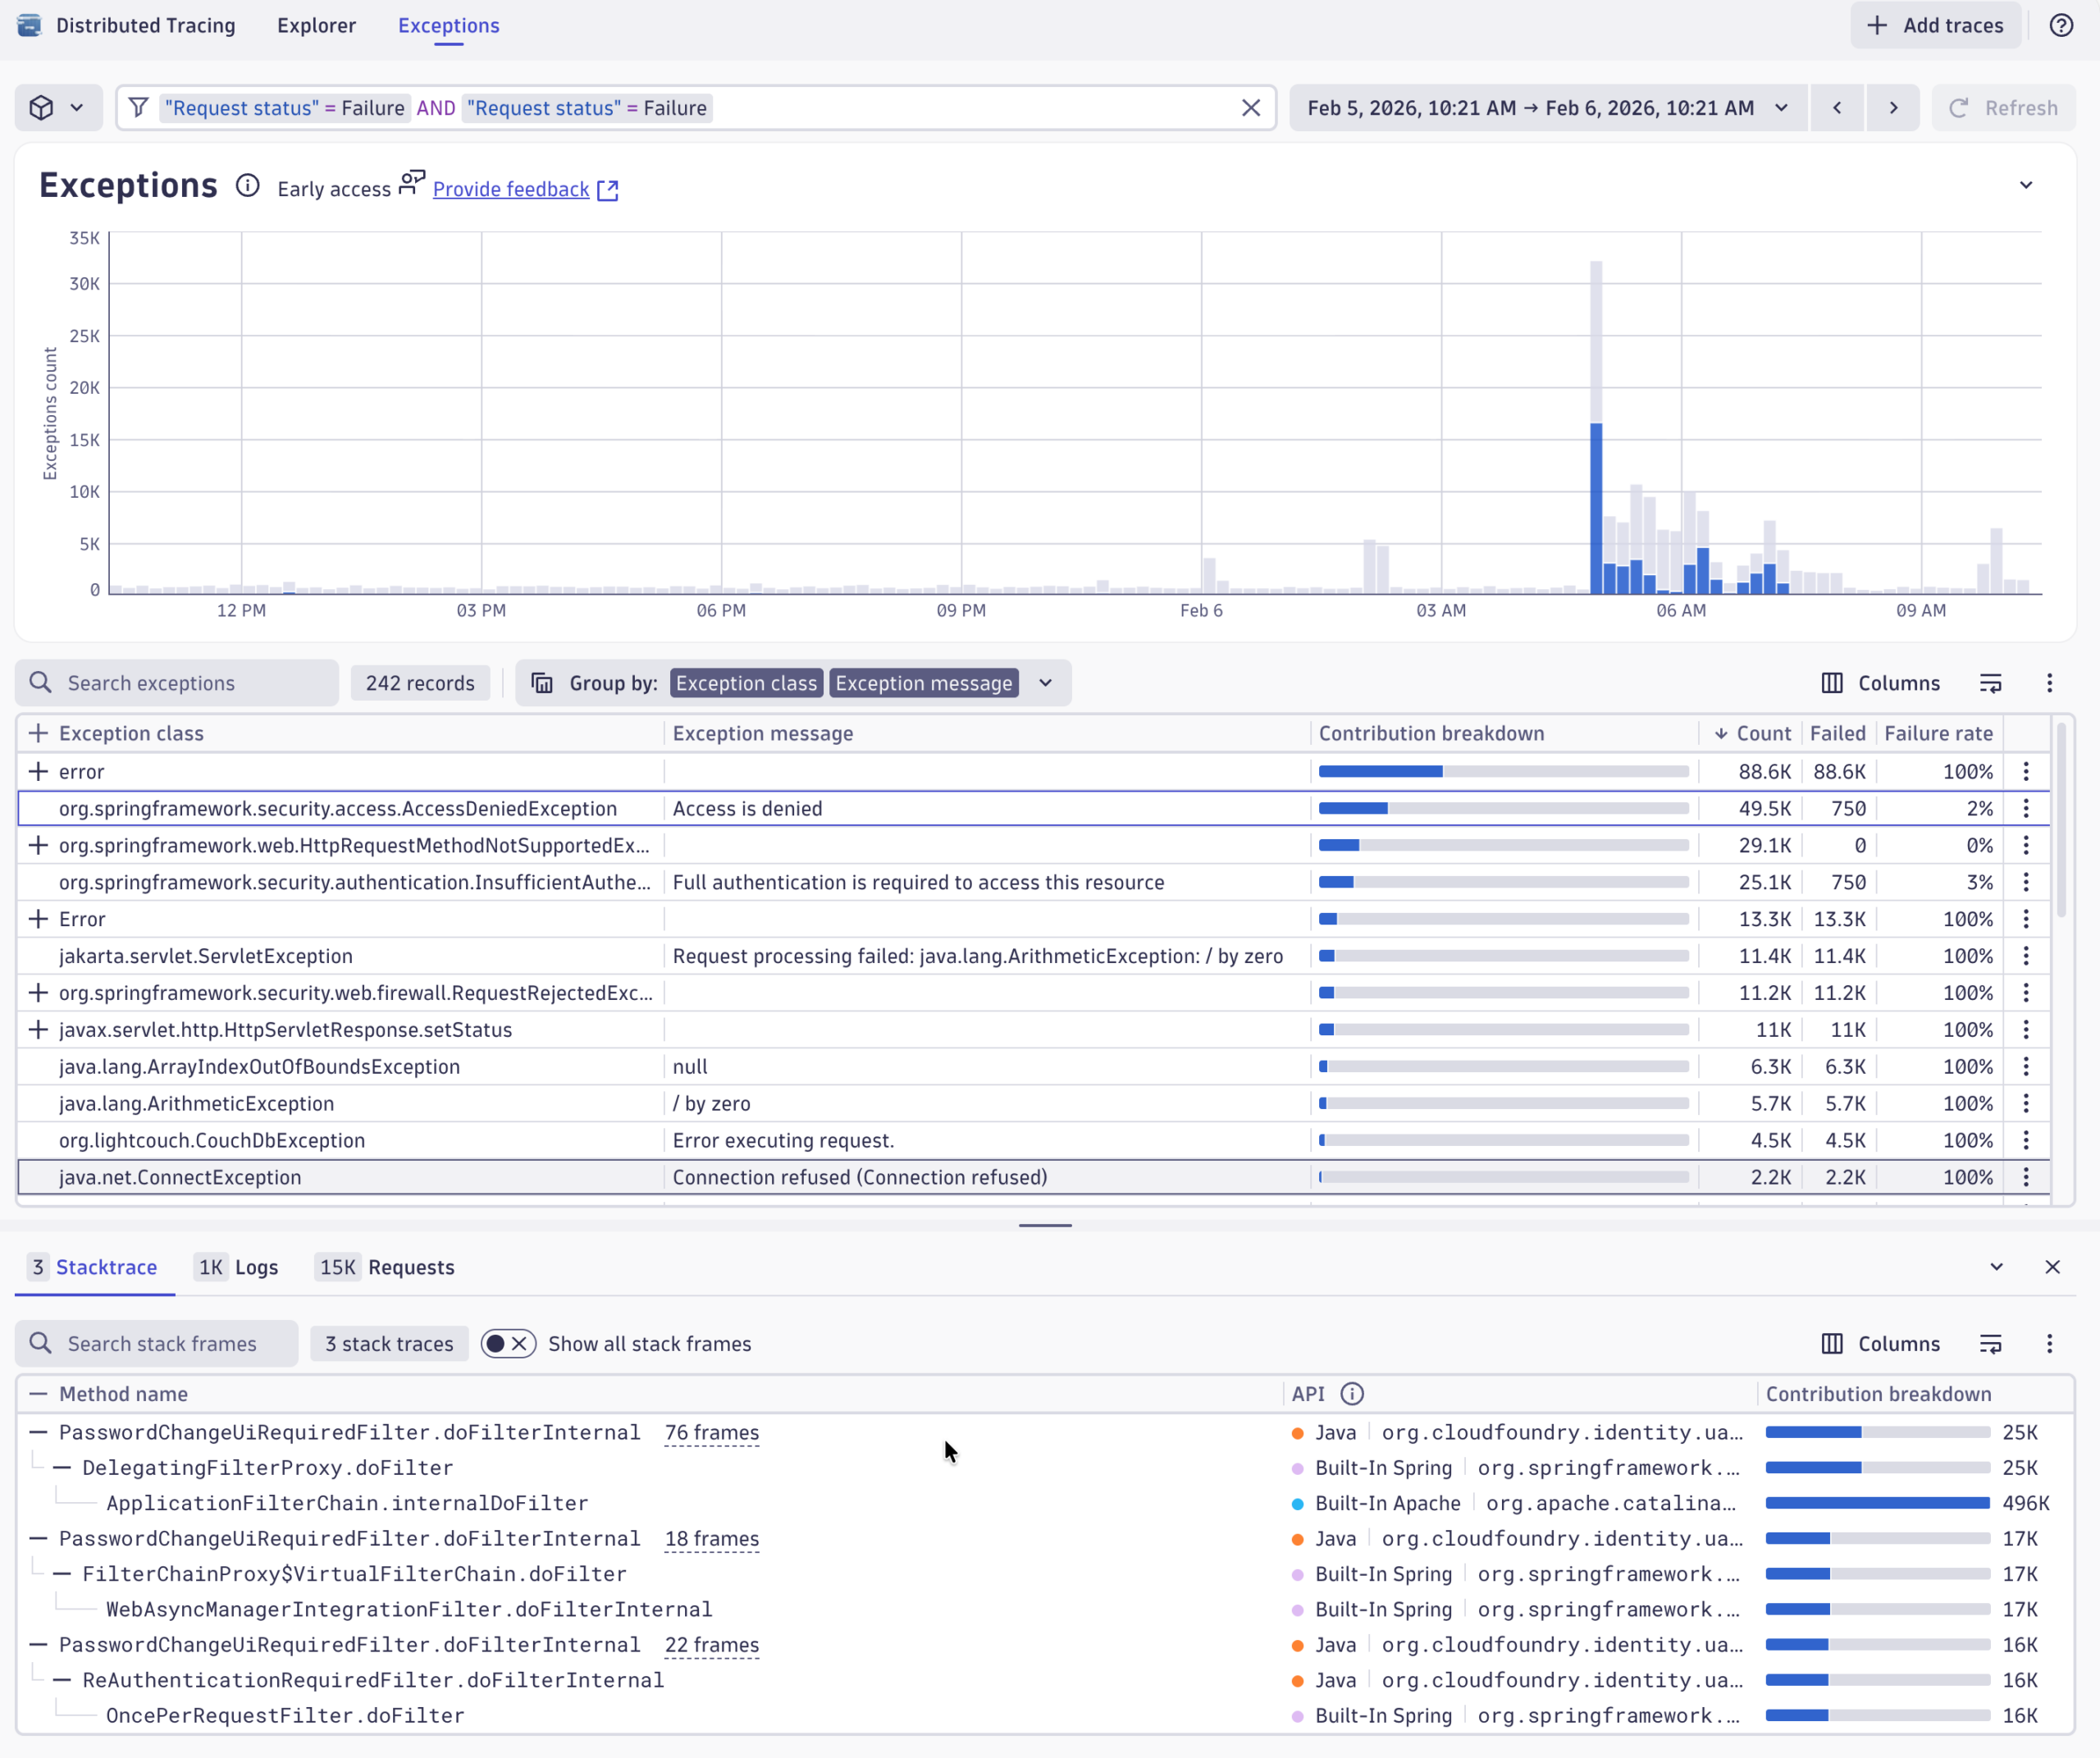
Let’s take a look at the new Exception Analysis perspective in the Distributed Tracing app. It offers a streamlined way to analyze exceptions over time and understand if they are directly related to failed requests of your services. This also allows users to understand technical exceptions and errors early before they lead to failures or outages later.
We’ll start at the time window of the last 24 hours to get an overview of what is happening in the environment lately. A PHP exception catches our eye. It looks a little bit awkward, and we see it happens quite often, but it’s not really leading to failing errors.
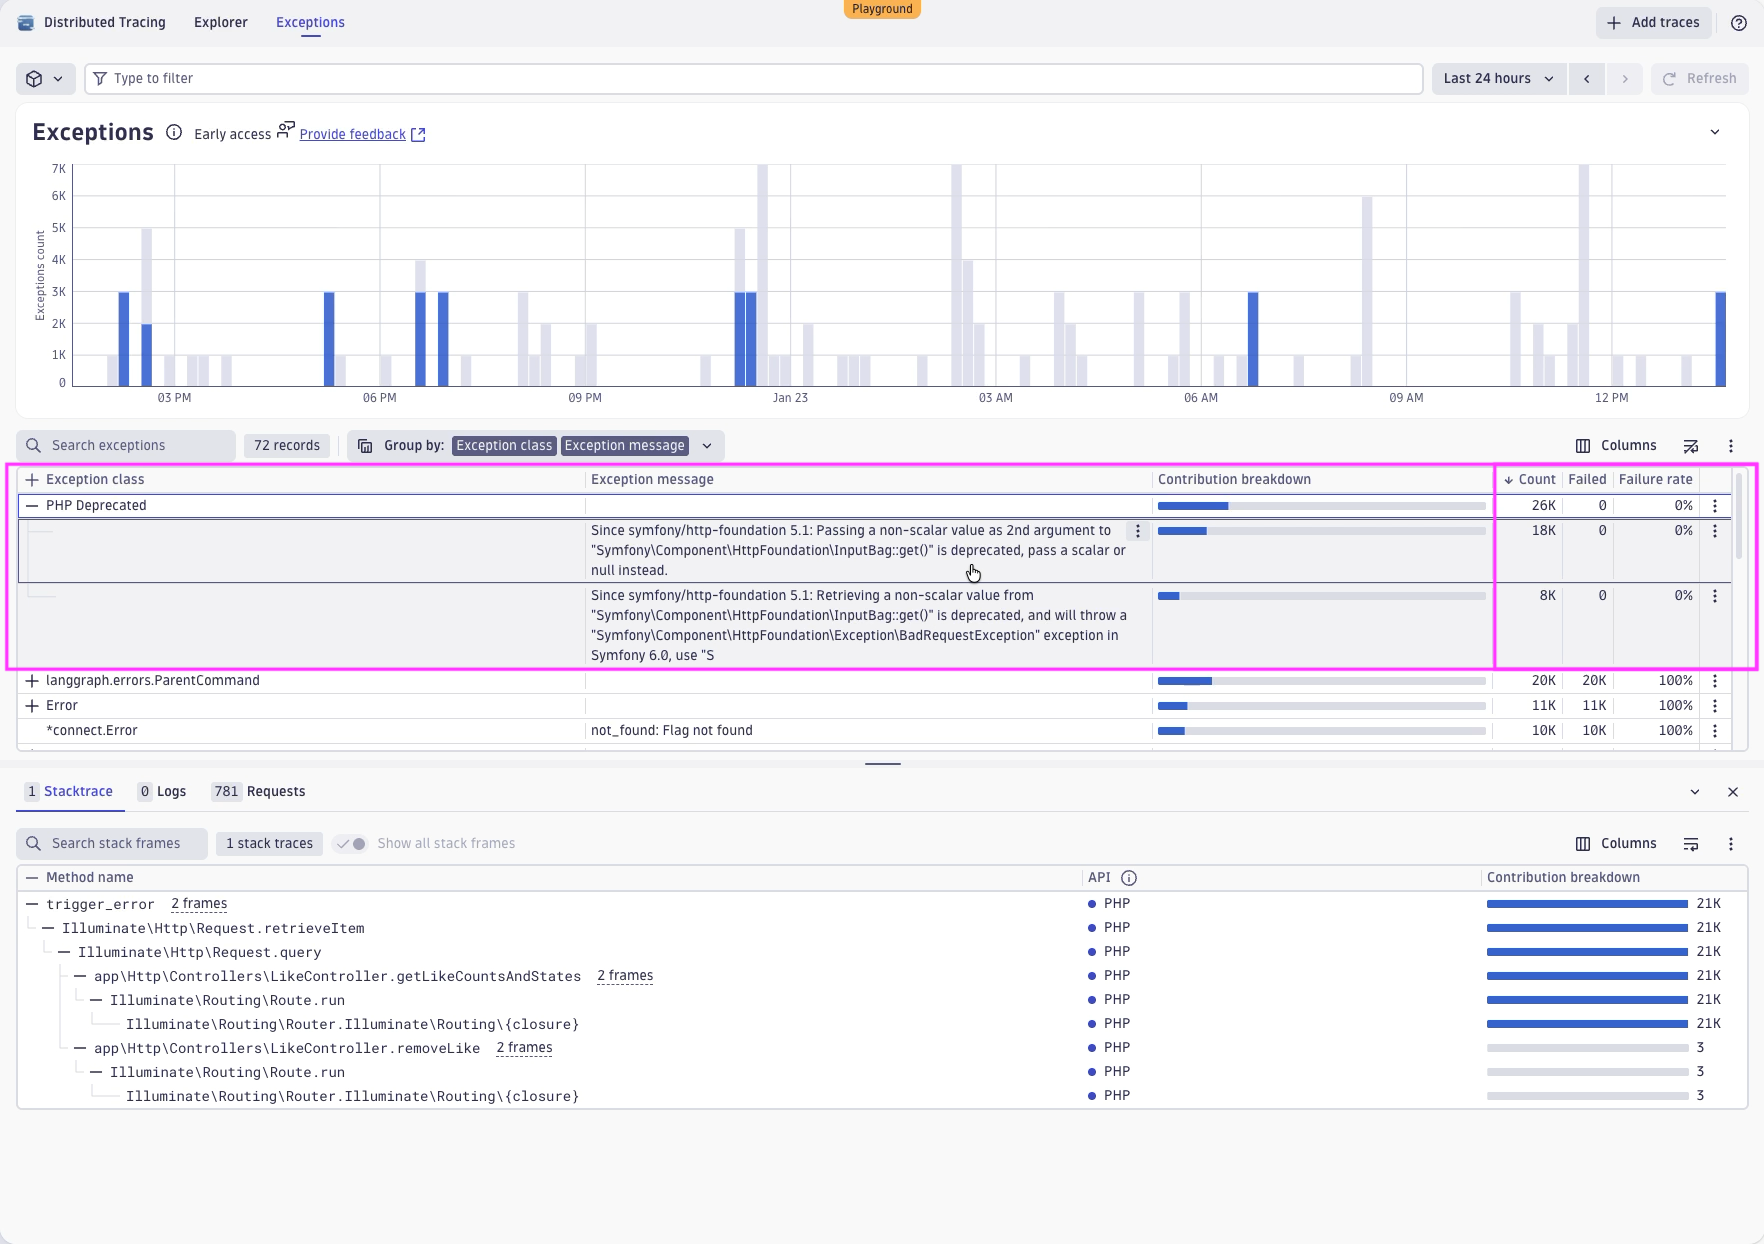
The interesting information here is that it seems like there is a deprecated function used within the application. In the future, this could lead to breaks and real failures when this function is removed or cannot be used in a way as it is used right now.
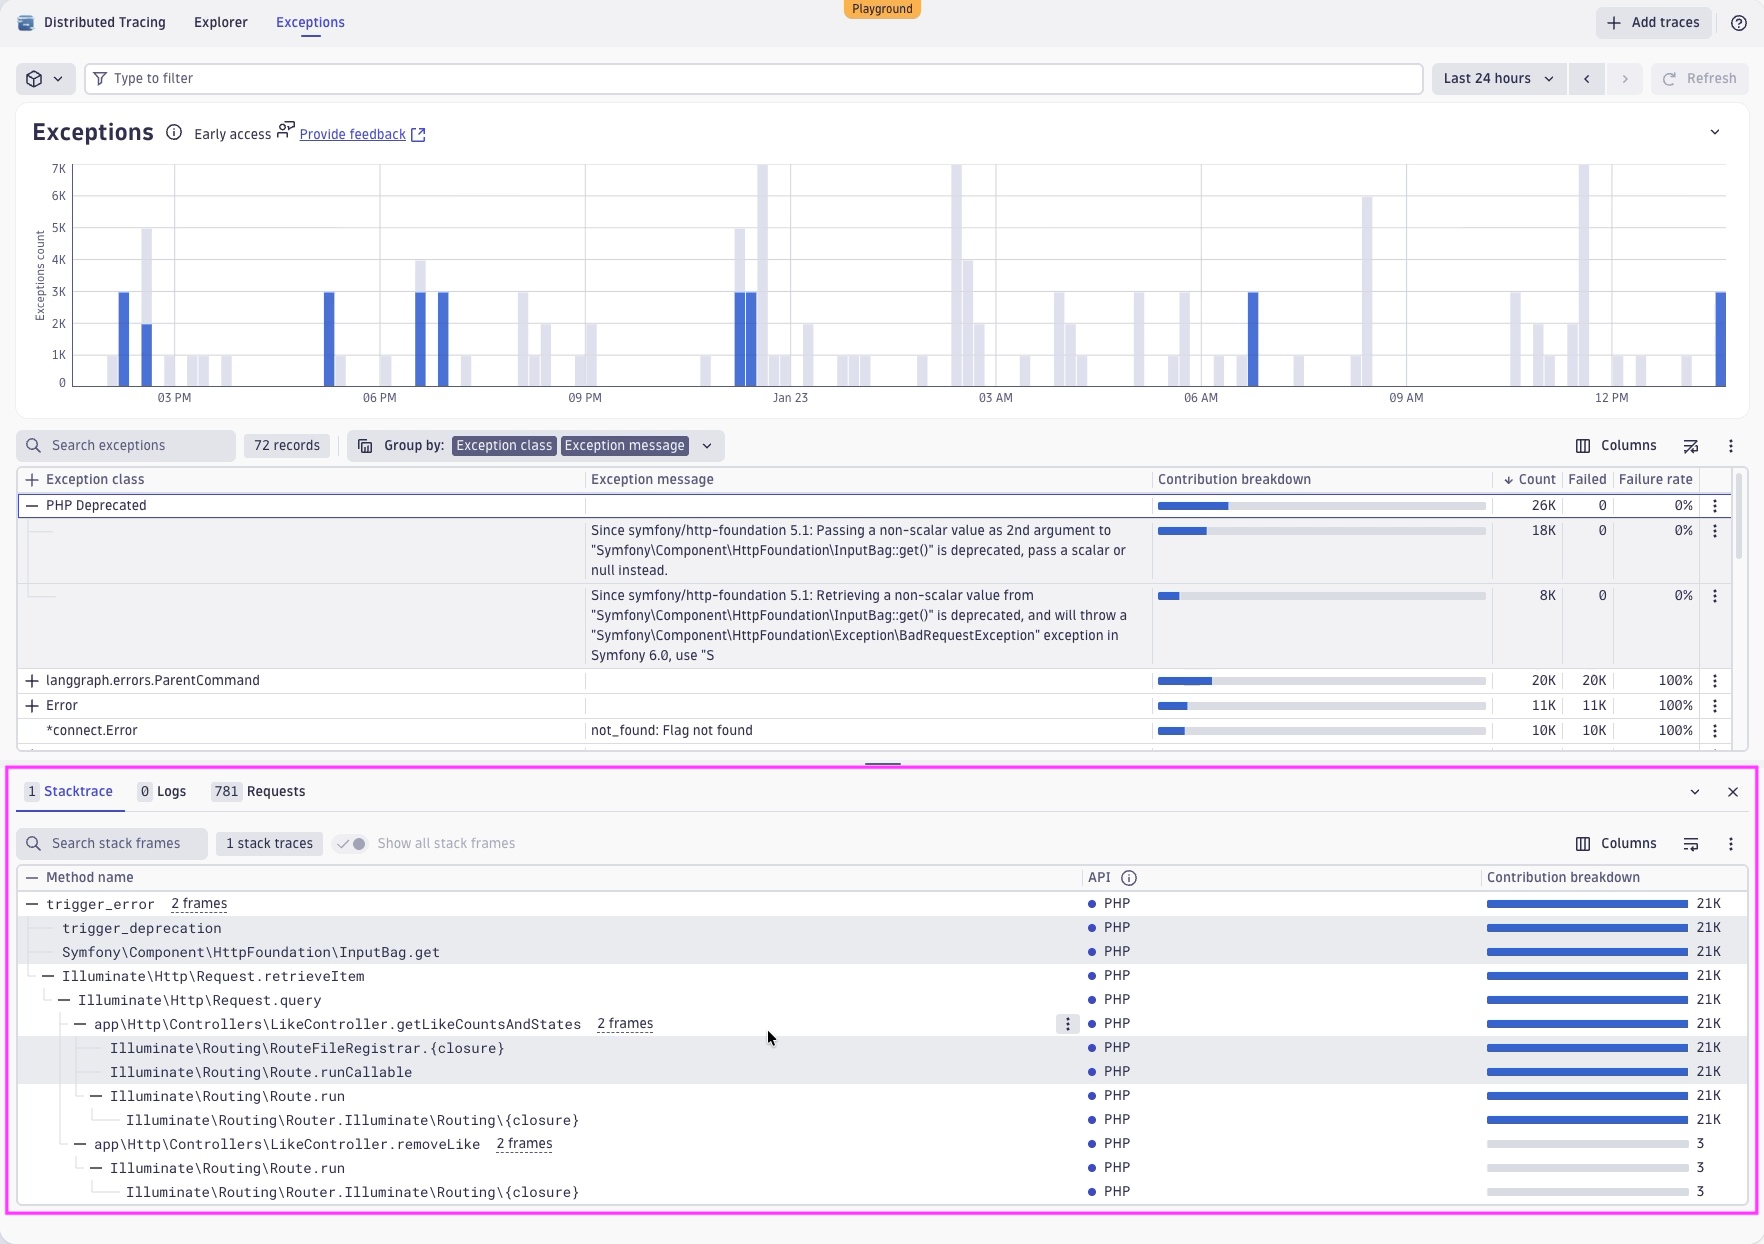
For developers, Dynatrace provides immediate access to related stack traces with all frames, making it easy to identify where and why an exception occurs. You can also view relevant logs and requests in context at the same location.
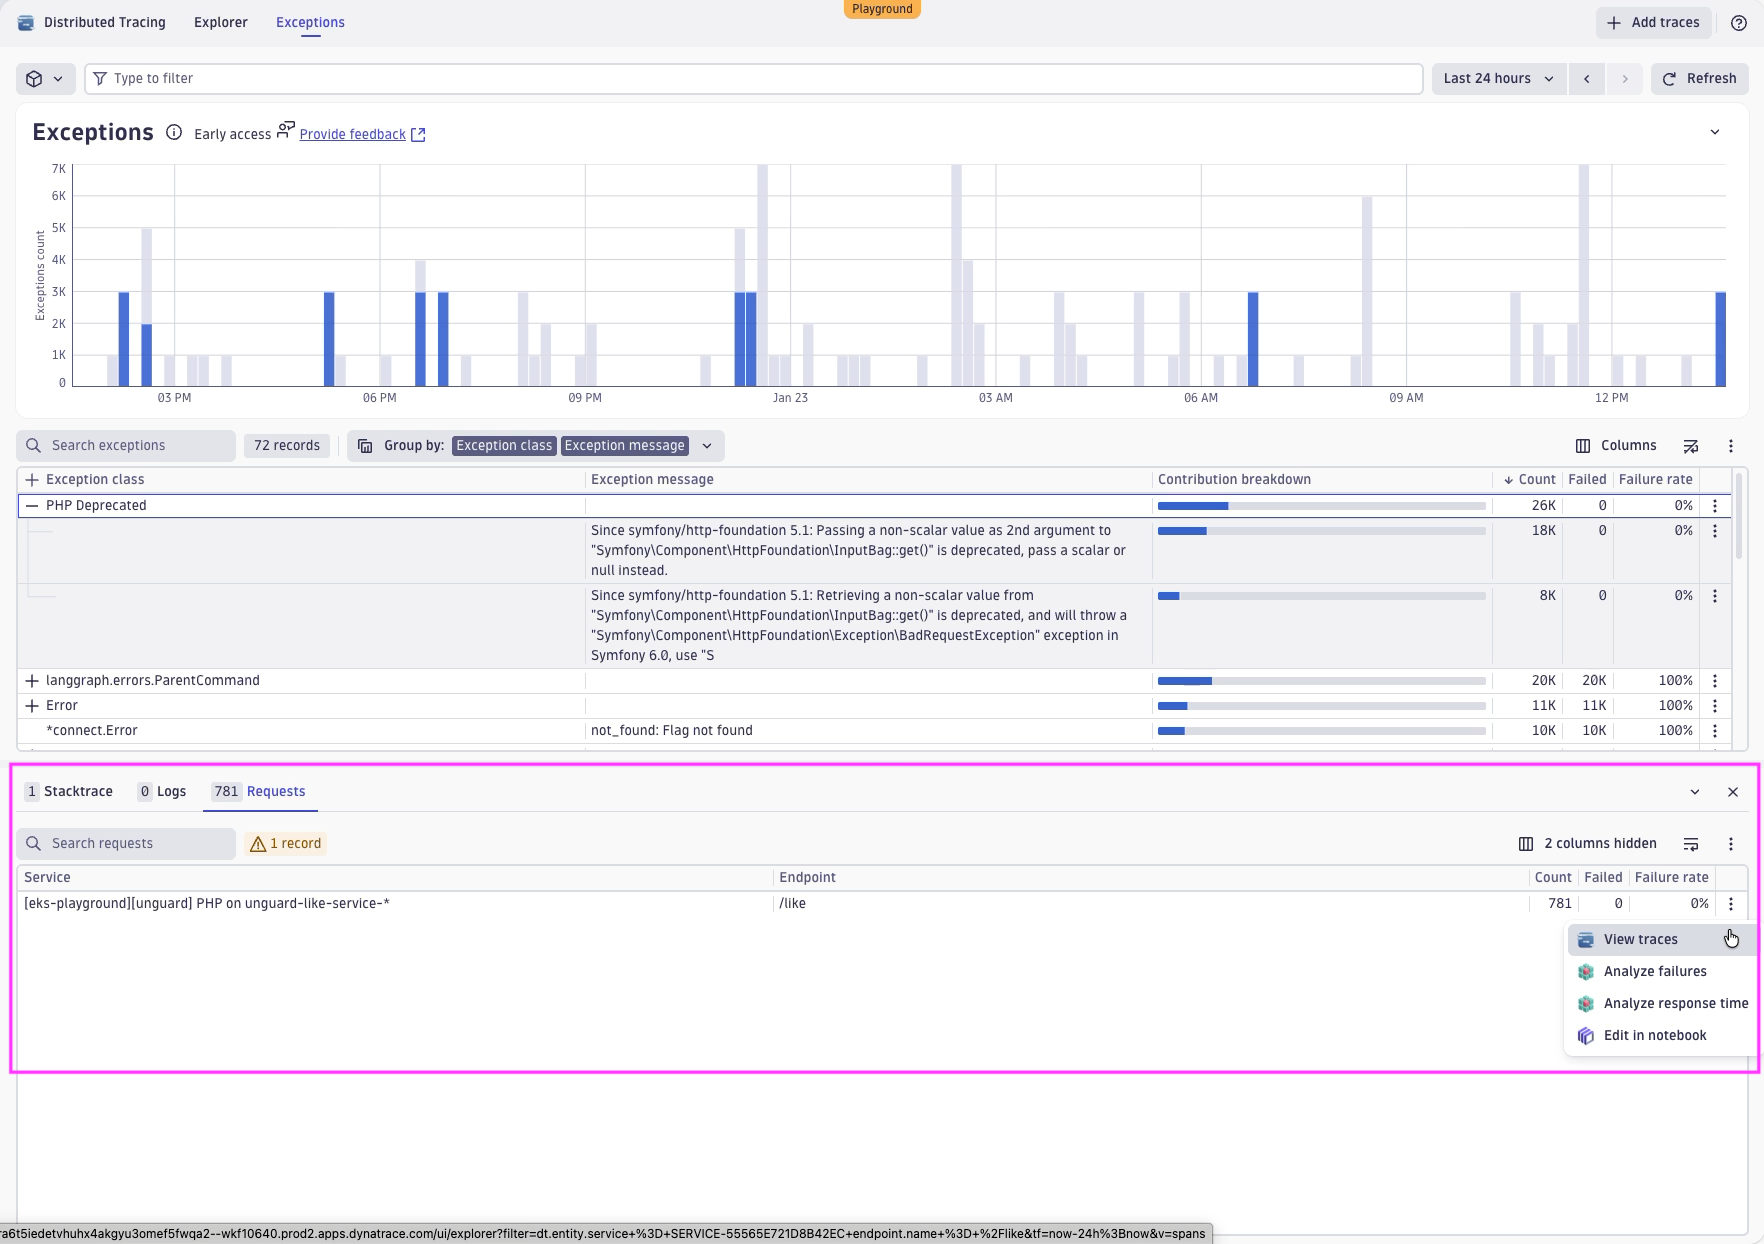
Back to our investigations, we also see that this exception is obviously happening on a specific PHP service on the endpoint /like. From there, we can also jump to specific instances of this exception by clicking on View Trace.
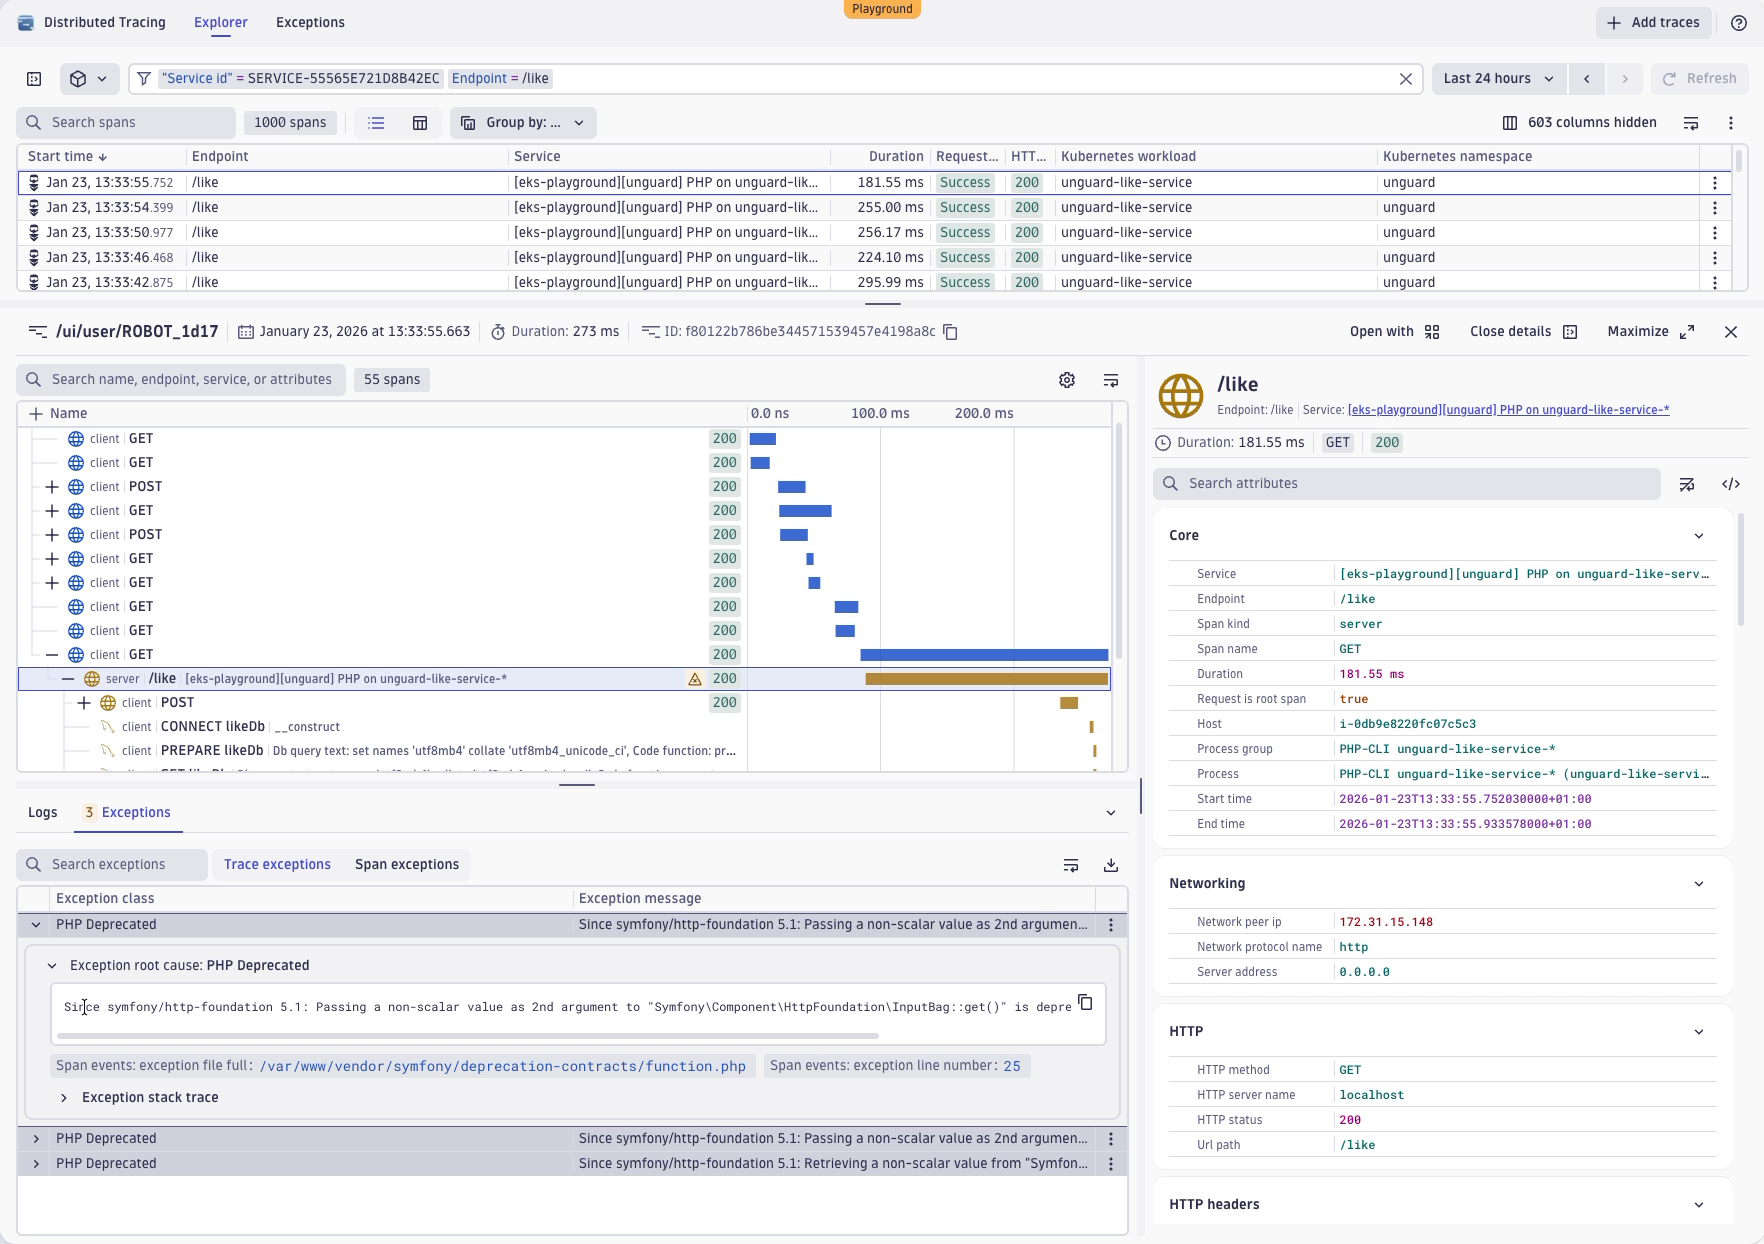
We’re now at the Explorer perspective, getting it filtered down to the specific endpoint on the specific service that we care about. And we also see the exception analysis across the trace. We see all exceptions that happen in the context of this trace, together with the trace.
We also see another reason why we had this high number of exceptions. It seems it is happening three times for this specific transaction. We now have a single occurrence of this exception, with a view of the exception message and the exception stack trace.
It also works the other way around. If you have a specific trace and you want to understand whether there’s more examples of a specific exception you can always drill up to the exception analysis to take a closer look.
For example, we can now examine this exception specifically, see only its occurrences, and identify exactly where it happens repeatedly over time.
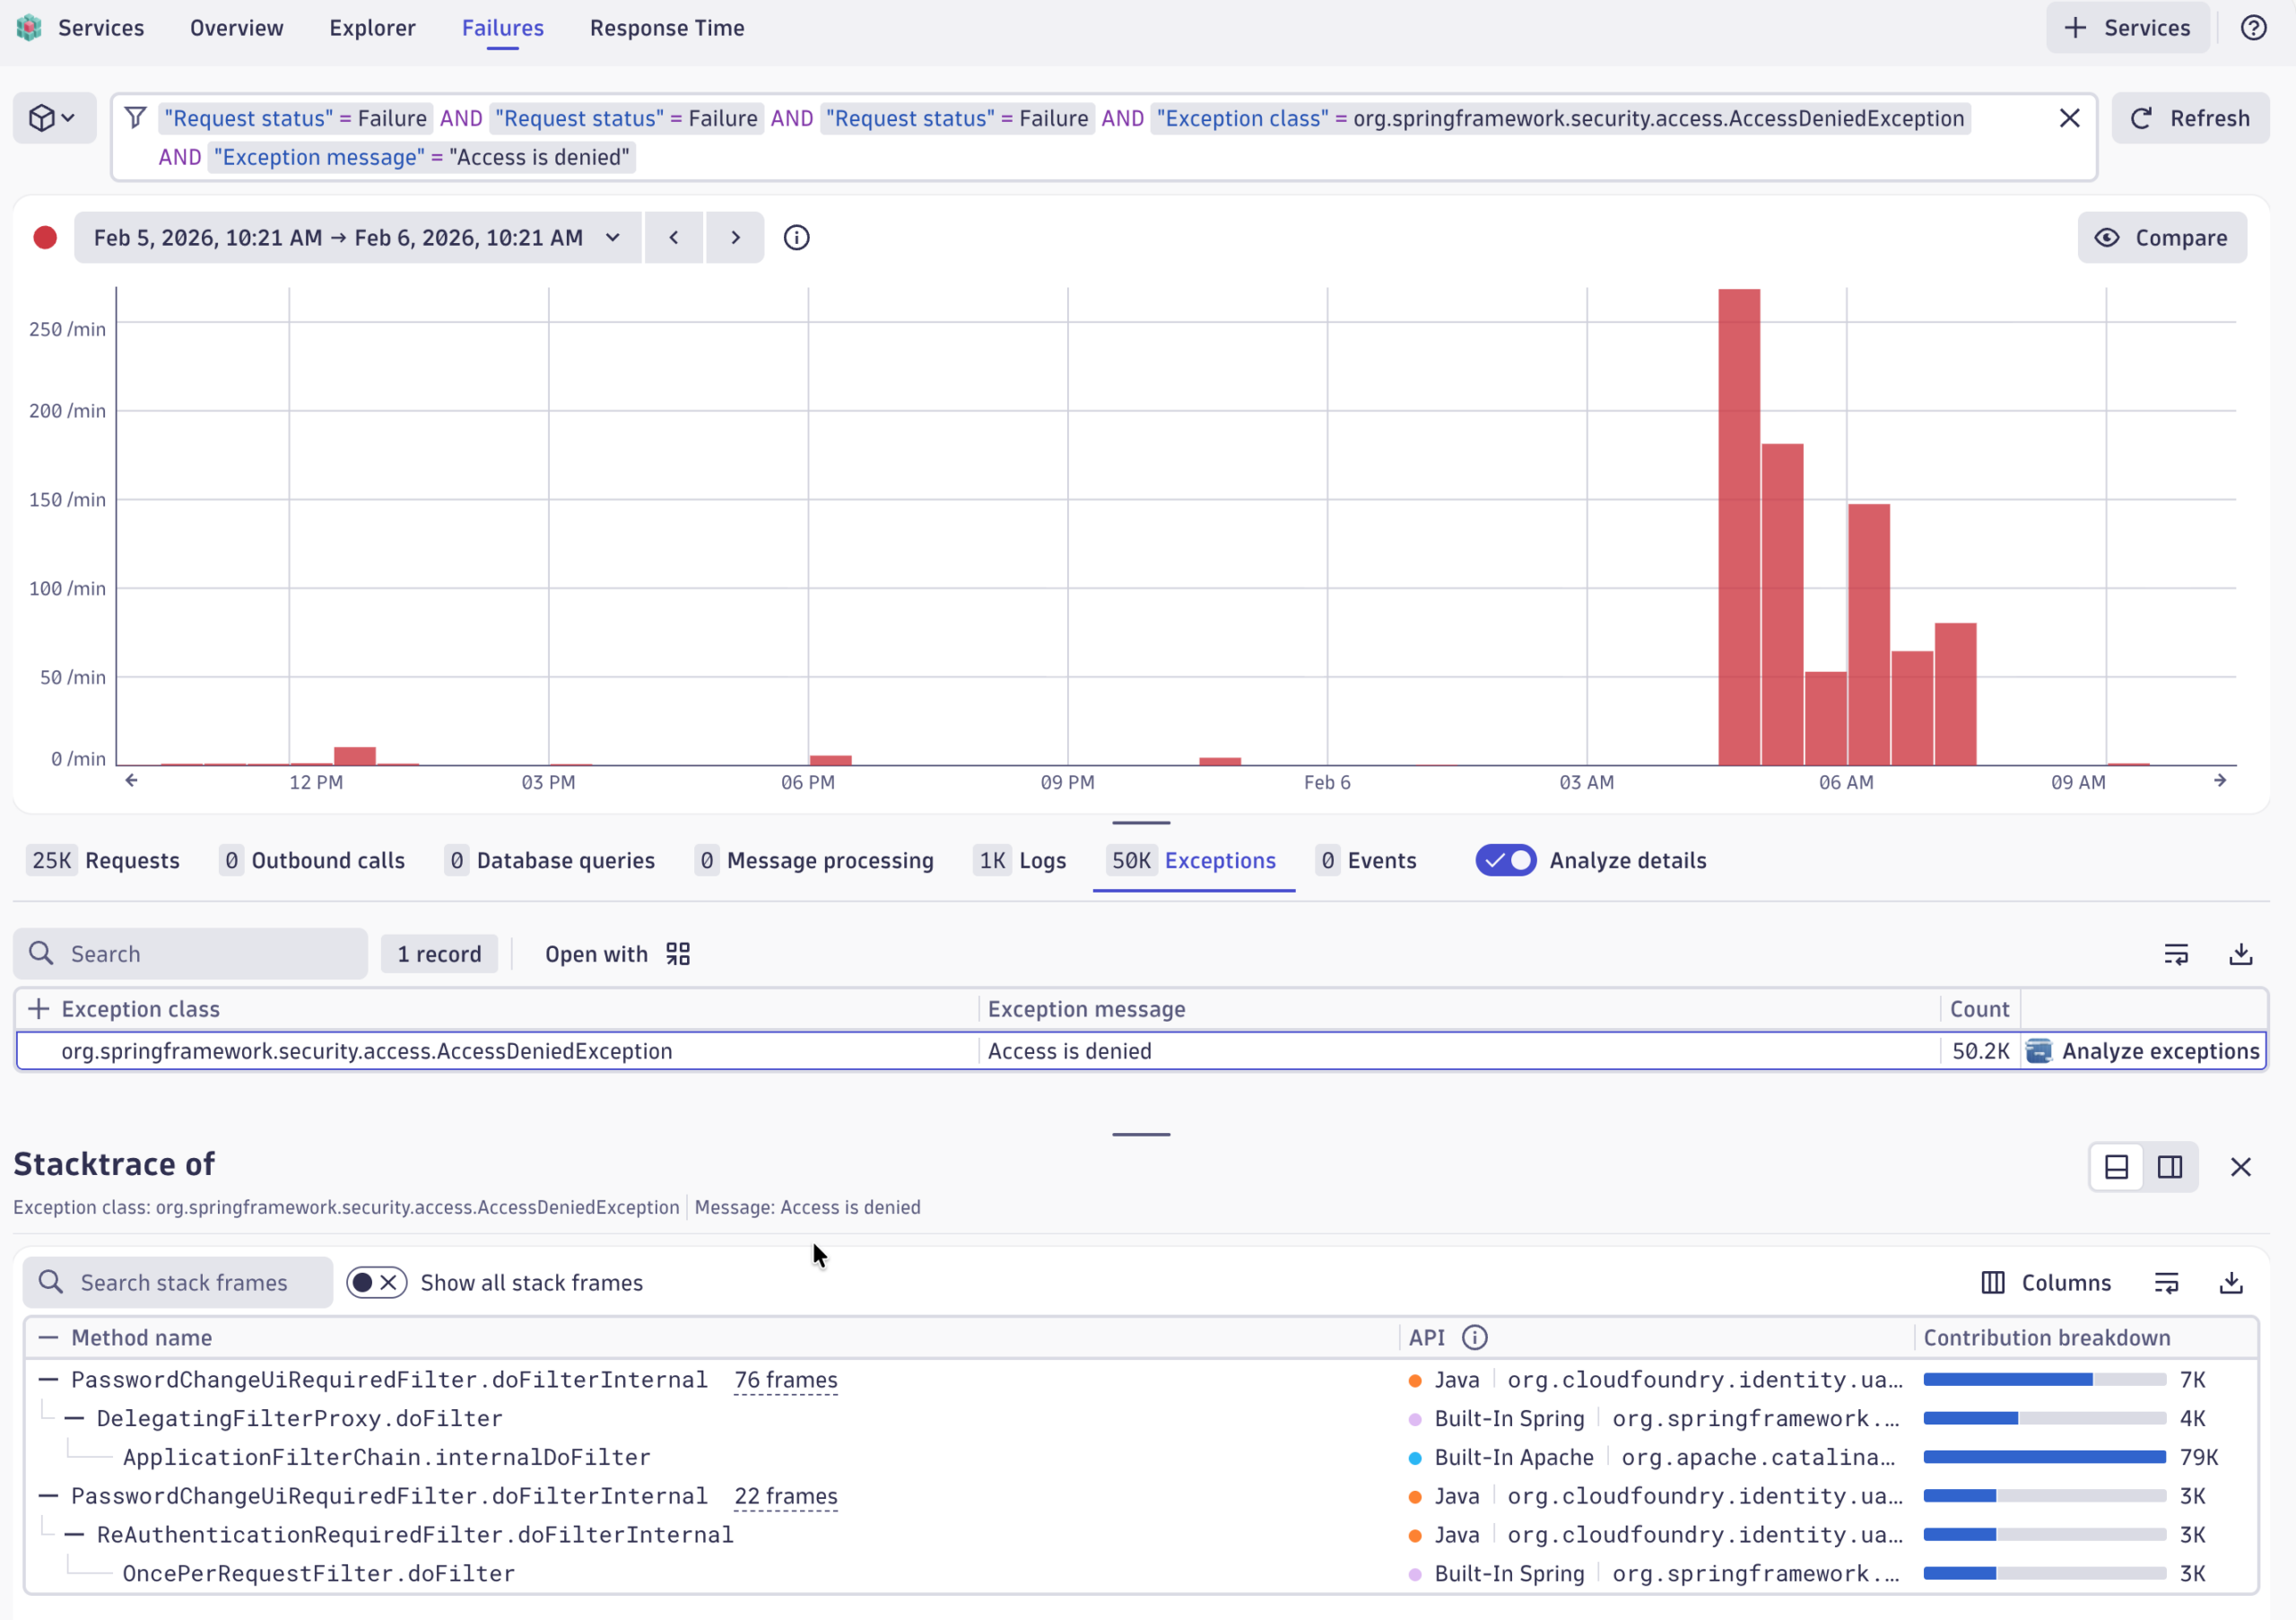
Investigating a failure caused by an exception
Sometimes an exception isn’t just a slowdown—it’s a real failure. When that happens, Dynatrace links the exception directly to the underlying failure and guides you to a detailed failure analysis, including the full stack trace captured in the context of the failed service call.
Key takeaways about exception analysis
Exception analysis enables developers to gain insights into exceptions and their behavior within the environment and their code so you can resolve issues more quickly.
And, Exceptions Analysis also works for OpenTelemetry. By following semantic conventions, any exceptions in OpenTelemetry spans will appear in Exceptions Analysis.
Top 3 takeaways from this demo:
- Exceptions are often the real reason a trace fails or slows down—and now you know how to view them easily with Dynatrace.
- Dynatrace shows exceptions across the whole trace, not just inside one span, and it supports both OpenTelemetry and OneAgent collection.
- An exception does not always mean that something failed, therefore you can quickly determine whether something broke or slowed down and if so where and what the impact is.
To learn more, check out the following resources.


Looking for answers?
Start a new discussion or ask for help in our Q&A forum.
Go to forum